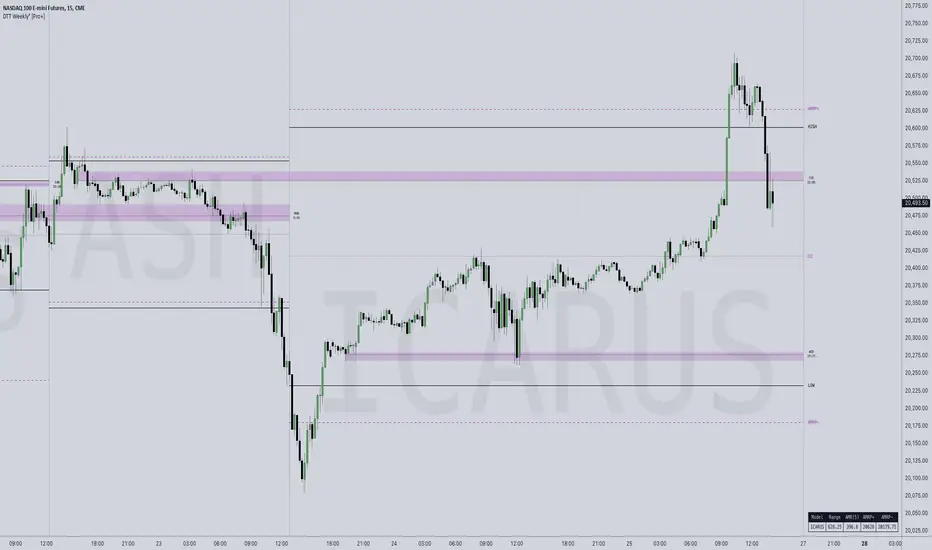
DTT Weekly Volatility Grid [Pro+] (NINE/ANARR)Introduction:
Automate Digital Time Theory (DTT) Weekly Models with the DTT Weekly Volatility Grid , leveraging the proprietary framework developed by Nine and Anarr. This tool allows to navigate the advanced landscape of Time-based statistical trading for futures, crypto, and forex markets.
Description:
Built on the Digital Time Theory (DTT), this script provides traders with a structured view of time and price interactions, ideal for swing insights. It divides the weekly range into Time models and inner intervals, empowering traders with data-driven insights to anticipate market expansions, detect Time-based distortions, and understand volatility fluctuations at specific Times during the trading week.
Key Features:
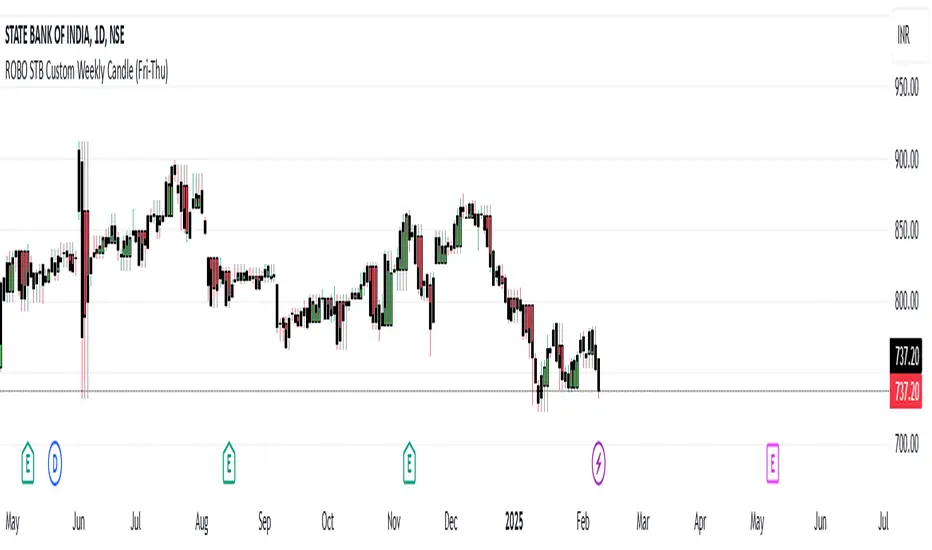
Time-Based Weekly Models and Volatility Awareness: The DTT Weekly Time Models automatically map onto your chart, highlighting critical volatility points in weekly sessions. These models help traders recognize potential shifts in the market, ideal for identifying larger, swing-oriented moves.
Average Model Range Probability (AMRP): The AMRP feature calculates the historical probability of reaching previous DTT Weekly Model Ranges. With AMRP and Standard Deviation metrics, traders can evaluate the likelihood of DTT model continuations or breaks, aligning their strategy with higher Timeframe volatility trends.
Root Candles and Liquidity Draws: Visualize Root Candles as liquidity draws, emphasizing premium and discount areas and marking the origin of a Time-based price movement. The tool allows traders to toggle features like opening prices and equilibrium points of each Root Candle. Observing accumulation or distribution zones around these candles provides crucial reference points for strategic swing entries and exits.
Extended Visualization of Weekly Model Ranges: Leverage previous weekly model ranges within the current Time model to observe historical high, low, and equilibrium levels. This feature aids traders in visualizing premium and discount ranges of prior models, pinpointing areas of liquidity and imbalance to watch.
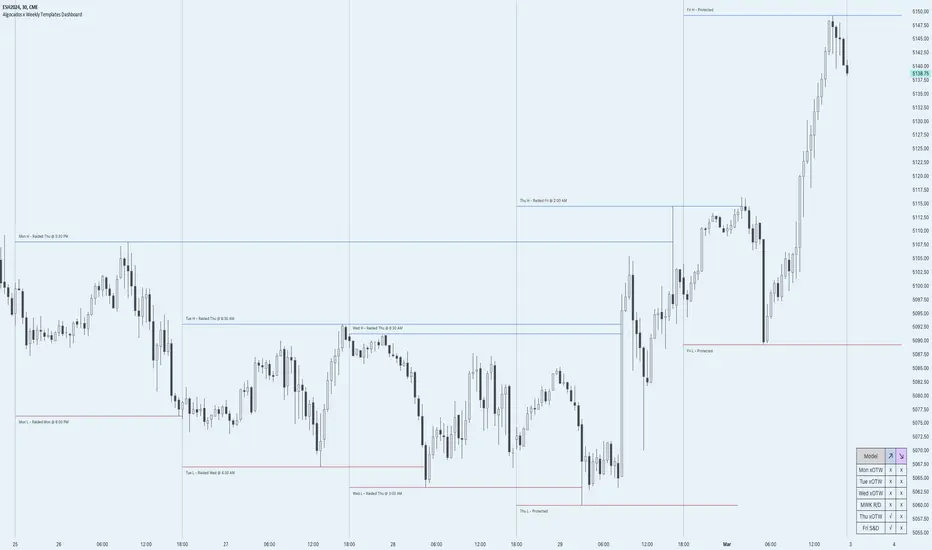
Customization Options: Tailor Time intervals with a variety of line styles (solid, dashed, dotted) and colours to customize each model. Adjust settings to display specific historical weekly models, apply custom labels, and create a personalized view that suits your trading style and focus.
Lookback Periods and Model Count: Select customizable lookback periods to display past models, offering insights into market behaviour over a chosen historical range. This feature enables clean, organized charts and allows analysts to add more models for detailed backtesting and analysis.
Detailed Real-Time Data Table: The live data table provides easy access to AMRP and range data for selected models. This table highlights model targets and anticipated ranges, offering insights into whether previous models have exceeded historical volatility expectations or remained within them.
How Traders Can Use The DTT Weekly Volatility Grid Effectively:
Identifying Premium and Discount Zones: Track weekly ranges using Root Candles and previous model equilibrium levels to assess if prices are trading in premium or discount areas. This information helps framing the broader swing outlook.
Timing Trades Based on Volatility: Recognize potential exhaustion points through AMRP insights or completed model distortions that may signal new expansions. By observing inner intervals and Root Candles, traders can identify periods of high market activity, assisting in Timing weekly entries and exits.
Avoiding Low Volatility Phases: AMRP calculations can indicate periods when price action may slow or become choppy. If price remains within AMRP deviations or near them, traders can adjust risk or step aside, awaiting more favourable conditions for volatility-driven trades as new inner intervals or model roots appear.
Designed for Swing Traders and Higher Timeframes: The Weekly DTT Models are suited for those looking to study higher timeframe trends across futures, forex, and crypto markets. This tool equips traders with volatility-aware, and data-driven insights during extended market cycles.
Usage Guidance:
Add DTT Weekly Volatility Grid (NINE/ANARR) to your TradingView chart.
Customize your preferred time intervals, model history, and visual settings for your session.
Use the data table to track average model ranges and probabilities, ensuring you align your trades with key levels.
Incorporate DTT Weekly Volatility Grid (NINE/ANARR) into your existing strategies to fine-tune your view through based on data-driven insights into volatility and price behaviour.
Terms and Conditions
Our charting tools are products provided for informational and educational purposes only and do not constitute financial, investment, or trading advice. Our charting tools are not designed to predict market movements or provide specific recommendations. Users should be aware that past performance is not indicative of future results and should not be relied upon for making financial decisions. By using our charting tools, the purchaser agrees that the seller and the creator are not responsible for any decisions made based on the information provided by these charting tools. The purchaser assumes full responsibility and liability for any actions taken and the consequences thereof, including any loss of money or investments that may occur as a result of using these products. Hence, by purchasing these charting tools, the customer accepts and acknowledges that the seller and the creator are not liable nor responsible for any unwanted outcome that arises from the development, the sale, or the use of these products. Finally, the purchaser indemnifies the seller from any and all liability. If the purchaser was invited through the Friends and Family Program, they acknowledge that the provided discount code only applies to the first initial purchase of the Toodegrees Premium Suite subscription. The purchaser is therefore responsible for cancelling – or requesting to cancel – their subscription in the event that they do not wish to continue using the product at full retail price. If the purchaser no longer wishes to use the products, they must unsubscribe from the membership service, if applicable. We hold no reimbursement, refund, or chargeback policy. Once these Terms and Conditions are accepted by the Customer, before purchase, no reimbursements, refunds or chargebacks will be provided under any circumstances.
By continuing to use these charting tools, the user acknowledges and agrees to the Terms and Conditions outlined in this legal disclaimer.
Script a pagamento