Colored Williams %RThis script is the same as Williams %R except that on green days we plot green and red on red days. If a bar opens and closes the same, we plot black.
Cerca negli script per "williams"

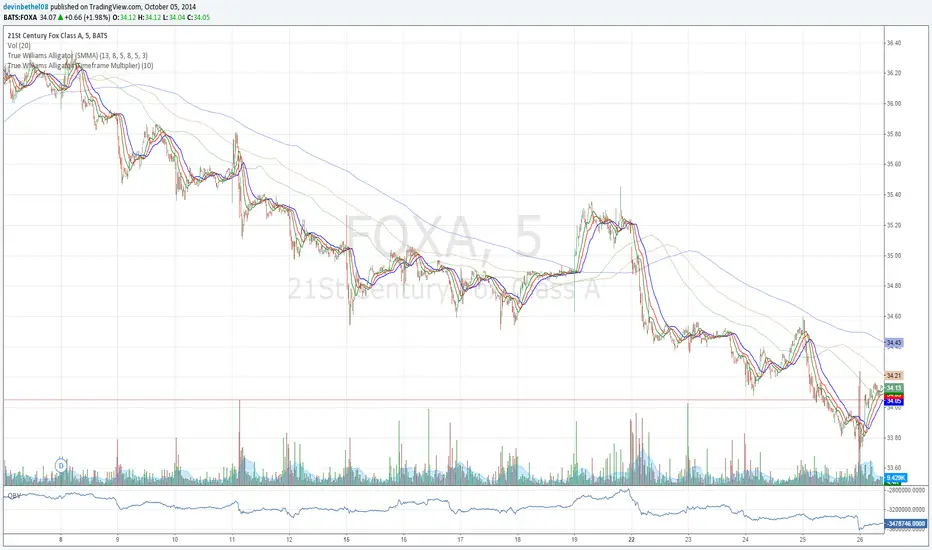
True Williams Alligator (Timeframe Multiplier)Modified version of my original "True Williams Alligator (SMMA)" indicator that includes a multiplier to show the alligator (ie elliot wave mode) of higher timeframes. See original indicator for details.
Note: First script submission. Didn't mean to use this chart. Ugly and messy. Oops.
Williams Squat BarsSquat bars are a battle of the bulls and the bears, with lots of buying and selling but little price movement.
A squat bar will be one of the top three OR bottom three bars 85% of the time at the end of a trend.
While all trends end with a squat, all squats are NOT the end of a trend.

Williams Vix Fix ultra complete indicator (Tartigradia)Williams VixFix is a realized volatility indicator developed by Larry Williams, and can help in finding market bottoms.
Indeed, as Williams describe in his paper, markets tend to find the lowest prices during times of highest volatility, which usually accompany times of highest fear. The VixFix is calculated as how much the current low price statistically deviates from the maximum within a given look-back period.
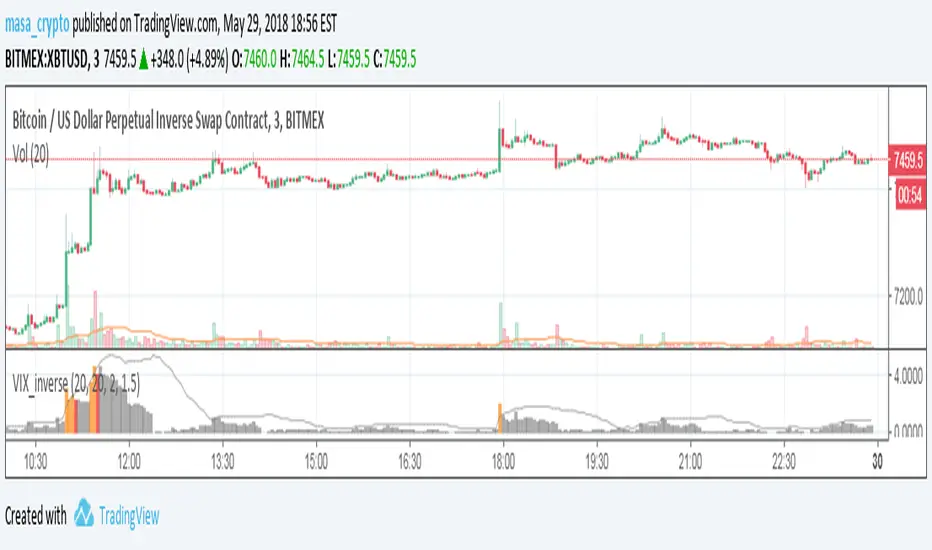
Although the VixFix originally only indicates market bottoms, its inverse may indicate market tops. As masa_crypto writes : "The inverse can be formulated by considering "how much the current high value statistically deviates from the minimum within a given look-back period." This transformation equates Vix_Fix_inverse. This indicator can be used for finding market tops, and therefore, is a good signal for a timing for taking a short position." However, in practice, the Inverse VixFix is much less reliable than the classical VixFix, but is nevertheless a good addition to get some additional context.
For more information on the Vix Fix, which is a strategy published under public domain:
* The VIX Fix, Larry Williams, Active Trader magazine, December 2007, web.archive.org
* Fixing the VIX: An Indicator to Beat Fear, Amber Hestla-Barnhart, Journal of Technical Analysis, March 13, 2015, ssrn.com
* Replicating the CBOE VIX using a synthetic volatility index trading algorithm, Dayne Cary and Gary van Vuuren, Cogent Economics & Finance, Volume 7, 2019, Issue 1, doi.org
Created By ChrisMoody on 12-26-2014...
V3 MAJOR Update on 1-05-2014
tista merged LazyBear's Black Dots filter in 2020:
Extended by Tartigradia in 10-2022:
* Can select a symbol different from current to calculate vixfix, allows to select SP:SPX to mimic the original VIX index.
* Inverse VixFix (from masa_crypto and web.archive.org)
* VixFix OHLC Bars plot
* Price / VixFix Candles plot (Pro Tip: draw trend lines to find good entry/exit points)
* Add ADX filtering, Minimaxis signals, Minimaxis filtering (from samgozman )
* Convert to pinescript v5
* Allow timeframe selection (MTF)
* Skip off days (more accurate reproduction of original VIX)
* Reorganized, cleaned up code, commented out parts, commented out or removed unused code (eg, some of the KC calculations)
* Changed default Bollinger Band settings to reduce false positives in crypto markets.
Set Index symbol to SPX, and index_current = false, and timeframe Weekly, to reproduce the original VIX as close as possible by the VIXFIX (use the Add Symbol option, because you want to plot CBOE:VIX on the same timeframe as the current chart, which may include extended session / weekends). With the Weekly timeframe, off days / extended session days should not change much, but with lower timeframes this is important, because nights and weekends can change how the graph appears and seemingly make them different because of timing misalignment when in reality they are not when properly aligned.

Williams Fractals + SMMAwilliams fractail + smoothed moving average. moving average. williams fractails with moving average , williams fractails + MA, smma

Williams A/D IndicatorWilliams A/D Indicator, with three choices of ema (regular, double, and zero-lag). Running sum of positive accumulation values (buying pressure) and negative distribution values (selling pressure), as determined by price's location within a given day's true range. Williams states that it is worth selling if the price makes a new high and the indicator fails to follow suit. As well, it's better to purchase if prices fall to a new bottom while the A/D indicator fails to reach a new low.


Williams_VIX_fix_inverseThe volatility index, Williams vix fix developed by Larry Williams, is a well-known index for finding market bottoms. It describes how much the current low price statistically deviates from the maximum within a given look-back period.
The inverse can be formulated by considering "how much the current high value statistically deviates from the minimum within a given look-back period." This transformation equates Vix_Fix_inverse. This indicator can be used for finding market tops, and therefore, is a good signal for a timing for taking a short position.
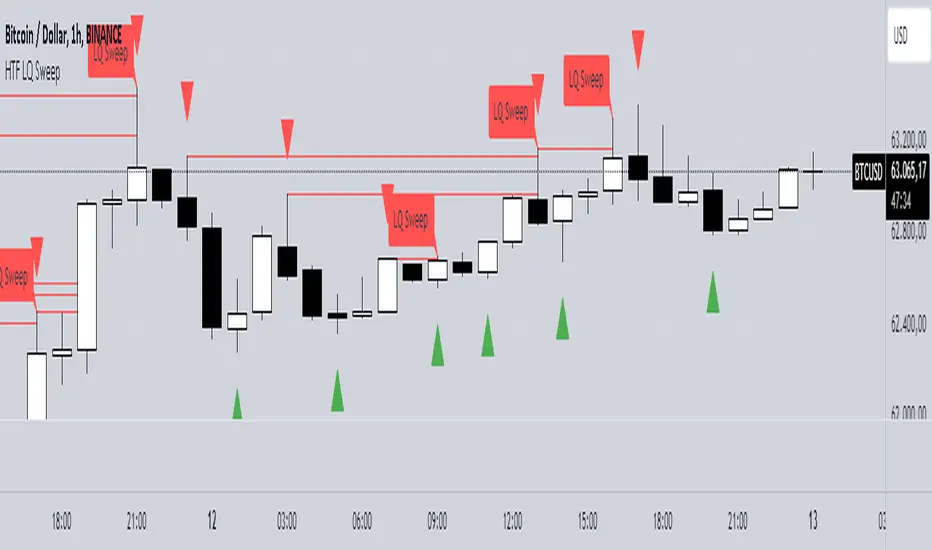
HTF LQ SweepThe following script recognises QL sweeps in the desired time frame with alarm function!
Theory:
There is liquidity above highs and below lows. If this is tapped and the market reacts strongly immediately, the probability of a reversal is greatly increased! In the chart, this is defined in such a way that a candle has its wicks BELOW the old low, but the close is ABOVE the old low. the same applies to the high, of course!
In such a case we have an "LQ Sweep"
How does the script work?
Williams 3 fractals are used as a basis. These are meaningful as lows or highs. Whenever a fractal is created, the price level is saved.
This means that not only the last fractal is relevant, but all historical fractals as long as they have not been reached!
If a candle reaches the level, but shows a rejection and closes within the level again, we have our "LQ Sweep" setup.
In the script you can select the timeframe in which the market has to be analysed. When the QL sweep occurs, an alert is triggered. This saves a lot of time because you can analyse different markets in different timeframes at the same time!
Each QL Sweep is marked in the chart when we are in the selected timeframe. These can also be deactivated so that only the last sweep is displayed.
Benefits for the trader:
An LQ sweep is a nice confirmation for a reversal.
If we have such an LQ sweep, we can wait in the lower timeframe for further confirmation, such as a structural break, to position our entries there.
The alarm function saves us a lot of time and we only go to the chart when a potential setup has been created.
You can set different time frames in the script: The selected time frame is then scanned and sends a signal when the event occurs.
Williams_proGO_PRICEVersione rivisitata del Williams ProGo che risulta essere direttamente sul grafico principale con aggiunta
delle medie classiche per controllo golden cross ed anche una serie di calcoli visibili nella finestra dati per il posizionamento
dei livelli stop loss e take profit calcolati con un atr


Fractal Trend Detector [Skyrexio]Introduction
Fractal Trend Detector leverages the combination of Williams fractals and Alligator Indicator to help traders to understand with the high probability what is the current trend: bullish or bearish. It visualizes the potential uptrend with the coloring bars in green, downtrend - in red color. Indicator also contains two additional visualizations, the strong uptrend and downtrend as the green and red zones and the white line - trend invalidation level (more information in "Methodology and it's justification" paragraph)
Features
Optional strong up and downtrends visualization: with the specified parameter in settings user can add/hide the green and red zones of the strong up and downtrends.
Optional trend invalidation level visualization: with the specified parameter in settings user can add/hide the white line which shows the current trend invalidation price.
Alerts: user can set up the alert and have notifications when uptrend/downtrend has been started, strong uptrend/downtrend started.
Methodology and it's justification
In this script we apply the concept of trend given by Bill Williams in his book "Trading Chaos". This approach leverages the Alligator and Fractals in conjunction. Let's briefly explain these two components.
The Williams Alligator, created by Bill Williams, is a technical analysis tool used to identify trends and potential market reversals. It consists of three moving averages, called the jaw, teeth, and lips, which represent different time periods:
Jaw (Blue Line): The slowest line, showing a 13-period smoothed moving average shifted 8 bars forward.
Teeth (Red Line): The medium-speed line, an 8-period smoothed moving average shifted 5 bars forward.
Lips (Green Line): The fastest line, a 5-period smoothed moving average shifted 3 bars forward.
When the lines are spread apart and aligned, the "alligator" is "awake," indicating a strong trend. When the lines intertwine, the "alligator" is "sleeping," signaling a non-trending or range-bound market. This indicator helps traders identify when to enter or avoid trades.
Williams Fractals, introduced by Bill Williams, are a technical analysis tool used to identify potential reversal points on a price chart. A fractal is a series of at least five consecutive bars where the middle bar has the highest high (for a up fractal) or the lowest low (for a down fractal), compared to the two bars on either side.
Key Points:
Up fractal: Formed when the middle bar shows a higher high than the two preceding and two following bars, signaling a potential turning point downward.
Down fractal: Formed when the middle bar has a lower low than the two surrounding bars, indicating a potential upward reversal.
Fractals are often used with other indicators to confirm trend direction or reversal, helping traders make more informed trading decisions.
How we can use its combination? Let's explain the uptrend example. The up fractal breakout to the upside can be interpret as bullish sign, there is a high probability that uptrend has just been started. It can be explained as following: the up fractal created is the potential change in market's behavior. A lot of traders made a decision to sell and it created the pullback with the fractal at the top. But if price is able to reach the fractal's top and break it, this is a high probability sign that market "changed his opinion" and bullish trend has been started. The moment of breaking is the potential changing to the uptrend. Here is another one important point, this breakout shall happen above the Alligator's teeth line. If not, this crossover doesn't count and the downtrend potentially remaining. The inverted logic is true for the down fractals and downtrend.
According to this methodology we received the high probability up and downtrend changes, but we can even add it. If current trend established by the indicator as the uptrend and alligator's lines have the following order: lips is higher than teeth, teeth is higher than jaw, script count it as a strong uptrend and start print the green zone - zone between lips and jaw. It can be used as a high probability support of the current bull market. The inverted logic can be used for bearish trend and red zones: if lips is lower than teeth and teeth is lower than jaw it's interpreted by the indicator as a strong down trend.
Indicator also has the trend invalidation line (white line). If current bar is green and market condition is interpreted by the script as an uptrend you will see the invalidation line below current price. This is the price level which shall be crossed by the price to change up trend to down trend according to algorithm. This level is recalculated on every candle. The inverted logic is valid for downtrend.
How to use indicator
Apply it to desired chart and time frame. It works on every time frame.
Setup the settings with enabling/disabling visualization of strong up/downtrend zones and trend invalidation line. "Show Strong Bullish/Bearish Trends" and "Show Trend Invalidation Price" checkboxes in the settings. By default they are turned on.
Analyze the price action. Indicator colored candle in green if it's more likely that current state is uptrend, in red if downtrend has the high probability to be now. Green zones between two lines showing if current uptrend is likely to be strong. This zone can be used as a high probability support on the uptrend. The red zone show high probability of strong downtrend and can be used as a resistance. White line is showing the level where uptrend or downtrend is going be invalidated according to indicator's algorithm. If current bar is green invalidation line will be below the current price, if red - above the current price.
Set up the alerts if it's needed. Indicator has four custom alerts called "Uptrend has been started" when current bar closed as green and the previous was not green, "Downtrend has been started" when current bar closed red and the previous was not red, "Uptrend became strong" if script started printing the green zone "Downtrend became strong" if script started printing the red zone.
Disclaimer:
Educational and informational tool reflecting Skyrex commitment to informed trading. Past performance does not guarantee future results. Test indicators before live implementation.

Fractal Trail [UAlgo]The Fractal Trail is designed to identify and utilize Williams fractals as dynamic trailing stops. This tool serves traders by marking key fractal points on the chart and leveraging them to create adaptive stop-loss trails, enhancing risk management and trade decision-making.
Williams fractals are pivotal in identifying potential reversals and critical support/resistance levels. By plotting fractals dynamically and providing configurable options, this indicator allows for personalized adjustments based on the trader's strategy.
This script integrates both visual fractal markers and adjustable trailing stops, offering insights into market trends while catering to a wide variety of trading styles and timeframes.
🔶 Key Features
Williams Fractals Identification: The indicator marks Williams Fractals on the chart, which are significant highs and lows within a specified range. These fractals are crucial for identifying potential reversal points in the market.
Dynamic Trailing Stops: The indicator generates dynamic trailing stops based on the identified fractals. These stops adjust automatically as new fractals are formed, providing a responsive and adaptive approach to risk management.
Fractal Range: Users can specify the number of bars to the left and right for analyzing fractals, allowing for flexibility in identifying significant price points.
Trail Buffer Percentage: A percentage-based safety margin can be added between the fractal price and the trailing stop, providing additional control over risk management.
Trail Invalidation Source: Users can choose whether the trailing stop flips based on candle closing prices or the extreme points (high/low) of the candles.
Alerts and Notifications: The indicator provides alerts for when the price crosses the trailing stops, as well as when new Williams Fractals are confirmed. These alerts can be customized to fit the trader's notification preferences.
🔶 Interpreting the Indicator
Fractal Markers: The triangles above and below the bars indicate Williams Fractals. These markers help traders identify potential reversal points in the market.
Trailing Stops: The dynamic trailing stops are plotted as lines on the chart. These lines adjust based on the latest identified fractals, providing a visual representation of potential support and resistance levels.
Fill Colors: The optional fill colors between the trailing stops and the price action help traders quickly identify the current trend and potential pullback zones.
🔶 Disclaimer
Use with Caution: This indicator is provided for educational and informational purposes only and should not be considered as financial advice. Users should exercise caution and perform their own analysis before making trading decisions based on the indicator's signals.
Not Financial Advice: The information provided by this indicator does not constitute financial advice, and the creator (UAlgo) shall not be held responsible for any trading losses incurred as a result of using this indicator.
Backtesting Recommended: Traders are encouraged to backtest the indicator thoroughly on historical data before using it in live trading to assess its performance and suitability for their trading strategies.
Risk Management: Trading involves inherent risks, and users should implement proper risk management strategies, including but not limited to stop-loss orders and position sizing, to mitigate potential losses.
No Guarantees: The accuracy and reliability of the indicator's signals cannot be guaranteed, as they are based on historical price data and past performance may not be indicative of future results.

ChaosThis script adds a Bill Williams Alligator to your charts and the three wisemen:
1. Wiseman 1 - Bullish or bearish divergent bars shown with a circle (be sure to check angulation manually).
2. Wiseman 2 - Super AO - with a square.
3 Wiseman 3 - Fractal with a triangle.
Be sure to wait until the current bar is closed before using these signals.
Reference: TradingChaos Version 2

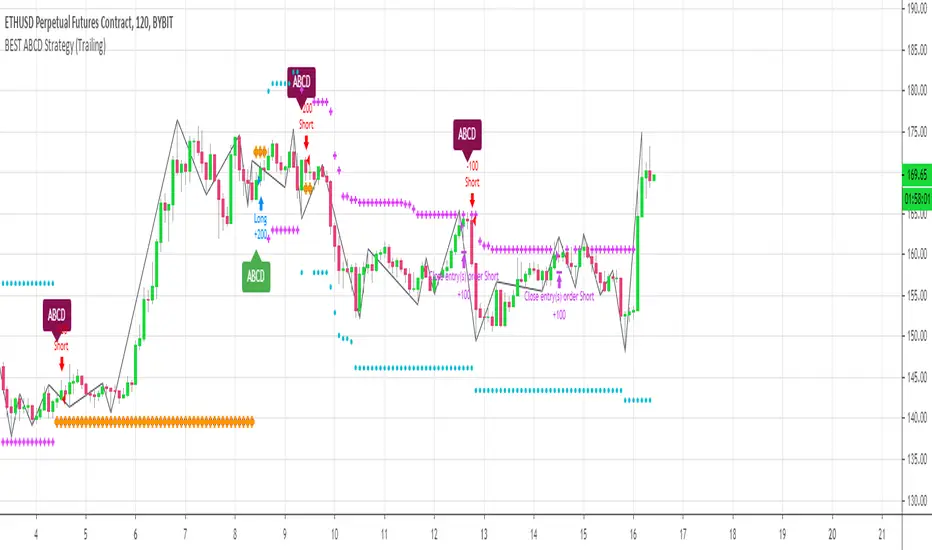
[Daveatt] BEST ABCD Pattern Strategy (Trailing SL + TP)Hello traders
This is the strategy version of my ABCD pattern. I added the Trailing Stop and Trailing Profit upon a follower request
I - Concept
I present to you, ladies and gentlemen, the first screener for harmonic patterns .
Starting with an ACBD pattern screener this time!!
I used the calculations from Ricardo Santo's script
In short, he's using fractals (regular or Bill Williams ) for the pattern calculations. A masterpiece !!!
II - Definitions
The ABCD pattern ( AB=CD ) is one of the classic chart patterns which is repeated over and over again.
The ABCD pattern shows perfect harmony between price and time.
The Williams Fractal is an indicator, developed by Bill Williams , that aims to detect reversal points (highs and lows) and marks them with arrows.
Up fractals and down fractals have specific shapes. The Williams Fractal indicator helps users determine in which direction price will develop
💎Strategy filters💎
I included some cool backtest filters:
- Trailing stop with trigger concept coming from this Trailing Stop Strategy
- Trailing profit with trigger coming from this Trailing Profit Strategy
Last words
It works for all asset classes (Forex, crypto, indices, etc...) and does not repaint
All the BEST
Dave
DR/IDR fractals break candle (ChadAnt)This indicator is an Opening Range Breakout (ORB) tool. It identifies the high and low price range established during a specific time window (e.g., the first hour of trading, 9:30–10:30 AM NY time). Once that time window closes, it watches for the price to "break out" of that range and projects profit targets based on the size of the initial range.
Key Features & How They Work
1. The Opening Range (The Box)
Time Window: The indicator waits for your specific start time (default 9:30 AM NY). It does not draw anything before this time.
The "Wicks": It tracks the absolute highest and lowest prices reached during this time (the Wicks). These act as your Breakout Triggers.
The "Body": It tracks the highest and lowest candle closes/opens during this time. This creates a shaded "zone" on your chart, representing the core area where most trading occurred.
Shading: To keep your chart clean, the background shading only appears during the forming time window.
2. Breakout Signals
Once the time window ends (e.g., 10:30 AM), the indicator "locks" the levels.
It then waits for a candle to move above the Wick High or below the Wick Low.
The Signal: When this happens, a label ("BREAK") appears on the chart.
Green Label: Bullish breakout (price went above the range).
Red Label: Bearish breakout (price went below the range).
Note: It only signals the first breakout of the day to avoid false alarms during choppy markets.
3. Extension Targets (Profit Levels)
When a breakout signal occurs, the indicator automatically draws target lines (extensions).
Calculation: These targets are based on the height of the "Body" zone (the shaded area).
Example: If your setting is 1.0, the indicator measures the height of the shaded body range and projects that exact distance above the breakout point. This is often used as a "Measured Move" target.
You can customize how many lines appear and how far apart they are (e.g., 0.5, 1.0, 1.5 times the range size).
4. Williams Fractals
During the opening range time, the indicator looks for specific price patterns called "Williams Fractals" (a 5-candle pattern that highlights potential turning points).
If a fractal peak or valley occurs inside your opening range, it marks it with a small triangle (▲ or ▼). Traders often use these as early signs of support or resistance forming inside the range.
5. Clean Visuals
Line Cutoff: You can set a "Stop Time" (e.g., 16:00 or 4:00 PM). The lines will stop drawing at that time so they don't clutter your chart overnight.
Gap Handling: The lines are programmed to break cleanly between days, so you don't see messy diagonal lines connecting yesterday's close to today's open.
Summary of Settings You Can Change
Session Time: When the range starts and ends.
Line Stop Time: When the lines should disappear for the day.
Visuals: Colors, line width, and style (solid, dotted, dashed).
Extensions: How many target lines to draw and the step size (e.g., 0.5x, 1.0x).
Fractals: Toggle the triangle icons on/off.

Zigzag Simple [SCL]🟩 OVERVIEW
Draws zigzag lines from pivot Highs to pivot Lows. You can choose between three different ways of calculating pivots:
• True Highs and Lows
• Williams pivots
• Oscillator pivots
🟩 HOW TO USE
This indicator can be used to understand market structure, which is arguably the primary thing you need to be aware of when trading. The zigzag by itself does not display a market structure bias, nor any information about prices of pivots, HH and HL labels, or anything like that. Nevertheless, a simple zigzag is perhaps the easiest and most intuitive way to understand what price is doing.
Choose a pivot style that you like, customise the colours and line style, and enjoy!
🟩 PIVOT TYPES EXPLAINED
True Highs and Lows
This is not an invention of mine (all credit to my humble mentor), but I haven't seen anyone else code them up. A true High is a close below the low of the candle with the highest high. A true Low is a close above the high of a candle with the lowest low. These are solid, price action-based pivots that can sometimes confirm quickly.
Williams pivots
This is how most people calculate pivots. They're simply the highest high for x bars back and x bars forwards. They're the vanilla of pivots IMO: serviceable but not very interesting. They're very convenient to code because there are built-in Pine functions for them: ta.pivothigh and ta.pivotlow . They confirm a predictable number of bars after they happen, which is great for coding but also makes the trader wait for confirmation.
Oscillator pivots
This is a completely different concept, which uses momentum in order to define pivots. For example, when you get a rise in momentum and momentum then drops a configurable amount, it confirms a pivot high, and vice versa for a pivot low. I don't know if anyone else does it –- although some indicators do mark pivots in momentum itself, and plenty do divergences, I wasn't able to find one that specifically marked *pivots in price* because of pivots in momentum 🤷♂️
Anyway, while this approach needs a whole investigation on its own, here we simply plot some pivots in a smoothed RSI. This indicator doesn't plot the actual momentum values -- for a more visual understanding of how this works, refer to the examples in the OscillatorPivots library.
🟩 UNIQUE ADVANTAGES
In contrast to other zigzag indicators available, this one lets you choose between the standard and some more unique methods of generating the zigzags. Additionally, because it's based on libraries, it is relatively easy for programmers to use as a basis for experimentation.
🟩 GEEK STUFF
Although there is considerable practical use for pivot-based zigzags in trading, this script is primarily a demonstration in coding -- specifically the power of libraries!
Most of the script consists of setup, especially defining inputs. The final section sacrifices some readability for conciseness, simply to emphasise how little code you need when the heavy lifting is done by libraries .
The actual calculations and drawing are achieved in just 8 lines.
The equivalent code in the libraries is ~250 lines long.
All libraries used are my own, public and open-source:
• MarketStructure
• DrawZigZag
• OscillatorPivots

Fractals PivotsWhich trader does not know pivots? There are a lot of varieties of pivots indicators of which some are a default on most trading platforms. So what better way to challenge yourself then to create your own kind of pivots. Let's welcome the idea of Fractal Pivots.
Williams Fractal or fractals is a technical analysis indicator introduced by the famous trader Bill Williams in his book ‘Trading Chaos’. He developed it on the basis of the Chaos Theory and trading psychology. The indicator is centred around the idea that there is repetition in price behaviour and fractals can provide an insight into those repetitive patterns.
How does the indicator turn these into pivot lines?
The user will set a time period in which the script will look for fractals. It will then remember all the fractals that happen during that time period.
Let's say you are trading the hourly chart with a weekly pivot setting like in the chart this script is published on. The script will highling the 1h fractals that are happening. Then the next week it will use these exact fractals from previous week to draw the pivot lines.
Another example here is an 8h chart. Look how it uses the previous week fractals this week.
Let me know if you find a very great fractal length+timeframe setting where the levels really get respected. I would really appreciate that.

Williams %R & RSI with Multiple PeriodsDESCRIPTION
1. Calculates %R and RSI with multiple period lengths.
1 period length value is defined by User.
8 period length values follow User's selection of classic number sequences, e.g. Fibonacci, Leonardo, Lucas, Narayana, etc.
2. User selects which indicator and periods to display or hide.
DEFAULTS
%R default custom period: 10.
RSI default custom period: 14.
%R & RSI default number sequence periods: Lucas numbers 11, 18, 29, 47, 76, 123, 199, 322.
CALCULATIONS
%R = (period high - most recent period's close price)/(period high - period low)
RSI = 100 - 1 / (100 + RS), where RS = SMMA(up, period) / SMMA(down, period)
PURPOSE
1. Identify price trends.
CREDITS
1. Williams %R technical analysis momentum oscillator by Larry Williams.
2. Wilder's Relative Strength Index technical analysis momentum oscillator by J. Welles Wilder.
3. "Solarized" color scheme by Ethan Schoonover.
DR/IDR, fractals, break + EMA Clouds + VWAPThis indicator is a powerful, multi-layered trading tool that combines three distinct forms of market analysis—volume, trend, and opening volatility—onto a single chart.
1. Opening Range Breakout (ORB) System
This is the foundation of the indicator, designed to capture the initial volatility and set key price boundaries for the trading day.
Time Focus: The indicator's primary analysis is centered on a specific, user-defined time period (default is 9:30 AM to 10:30 AM New York Time). Nothing related to the ORB drawing will appear on the chart before this session starts.
Wick High/Low (The Trigger): These lines track the absolute highest and lowest prices reached during the time window. They define the full extent of the initial range and are used to determine when a genuine breakout occurs.
Body High/Low (The Range & Targets): These lines track the highest and lowest open/close prices of the candles within the session. This area forms the central, shaded zone, representing the core consolidation area.
Range Shading: The background between the Body High and Body Low is shaded, but this visual feature only appears during the active forming time window (e.g., 9:30 AM to 10:30 AM) to maintain chart clarity.
Fractals: While the range is forming, the indicator detects 5-bar Williams Fractal patterns that occur inside the range. These small triangles (▲ or ▼) highlight minor reversal points established by the early trading action.
Breakout Signal: After the user-defined time window closes, the indicator waits. If a subsequent candle's price moves above the Wick High or below the Wick Low, a "BREAK" label is displayed on that candle. It is programmed to label only the first decisive break in each direction per day.
Extension Targets: When a breakout occurs, target lines are automatically projected above the Body High (for a bullish break) or below the Body Low (for a bearish break). The distance between these targets is calculated based on a user-defined fraction (e.g., 0.5 steps) of the total height of the Body Range.
Line Cutoff: For tidiness, you can set a "Stop Time" (e.g., 4:00 PM) after which the ORB lines will automatically disappear.
2. EMA Clouds (Trend and Momentum)
Four distinct Exponential Moving Average (EMA) clouds are plotted to provide a dynamic, multi-speed view of the market's trend and momentum.
Structure: Each "Cloud" is the shaded area between two EMAs (one shorter length and one longer length). The indicator includes four customizable pairs (defaulting to common settings like 8/9, 8/14, 34/50, and 14/21).
Trend Coloring: The clouds are color-coded:
Bullish (Greenish): The shorter EMA is trading above the longer EMA, signaling upward momentum.
Bearish (Reddish): The shorter EMA is trading below the longer EMA, signaling downward momentum.
Application: These clouds are used to confirm the overall market direction or identify potential zones of support and resistance.
3. Volume-Weighted Average Price (VWAP)
The VWAP is a crucial anchor for measuring the market's efficiency throughout the trading day.
Function: It calculates the average price of the asset, giving more weight to prices where higher volume was traded.
Context: It helps traders quickly determine if the current price is trading at a premium (above VWAP) or a discount (below VWAP) relative to the day's volume.
Reset: The VWAP line automatically resets at the beginning of each trading day.
Customization: The VWAP line can be toggled on or off, and its color and width are fully adjustable.

Williams Accelerator Oscillator — ACWhat it is
The Accelerator Oscillator (AC) measures the acceleration/deceleration of momentum. It’s derived from the Awesome Oscillator (AO) and shows whether momentum is speeding up or slowing down. In this implementation, columns are green when AC rises vs. the previous bar and red when it falls.
How it’s calculated
Price source: Median Price (HL2) by default; Close can be used instead.
AO = SMA(HL2, fastLen) − SMA(HL2, slowLen) (defaults: 5 & 34).
AC = AO − SMA(AO, signalLen) (default: 5).
Coloring: Green if AC > AC , else Red.
Zero line (optional) helps contextualize acceleration around neutral.
How to read it (typical interpretation)
Above 0: Upside acceleration (bullish pressure increasing).
Below 0: Downside acceleration (bearish pressure increasing).
Color sequences: Consecutive green columns suggest increasing upside acceleration; consecutive red columns suggest increasing downside acceleration.
Note: AC reflects change in momentum, not trend direction by itself. Many traders confirm with trend filters or price structure before acting.
Inputs
AO Fast SMA (default 5)
AO Slow SMA (default 34)
AC Signal SMA (default 5) — smoothing for the AO used in AC calc
Use Median Price (HL2) for AO (on/off)
Show zero line (on/off)
Show AO (for reference) (on/off)
Show AC signal (SMA of AO) (on/off)
Plots
AC Histogram — column chart colored by acceleration (green/red).
Zero — optional baseline at 0.
AO — optional reference line.
AO Signal (SMA) — optional smoothing line of AO.
Alerts
AC crosses above 0 — acceleration flips positive.
AC crosses below 0 — acceleration flips negative.
AC green above zero — AC rising and > 0.
AC red below zero — AC falling and < 0.
Usage tips
On lower timeframes, consider a slightly larger signalLen to reduce noise.
Confirm with price action, trend filters, or volatility context.
Values update intrabar; for stricter signals, confirm on bar close.
Limitations
AC is built from moving averages and is therefore lagging relative to raw price.
It is not normalized; behavior can vary by instrument and timeframe.
Do not use in isolation for entries/exits without risk management.
Credits
Concept by Bill Williams. This script is an independent implementation for educational and research purposes.
Disclaimer
No financial advice. Markets involve risk; test thoroughly before live use.
Wick SweepThe Wick Sweep indicator identifies potential trend reversal zones based on price action patterns and swing points. Specifically, it looks for "Wick Sweeps," a concept where the market temporarily breaks a swing low or high (creating a "wick"), only to reverse in the opposite direction. This pattern is often indicative of a market attempting to trap traders before making a larger move. The indicator marks these zones using dashed lines, helping traders spot key areas of potential price action.
Key Features:
* Swing Low and High Detection: The indicator identifies significant swing lows and highs within a user-defined period by employing Williams fractals.
* Wick Sweep Detection: Once a swing low or high is identified, the indicator looks for price movements that break through the low or high (creating a wick) and then reverses direction.
* Fractal Plotting: Optionally, the indicator plots fractal points (triangle shapes) on the chart when a swing low or high is detected. This can assist in visually identifying the potential wick sweep areas.
* Line Plotting: When a wick sweep is detected, a dashed line is drawn at the price level of the failed low or high, visually marking the potential reversal zone.
Inputs:
* Periods: The number of bars used to identify swing highs and lows. A higher value results in fewer, more significant swing points.
* Line Color: The color of the dashed lines drawn when a wick sweep is detected. Customize this to match your chart's theme or preferences.
* Show Fractals: A toggle that, when enabled, plots triangle shapes above and below bars indicating swing highs (up triangles) and swing lows (down triangles).
Functionality:
* Swing High and Low Calculation:
- The indicator calculates the swing low and swing high based on the periods input. A swing low is identified when the current low is the lowest within a range of (2 * periods + 1), with the lowest point being at the center of the period.
- Similarly, a swing high is identified when the current high is the highest within the same range.
* Wick Sweep Detection:
- Once a swing low or high is detected, the script looks for a potential wick. This happens when the price breaks the swing low or high and then reverses in the opposite direction.
- For a valid wick sweep, the price should briefly move beyond the identified swing point but then close in the opposite direction (i.e., a bullish reversal for a swing low and a bearish reversal for a swing high).
- A line is drawn at the price level of the failed low or high when a wick sweep is confirmed.
Confirmations for Reversal:
* The confirmation for a wick sweep requires that the price not only break the swing low/high but also close in the opposite direction (i.e., close above the low for a bullish reversal or close below the high for a bearish reversal).
* The confirmation is further refined by checking that the price movement is within a reasonable distance from the original swing point, which prevents the indicator from marking distant, unimportant price levels.
Additional Notes:
* The Wick Sweep indicator does not provide standalone trading signals; it is best used in conjunction with other technical analysis tools, such as trend analysis, oscillators, or volume indicators.
* The periods input can be adjusted based on the trader’s preferred level of sensitivity. A lower period value will result in more frequent swing points and potentially more signals, while a higher value will focus on more significant market swings.
* The indicator may work well in ranging markets where price tends to oscillate between key support and resistance levels.

Trend Trader-Remastered StrategyOfficial Strategy for Trend Trader - Remastered
Indicator: Trend Trader-Remastered (TTR)
Overview:
The Trend Trader-Remastered is a refined and highly sophisticated implementation of the Parabolic SAR designed to create strategic buy and sell entry signals, alongside precision take profit and re-entry signals based on marked Bill Williams (BW) fractals. Built with a deep emphasis on clarity and accuracy, this indicator ensures that only relevant and meaningful signals are generated, eliminating any unnecessary entries or exits.
Please check the indicator details and updates via the link above.
Important Disclosure:
My primary objective is to provide realistic strategies and a code base for the TradingView Community. Therefore, the default settings of the strategy version of the indicator have been set to reflect realistic world trading scenarios and best practices.
Key Features:
Strategy execution date&time range.
Take Profit Reduction Rate: The percentage of progressive reduction on active position size for take profit signals.
Example:
TP Reduce: 10%
Entry Position Size: 100
TP1: 100 - 10 = 90
TP2: 90 - 9 = 81
Re-Entry When Rate: The percentage of position size on initial entry of the signal to determine re-entry.
Example:
RE When: 50%
Entry Position Size: 100
Re-Entry Condition: Active Position Size < 50
Re-Entry Fill Rate: The percentage of position size on initial entry of the signal to be completed.
Example:
RE Fill: 75%
Entry Position Size: 100
Active Position Size: 50
Re-Entry Order Size: 25
Final Active Position Size:75
Important: Even RE When condition is met, the active position size required to drop below RE Fill rate to trigger re-entry order.
Key Points:
'Process Orders on Close' is enabled as Take Profit and Re-Entry signals must be executed on candle close.
'Calculate on Every Tick' is enabled as entry signals are required to be executed within candle time.
'Initial Capital' has been set to 10,000 USD.
'Default Quantity Type' has been set to 'Percent of Equity'.
'Default Quantity' has been set to 10% as the best practice of investing 10% of the assets.
'Currency' has been set to USD.
'Commission Type' has been set to 'Commission Percent'
'Commission Value' has been set to 0.05% to reflect the most realistic results with a common taker fee value.
