RSI with Bullish/ Bearish Zones by VKKDisclaimer: Script is not suggesting any buy or sell any stock. It's a visual identification of the direction of the current state of the stock.
This script is a modified Relative Strength Index (RSI) designed to help traders filter out market noise by identifying three distinct momentum phases. Instead of the traditional 70/30 approach, this version uses the 40 and 60 levels to define a "Neutral/Caution" zone.
Key Features:
🟢 Bullish Zone (Above 60): Indicates strong upward momentum. The RSI line turns green, signaling a potential trend continuation.
🟠 Caution Zone (40–60): A neutral "no-man's land" where the market is often consolidating or undecided. The line turns orange, warning traders to be patient.
🔴 Bearish Zone (Below 40): Indicates strong downward momentum. The RSI line turns red, signaling a potential downtrend.
⚖️ Midline (50): A blue or your color choice dotted line acts as the ultimate pivot point between buyers and sellers.
🔥 Extremes (70/30): Classic Overbought (Red) and Oversold (Green) levels are included for mean-reversion context.
How to Use:
Trend Confirmation: Look for the RSI to sustain a position above 60 for longs or below 40 for shorts.
Filter Noise: Avoid entering aggressive trend trades when the RSI is stuck in the Orange Caution Zone.
Real-time Status: The dynamic label on the right provides an instant reading of the current market state and exact RSI value.
Cerca negli script per "zone"

The Institutional Anchor (Daily OC Zone)The Institutional Anchor (Daily OC)
This indicator is a high-performance tool for traders who rely on "Institutional Candles" or "Opening Candles" (OC) to define their daily bias. Built on the latest Pine Script® v6 engine, it provides a stable, non-repainting foundation for identifying key institutional support and resistance levels.
Core Features & Technical Edge
1. Dual-Mode Zone Definition
Traders have different ways of defining institutional strength. This script supports both methods to suit your specific strategy:
Body-Only Mode: Focuses on the "Real Move" by using the Open and Close of the anchor candle.
Full Range Mode (Wicks): Accounts for total liquidity grabs and volatility by including the High and Low.
2. Precision Equilibrium (Mean Threshold)
In institutional trading, the 50% level of a candle is the "Fair Value" or Mean Threshold.
Includes a customizable Midline with independent styling (Solid, Dashed, Dotted).
Automatically calculates the exact mathematical center, helping you spot high-probability rejections at the "Equilibrium" of the move.
3. Professional Visualization Suite
Global Timezone Alignment: A built-in UTC Offset ensures you can align with New York (UTC-5), London (UTC+0), or your specific exchange time without manual calculations.
Auto-Naming System: Automatically labels zones with the Day of the Week (e.g., "Monday OC") to help you track weekly cycles and "Power of 3" (Accumulation/Manipulation/Distribution).
Historical Memory: Choose to show only the current day's active zone for a clean workspace, or display historical zones to find "nested" levels from previous days.
4. Dynamic Price Action Alerts
Stay notified without being glued to the screen. The script includes pre-configured, logically consistent alert conditions:
Equilibrium Touch: Triggers the moment price interacts with the 50% Mean Threshold.
Boundary Breach: Notifies you when price exits or taps the upper or lower edges of the zone.
5. Universal Market Compatibility
BTC & Crypto Optimized: Handles 24/7 data streams flawlessly without logic gaps.
Forex Precision: Perfect for London Open or Midnight Open strategies on pairs like EUR/USD.
Non-Repainting: Once the anchor hour closes, the zone is locked, providing a reliable reference point for the rest of the trading day.
How to Use
Market Open Hour: Enter the hour (24h format) of your chosen anchor candle (e.g., 2 for 2:00 AM).
UTC Offset: Match the offset to your preferred trading session time.
Customize Style: Adjust colors, transparency, and line styles to match your chart theme.

Friday Statistical Zones - Last 30 Fridays Only BTC 📊 Friday Statistical Zones (Pre / Dump / After)
This indicator highlights statistical risk zones for Fridays, based on the last 30 completed Fridays.
It analyzes historical price and volume behavior to determine:
• When a Pre-Dump phase typically starts
• When selling pressure statistically peaks
• When the After-Dump phase usually occurs
The result is a time-based overlay with three zones:
🟡 Pre-Dump · 🔴 Dump · 🟡 After-Dump
⚠️ This is not a signal indicator.
It does not predict price direction.
It provides risk-timing context only.
Best used for risk management and situational awareness on Fridays, not as a standalone trading strategy.

Etwas31 Precision zones and trendTitle: Etwas31 Precision zones and trend
Overview: Get a complete market overview at a single glance. This script combines a comprehensive trend/volatility dashboard with automated, high-precision supply and demand zones. It filters out noise and highlights key market structures to improve your trading accuracy.
Key Features:
1. 📊 Advanced MTF Dashboard (5m - 1W)
Trend Monitor: Uses EMA 20 & 50 alignment to accurately detect Bullish, Bearish, or Neutral (Choppy) markets. No more guessing the trend.
Volatility Scanner: Utilizing ATR logic, it signals whether the market is active (High ⚡) or dormant (Low 💤) for each timeframe.
2. 🎯 Precision Support & Resistance Zones
Real Structure: Unlike simple lines, zones are drawn based on candle wicks (High to Body / Low to Body) to reflect the actual "thickness" of market interest.
Visual Hierarchy:
Weak Zones (15m, 30m): Displayed as Hollow/Dashed boxes. Ideal for scalping or short-term targets.
Strong Zones (1H, 4H, 1D, 1W): Displayed as Solid/Filled boxes. These are key levels for reversals and major trend continuation.
Auto-Extension: Zones automatically extend to the current price action for easy tracking.
3. ⚙️ Customizable & Clean
Fully customizable colors and visibility settings.
Optimized to prevent chart clutter while providing maximum information.
How to Use:
Use the Dashboard to align your trades with the higher timeframe trend (e.g., trade with the 4H trend).
Wait for Volatility (⚡) to confirm momentum.
Enter trades when price reacts at Solid Zones (Strong S/R) or use Hollow Zones for intraday scalp targets.

Supply & Demand ZonesThis indicator detects high-probability supply and demand zones using a multi-step smart money concept approach:
Liquidity Sweep Detection: Identifies when price sweeps above a pivot high (supply setup) or below a pivot low (demand setup), capturing liquidity grabs by institutional traders.
Displacement Confirmation: Requires a strong displacement candle (measured by ATR and body percentage) or fair value gap (FVG/imbalance) in the opposite direction after the sweep.
Volume Confirmation: Optional filter ensures zones form only when volume exceeds the user-defined threshold, indicating institutional participation.
Smart Filtering: Built-in logic prevents overlapping zones, enforces minimum spacing between signals, and requires confirmation bars to eliminate false signals.
Zone Lifecycle Management: Zones are automatically removed when price closes through them with momentum. Breached zones can optionally "flip" to the opposite type when re-tested with strong displacement.
✨ Key Features
Clean Visual Display: Small "D" (Demand) and "S" (Supply) labels with shaded zone boxes
Non-Repainting: All signals use confirmed historical data—no lookahead or repainting
Volume Filter: Optional confirmation using volume spike detection
Zone Flip Logic: Breached demand zones can become supply (and vice versa) when violated
Overlap Prevention: Smart algorithm prevents clustered or duplicate zones
Confirmation Delay: Configurable wait period after sweep to confirm genuine setups
Customizable Inputs: Adjust pivot sensitivity, displacement thresholds, volume filters, and more
Alert Ready: Built-in alert conditions for new supply and demand zone formations
🎯 How to Add to Your Chart
Favorite the Indicator: Click the star icon to add this script to your favorites
Open Your Chart: Navigate to the asset and timeframe you want to trade (works best on 5m-1H intraday charts)
Add Indicator: Click "Indicators" at the top, search for "Supply & Demand Zones (Smart Filtered)", and add to chart
Customize Settings: Click the gear icon ⚙️ to adjust inputs based on your trading style and instrument volatility
Set Alerts: Right-click the indicator name → "Add alert" → Select "Supply Zone" or "Demand Zone" conditions
📖 How to Use
Demand Zones (Green "D" Labels):
Price swept below a swing low (liquidity grab)
Strong bullish displacement or imbalance followed
Trading Action: Look for LONG entries when price returns to the zone or on immediate continuation
Stop Loss: Place just below the zone or sweep low
Target: Next resistance level, supply zone, or risk-reward ratio target
Supply Zones (Red "S" Labels):
Price swept above a swing high (liquidity grab)
Strong bearish displacement or imbalance followed
Trading Action: Look for SHORT entries when price returns to the zone or on immediate continuation
Stop Loss: Place just above the zone or sweep high
Target: Next support level, demand zone, or risk-reward ratio target
Flipped Zones (Orange Labels):
Previous demand/supply zone was broken with strong momentum
Zone has flipped polarity and may now act as the opposite type
Trading Action: Exercise caution—wait for additional confirmation before trading flipped zones
🔍 What to Look For
High-Quality Setups:
Zone forms with above-average volume (check volume filter is enabled)
Clear liquidity sweep visible on the chart
Strong displacement candle with large body percentage
Zone aligns with overall market trend or key structure levels
Multiple timeframe confirmation (check higher timeframe for context)
Avoid These Setups:
Zones forming in choppy, low-volume conditions
Multiple overlapping zones in the same area (indicator filters these automatically)
Zones that appear immediately after news events (set confirmation bars higher)
Counter-trend zones without additional confluence
⚙️ Recommended Settings by Timeframe
5-Minute Charts (Scalping):
Pivot Lookback: 3/3
Min Displacement ATR: 0.9
Confirmation Bars: 1
Min Zone Spacing: 3-5 bars
Volume Threshold: 1.2x
15-Minute Charts (Intraday):
Pivot Lookback: 4/4 (default)
Min Displacement ATR: 1.0 (default)
Confirmation Bars: 2 (default)
Min Zone Spacing: 5-8 bars
Volume Threshold: 1.2x
1-Hour Charts (Swing Trading):
Pivot Lookback: 5/5
Min Displacement ATR: 1.2-1.5
Confirmation Bars: 3
Min Zone Spacing: 8-12 bars
Volume Threshold: 1.3x
💡 Trading Tips & Best Practices
Combine with Price Action: Use this indicator alongside candlestick patterns, support/resistance, and trendlines for confirmation
Multiple Timeframe Analysis: Check higher timeframes for overall bias and major zones
Volume is Key: Enable volume filter to focus on institutional-backed moves
Risk Management: Always use stop losses and proper position sizing
Backtesting: Test settings on your preferred instruments and timeframes before live trading
Context Matters: Consider market conditions, news events, and session times
Wait for Confirmation: Don't rush entries—wait for price reaction at the zone
⚠️ Important Disclaimers
Educational Purpose Only: This indicator is provided for educational and informational purposes. It does not constitute financial advice, investment recommendations, or trading signals.
No Guarantees: Past performance and backtested results do not guarantee future results. Trading involves substantial risk of loss.

Market Extreme Zones IndexThe Market Extreme Zones Index is a new mean reversion (valuation) tool focused on catching long term oversold/overbought zones. Combining an enhanced RSI with a smoothed Z-score this indicator allows traders to find oppurtunities during highly oversold/overbought zones.
I will separate the explanation into the following parts:
1. How does it work?
2. Methodologies & Concepts
3. Use cases
How does it work?
The indicator attempts to catch highly unprobable events in either direction to capture reversal points over the long term. This is done by calculating the Z-Score of an enhanced RSI.
First we need to calculate the Enhanced RSI:
For this we need to calculate 2 additional lengths:
Length1 = user defined length
Length2 = Length1/2
Length3 = √Length
Now we need to calculate 3 different RSIs:
1st RSI => uses classic user defined source and classic user defined length.
2nd RSI => uses classic user defined source and Length 2.
3rd RSI => uses RSI 2 as source and Length 2
Now calculate the divergence:
RSI_base => 2nd RSI * 3 - 1st RSI - 3rd RSI
After this we need to calculate the median of the RSI_base over √Length and make a divergence of these 2:
RSI => RSI_base*2 - median
All that remains now is the Z-score calculations:
We need:
Average RSI value
Standard Deviation = a measure of how dispersed or spread out a set of data values are from their average
Z-score = (Current Value - Average Value) / Standard Deviation
After this we just smooth the Z-score with a Weighted Moving average with √Length
Methodology & Concepts
Mean Reversion Methodology:
The methodology behind mean reversion is the theory that asset prices will eventually return to their long-term average after deviating significantly, driven by the belief that extreme moves are temporary.
Z-Score Methodology:
A Z-score, or standard score, is a statistical measure that indicates how many standard deviations a data point is from the mean of a dataset. A positive z-score means the value is above the mean, a negative score means it's below, and a score of zero means the value is equal to the mean.
You might already be able to see where I am going with this:
Z-Score could be used for the extreme moves to capture reversal points.
By applying it to the RSI rather than the Price, we get a more accurate measurement that allow us to get a banger indicator.
Use Cases
Capturing reversal points
Trend Direction
- while the main use it for mean reversion, the values can indicate whether we are in an uptrend or a downtrend.
Advantages:
Visualization:
The indicator has many plots to ensure users can easily see what the indicator signals, such as highlighting extreme conditions with background colors.
Versatility:
This indicator works across multiple assets, including the S&P500 and more, so it is not only for crypto.
Final note:
No indicator alone is perfect.
Backtests are not indicative of future performance.
Hope you enjoy Gs!
Good luck!

Wick Pressure Zones [BigBeluga]
The Wick Pressure Zones indicator highlights areas where extreme wick activity occurred, signaling strong buy or sell pressure. By measuring unusually long upper or lower wicks and mapping them into gradient volume zones , the tool helps traders identify levels where liquidity was absorbed, leaving behind footprints of supply and demand imbalances. These zones often act as support, resistance, or liquidity sweep magnets .
🔵 CONCEPTS
Extreme Wicks : Large upper or lower shadows indicate aggressive rejection — upper wicks suggest selling pressure, lower wicks suggest buying pressure.
Volumatic Gradient Zones : From each detected wick, the indicator projects a layered gradient zone, proportional to the wick’s size, showing where most pressure occurred.
Liquidity Footprints : These zones mark levels where significant buy/sell volume was executed, often becoming reaction points on future retests.
Automatic Expiration : Zones persist until price decisively trades through them, after which they are cleared to keep the chart clean.
🔵 FEATURES
Automatic Wick Detection : Identifies extreme upper and lower wick events using percentile filtering and Realative Strength Index.
Gradient Zone Visualization : Builds a 10-layer zone from the wick top/bottom, shading intensity according to pressure strength.
Volume Labels : Each zone is annotated with the bar’s volume at the origin point for added context.
Dynamic Zone Extension : Zones extend to the right as long as they remain relevant; once price closes through them, they are removed.
Support & Resistance Mapping : Upper wick zones (red) behave like supply/resistance, lower wick zones (green) like demand/support.
Clutter Control : Limits the number of active zones (default 10) to keep charts responsive.
Background Highlighting : Optional background shading when new wick zones appear (red for sell, green for buy).
🔵 HOW TO USE
Look for Upper Wick Zones (red) : Indicate strong selling pressure; watch for resistance, reversals, or liquidity sweeps above.
Look for Lower Wick Zones (green) : Indicate strong buying pressure; watch for support or liquidity sweeps below.
Trade Retests : When price returns to a zone, expect a reaction (bounce or rejection) due to leftover liquidity.
Combine with Context : Align wick pressure zones with HTF support/resistance, order blocks, or volume profile for stronger signals.
Use Volume Labels : High-volume wicks indicate more significant liquidity events, making the zone more likely to act as a strong reaction point.
🔵 CONCLUSION
The Wick Pressure Zones is a powerful way to visualize hidden liquidity and aggressive rejections. By mapping extreme wick events into dynamic, volume-annotated zones, it shows traders where the market absorbed heavy buy/sell pressure. These levels frequently act as magnets or turning points, making them valuable for timing entries, stop placement, or fade strategies.

SMC - Institutional Confidence Oscillator [PhenLabs]📊 Institutional Confidence Oscillator
Version: PineScript™v6
📌 Description
The Institutional Confidence Oscillator (ICO) revolutionizes market analysis by automatically detecting and evaluating institutional activity at key support and resistance levels using our own in-house detection system. This sophisticated indicator combines volume analysis, volatility measurements, and mathematical confidence algorithms to provide real-time readings of institutional sentiment and zone strength.
Using our advanced thin liquidity detection, the ICO identifies high-volume, narrow-range bars that signal institutional zone formation, then tracks how these zones perform under market pressure. The result is a dual-wave confidence oscillator that shows traders when institutions are actively defending price levels versus when they’re abandoning positions.
The indicator transforms complex institutional behavior patterns into clear, actionable confidence percentiles, helping traders align with smart money movements and avoid common retail trading pitfalls.
🚀 Points of Innovation
Automated thin liquidity zone detection using volume threshold multipliers and zone size filtering
Dual-sided confidence tracking for both support and resistance levels simultaneously
Sigmoid function processing for enhanced mathematical accuracy in confidence calculations
Real-time institutional defense pattern analysis through complete test cycles
Advanced visual smoothing options with multiple algorithmic methods (EMA, SMA, WMA, ALMA)
Integrated momentum indicators and gradient visualization for enhanced signal clarity
🔧 Core Components
Volume Threshold System: Analyzes volume ratios against baseline averages to identify institutional activity spikes
Zone Detection Algorithm: Automatically identifies thin liquidity zones based on customizable volume and size parameters
Confidence Lifecycle Engine: Tracks institutional defense patterns through complete observation windows
Mathematical Processing Core: Uses sigmoid functions to convert raw market data into normalized confidence percentiles
Visual Enhancement Suite: Provides multiple smoothing methods and customizable display options for optimal chart interpretation
🔥 Key Features
Auto-Detection Technology: Automatically scans for institutional zones without manual intervention, saving analysis time
Dual Confidence Tracking: Simultaneously monitors both support and resistance institutional activity for comprehensive market view
Smart Zone Validation: Evaluates zone strength through volume analysis, adverse excursion measurement, and defense success rates
Customizable Parameters: Extensive input options for volume thresholds, observation windows, and visual preferences
Real-Time Updates: Continuously processes market data to provide current institutional confidence readings
Enhanced Visualization: Features gradient fills, momentum indicators, and information panels for clear signal interpretation
🎨 Visualization
Dual Oscillator Lines: Support confidence (cyan) and resistance confidence (red) plotted as percentage values 0-100%
Gradient Fill Areas: Color-coded regions showing confidence dominance and strength levels
Reference Grid Lines: Horizontal markers at 25%, 50%, and 75% levels for easy interpretation
Information Panel: Real-time display of current confidence percentiles with color-coded dominance indicators
Momentum Indicators: Rate of change visualization for confidence trends
Background Highlights: Extreme confidence level alerts when readings exceed 80%
📖 Usage Guidelines
Auto-Detection Settings
Use Auto-Detection
Default: true
Description: Enables automatic thin liquidity zone identification based on volume and size criteria
Volume Threshold Multiplier
Default: 6.0, Range: 1.0+
Description: Controls sensitivity of volume spike detection for zone identification, higher values require more significant volume increases
Volume MA Length
Default: 15, Range: 1+
Description: Period for volume moving average baseline calculation, affects volume spike sensitivity
Max Zone Height %
Default: 0.5%, Range: 0.05%+
Description: Filters out wide price bars, keeping only thin liquidity zones as percentage of current price
Confidence Logic Settings
Test Observation Window
Default: 20 bars, Range: 2+
Description: Number of bars to monitor zone tests for confidence calculation, longer windows provide more stable readings
Clean Break Threshold
Default: 1.5 ATR, Range: 0.1+
Description: ATR multiple required for zone invalidation, higher values make zones more persistent
Visual Settings
Smoothing Method
Default: EMA, Options: SMA/EMA/WMA/ALMA
Description: Algorithm for signal smoothing, EMA responds faster while SMA provides more stability
Smoothing Length
Default: 5, Range: 1-50
Description: Period for smoothing calculation, higher values create smoother lines with more lag
✅ Best Use Cases
Trending market analysis where institutional zones provide reliable support/resistance levels
Breakout confirmation by validating zone strength before position entry
Divergence analysis when confidence shifts between support and resistance levels
Risk management through identification of high-confidence institutional backing
Market structure analysis for understanding institutional sentiment changes
⚠️ Limitations
Performs best in liquid markets with clear institutional participation
May produce false signals during low-volume or holiday trading periods
Requires sufficient price history for accurate confidence calculations
Confidence readings can fluctuate rapidly during high-impact news events
Manual fallback zones may not reflect actual institutional activity
💡 What Makes This Unique
Automated Detection: First Pine Script indicator to automatically identify thin liquidity zones using sophisticated volume analysis
Dual-Sided Analysis: Simultaneously tracks institutional confidence for both support and resistance levels
Mathematical Precision: Uses sigmoid functions for enhanced accuracy in confidence percentage calculations
Real-Time Processing: Continuously evaluates institutional defense patterns as market conditions change
Visual Innovation: Advanced smoothing options and gradient visualization for superior chart clarity
🔬 How It Works
1. Zone Identification Process:
Scans for high-volume bars that exceed the volume threshold multiplier
Filters bars by maximum zone height percentage to identify thin liquidity conditions
Stores qualified zones with proximity threshold filtering for relevance
2. Confidence Calculation Process:
Monitors price interaction with identified zones during observation windows
Measures volume ratios and adverse excursions during zone tests
Applies sigmoid function processing to normalize raw data into confidence percentiles
3. Real-Time Analysis Process:
Continuously updates confidence readings as new market data becomes available
Tracks institutional defense success rates and zone validation patterns
Provides visual and numerical feedback through the oscillator display
💡 Note:
The ICO works best when combined with traditional technical analysis and proper risk management. Higher confidence readings indicate stronger institutional backing but should be confirmed with price action and volume analysis. Consider using multiple timeframes for comprehensive market structure understanding.

S&R Zones MTF (TechnoBlooms)S&R Zones MTF – Multi-Timeframe Support & Resistance Boxes
🔍 Overview
S&R Zones MTF is a professional-grade yet beginner-friendly indicator that dynamically plots Support & Resistance zones across multiple timeframes, helping traders recognize high-probability reversal areas, entry confirmations, and price reaction points.
This tool visualizes structured zones as colored boxes, allowing both new and experienced traders to analyze multi-timeframe confluence with ease and clarity.
🧠 What Is This Indicator?
S&R Zones MTF automatically detects the most significant support and resistance levels from up to four custom timeframes, using a configurable lookback period. These zones are displayed as colored horizontal boxes directly on the chart, making it easy to:
Spot where price has historically reacted
Identify potential reversal or breakout zones
Confirm entries with institutional-style precision
🛠️ Key Features
✅ Multi-Timeframe Zone Detection (up to 4 timeframes)
📦 Auto Plotted Boxes for Support (Blue) & Resistance (Pink)
🧱 Dynamic Height based on average price range or fixed input
🏷️ Timeframe Labels to instantly identify zone origin
🎛️ Customizable inputs: Lookback length, box color, height style
🔁 Real-time updates as price structure changes
🎓 Educational & Easy to Use
Whether you’re a new trader learning about price structure, or a professional applying institutional concepts, this tool offers an educational layout to understand:
How price respects historic zones
Why multi-timeframe zones offer stronger confluence
How to use zones for entry, exit, or risk placement
📈 How to Use (Multi-Timeframe Strategy)
Select Your Timeframes – Customize up to 4 higher timeframes (e.g., 1m, 5m, 15m, 1h).
Observe Overlapping Zones – When multiple timeframes agree, those zones are more significant.
Entry Confirmation – Wait for price to reach a zone, then look for reversal patterns (engulfing candle, pin bar, etc.)
Combine with Other Tools – Use alongside indicators like RSI, MACD, or Order Blocks for added confidence.
💡 Pro Tips
Zones from higher timeframes (1H, 4H) are often more powerful and reliable.
Confluence matters: If a 15m support zone aligns with a 1H support zone — that's a high-probability reaction area.
Use break-and-retest strategies with zone rejections for sniper entries.
Enable "Auto Height" for a more adaptive, volatility-based zone display.
🌟 Summary
S&R Zones MTF blends precision, clarity, and professional analysis into a visual structure that’s easy to understand. Whether you're learning support & resistance or optimizing your MTF edge — this tool will bring clarity to your charts and confidence to your trades.

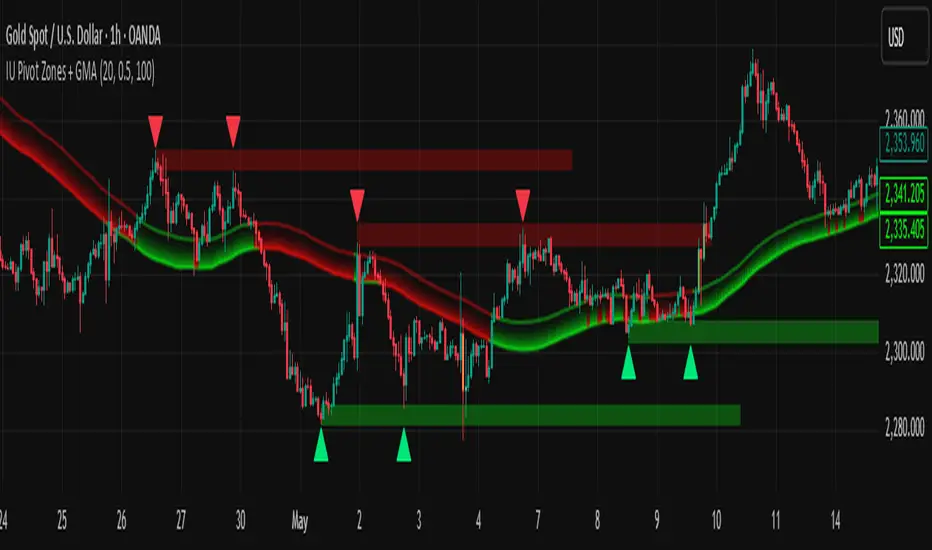
IU Pivot Zones + GMADESCRIPTION:
IU Pivot Zones + GMA is a smart price-action-based indicator that detects meaningful support and resistance zones formed through pivot highs/lows while combining them with dynamic zone generation and Geometric Moving Averages (GMA). This tool is built to help traders visualize institutional breakout/rejection zones with clear, logical mapping and live box management — helping you stay ahead of the move.
The indicator is designed for intraday, swing, and positional traders who want to enhance their trading decisions with visual confluence zones and market structure logic.
USER INPUTS
* Pivot point Lengths: Number of bars used to detect pivot highs/lows
* Zone length: Controls the thickness of the support/resistance zone; higher values create wider zones
* GMA Length: Period for calculating the geometric moving averages based on highs and lows
* Allow Bar/candle Color: Enables or disables special candle coloring when price interacts with the zones
LOGIC OF THE INDICATOR:
* Detects pivot highs and pivot lows using the user-defined length
* Compares consecutive pivot levels to determine if they fall within a valid ATR-based price band to form a zone
* If confirmed, the indicator dynamically plots a resistance or support box between those pivot points, colored respectively (red for resistance, green for support)
* The boxes update in real-time based on price action. If price respects the zone, the box extends forward. If price breaks the zone, the box disappears
* Geometric Moving Averages (GMA) based on logarithmic mean of highs and lows are plotted to offer a trend bias
* Candles that touch the top of the support zone are colored yellow, and those touching the bottom of the resistance zone are orange, enhancing zone reaction visibility
WHY IT IS UNIQUE:
* Uses logarithmic-based GMAs, which are smoother and less reactive than traditional moving averages
* ATR-based zone logic makes it adaptive to volatility instead of using fixed-width zones
* Combines structural levels (pivots), volatility filters (ATR), and trend overlays (GMA) in one unified tool
* Real-time zone extension and disappearance logic based on price interaction
HOW USER CAN BENEFIT FROM IT:
* Spot high-probability breakout or reversal zones that price respects consistently
* Use the GMA cloud for trend confirmation — for example, bullish bias when price is above both GMAs
* Build price action strategies around zone touches, breakouts, or rejections
* Use color-coded candles as real-time alerts for potential entry/exit signals near S/R levels
* Save time by avoiding manual marking of zones on charts across timeframes
DISCLAIMER:
This indicator is created for educational and informational purposes only. It does not constitute financial advice or a recommendation to buy or sell any asset. All trading involves risk, and users should conduct their own analysis or consult with a qualified financial advisor before making any trading decisions. The creator is not responsible for any losses incurred through the use of this tool. Use at your own discretion.
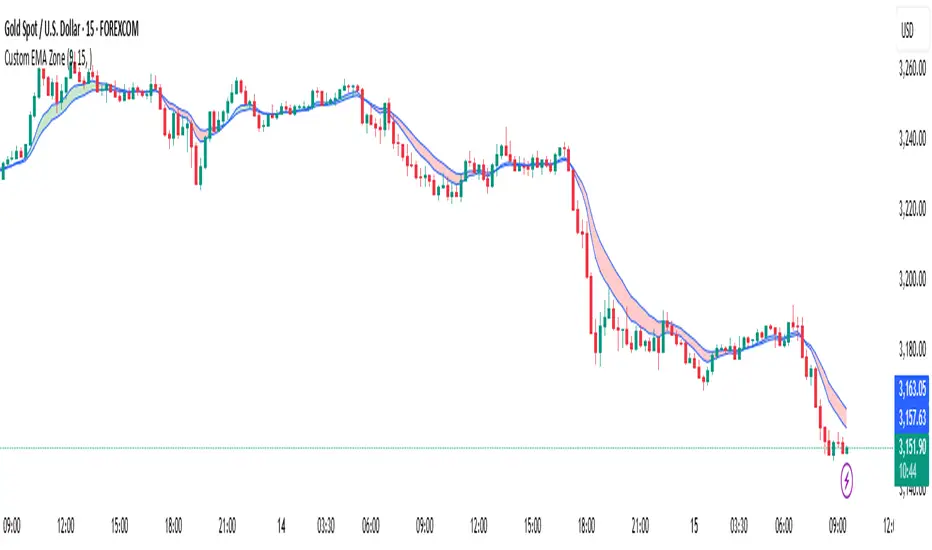
Custom EMA Zone1. Overview
The Custom EMA Cloud Indicator is a technical analysis tool designed to visually display a dynamic zone (or cloud) between two user-defined EMAs. It supports different EMA lengths and allows users to calculate these EMAs using custom timeframes. This flexibility makes it a powerful tool for identifying trends, key price zones, and potential trade signals.
2. Components of the Indicator
2.1. Exponential Moving Averages (EMAs)
EMA 1 (Faster EMA): Calculated using a shorter period (e.g., 21).
EMA 2 (Slower EMA): Calculated using a longer period (e.g., 50).
Users can customize the periods for both EMAs.
2.2. Timeframe Customization
Each EMA can be calculated using a higher timeframe than the chart’s timeframe (e.g., calculate EMA 50 on a 1-hour chart while viewing on a 5-minute chart).
This feature allows users to incorporate higher timeframe trend context into lower timeframe charts.
2.3. Cloud Zone
The cloud is the shaded area between EMA 1 and EMA 2.
Color Logic:
Light Green: Price opens and closes above both EMAs (bullish momentum).
Light Red: Price opens and closes below both EMAs (bearish momentum).
3. How to Use the Indicator
3.1. Trend Identification
When the entire price action is above the cloud, it signals a probable uptrend.
When the entire price action is below the cloud, it indicates a probable downtrend.
When the price is inside the cloud, it reflects probable market consolidation or indecision.
4. Use Cases in Trading Styles
4.1. Scalping
Use short EMAs (e.g., EMA 5 and EMA 13) on 1-minute or 3-minute charts.
Ideal for quick entries and exits during strong momentum moves.
4.2. Swing Trading
Use longer EMAs (e.g., EMA 21 and EMA 50) on 4-hour or daily charts.
Helps capture trend continuation over multiple days.
4.3. Trend Following
Combine with RSI or MACD to confirm trend strength before entering trades.
Stay in the trade as long as price respects the cloud direction.
5. Advantages
Visual Clarity: Simplifies decision-making with clearly defined zones.
Multi-Timeframe Insight: Offers a higher timeframe trend reference.
Customizable: Fits various strategies through adjustable EMAs and timeframes.
6. Limitations
Lagging Nature: As with all moving averages, there may be lag during fast reversals.
False Signals in Sideways Markets: May produce whipsaws during consolidation
ADX with Shaded ZoneThe ADX with Shaded Zone indicator is a momentum-based tool that visualizes trend strength using the Average Directional Index (ADX) along with the +DI and -DI lines. This indicator enhances the traditional ADX setup by adding a shaded zone between ADX levels 20 and 25, helping traders easily identify the transition area between non-trending and trending market conditions.
It plots:
+DI (Green): Positive Directional Indicator
−DI (Red): Negative Directional Indicator
ADX (Blue): Measures the strength of the trend
Shaded Zone: Highlights the indecisive range where ADX is below 25 (gray background between levels 20 and 25)
⚙️ How to Use:
✅ Trend Identification:
ADX < 20: Weak or no trend. Avoid trend-following strategies.
ADX 20–25 (Shaded Zone): Transition zone. Potential trend forming — stay cautious.
ADX > 25: Stronger trend. Favor trend-following strategies.
✅ Direction Confirmation:
If +DI > -DI and ADX > 25 → Uptrend confirmation.
If -DI > +DI and ADX > 25 → Downtrend confirmation.
Crossovers between +DI and -DI can be used as early signals.
✅ Shaded Zone Use:
The gray shaded area helps visually filter out low-trend strength conditions.
Useful for trend traders to wait before entering until ADX breaks above 25.

Zigzag Fibonacci Golden Zone [UAlgo]🔶 Description:
The "Zigzag Fibonacci Golden Zone" aims to identify potential trend pullback points by utilizing a combination of zigzag patterns and Fibonacci "Golden Zone (0.618 - 0.786)" retracement levels. It plots zigzag lines on the price chart, highlighting significant swing highs and swing lows, and overlays Fibonacci retracement levels to indicate potential support and resistance zones. Additionally, it provides options to display buy and sell signals based on specific criteria.
🔶 Key Features:
Zigzag Lines: The indicator plots zigzag lines on the price chart, marking significant swing highs and swing lows. These lines help traders visualize the direction and magnitude of price swings.
Fibonacci Retracement Levels: The indicator overlays Fibonacci retracement levels on the chart, indicating potential support and resistance levels. These levels are derived from the Fibonacci sequence and are commonly used by traders to identify reversal points.
Fibonacci occurs again when a new zigzag low or high is created :
Before new zigzag low pivot appears,
After new Zigzag low pivot appears,
As you see new fibonacci created after new pivot found also price bounced from retracement zone.
Customization Options: Traders can customize various parameters of the indicator, such as the length of the zigzag pattern, color preferences for different elements, and visibility of price labels and buy/sell signals.
Buy/Sell Signals: The indicator generates buy and sell signals based on predefined criteria, such as price movements relative to Fibonacci levels and other market conditions. These signals can help traders identify potential entry and exit points in the market.
Example :
Disclaimer :
Please note that trading involves significant risk, and past performance is not indicative of future results. The "Zigzag Fibonacci Golden Zone" indicator is provided for informational purposes only and should not be considered financial advice. Traders should conduct their own research and analysis before making any investment decisions. Additionally, the indicator's performance may vary depending on market conditions and other factors. Users are encouraged to use the indicator as part of a comprehensive trading strategy and to exercise caution when trading in the financial markets.

Z-Score Based Momentum Zones with Advanced Volatility ChannelsThe indicator "Z-Score Based Momentum Zones with Advanced Volatility Channels" combines various technical analysis components, including volatility, price changes, and volume correction, to calculate Z-Scores and determine momentum zones and provide a visual representation of price movements and volatility based on multi timeframe highest high and lowest low values.
Note: THIS IS A IMPROVEMNT OF "Multi Time Frame Composite Bands" INDICATOR OF MINE WITH MORE EMPHASIS ON MOMENTUM ZONES CALULATED BASED ON Z-SCORES
Input Options
look_back_length: This input specifies the look-back period for calculating intraday volatility. correction It is set to a default value of 5.
lookback_period: This input sets the look-back period for calculating relative price change. The default value is 5.
zscore_period: This input determines the look-back period for calculating the Z-Score. The default value is 500.
avgZscore_length: This input defines the length of the momentum block used in calculations, with a default value of 14.
include_vc: This is a boolean input that, if set to true, enables volume correction in the calculations. By default, it is set to false.
1. Volatility Bands (Composite High and Low):
Composite High and Low: These are calculated by combining different moving averages of the high prices (high) and low prices (low). Specifically:
a_high and a_low are calculated as the average of the highest (ta.highest) and lowest (ta.lowest) high and low prices over various look-back periods (5, 8, 13, 21, 34) to capture short and long-term trends.
b_high and b_low are calculated as the simple moving average (SMA) of the high and low prices over different look-back periods (5, 8, 13) to smooth out the trends.
high_c and low_c are obtained by averaging a_high with b_high and a_low with b_low respectively.
IDV Correction Calulation : In this script the Intraday Volatility (IDV) is calculated as the simple moving average (SMA) of the daily high-low price range divided by the closing price. This measures how much the price fluctuates in a given period.
Composite High and Low with Volatility: The final c_high and c_low values are obtained by adjusting high_c and low_c with the calculated intraday volatility (IDV). These values are used to create the "Composite High" and "Composite Low" plots.
Composite High and Low with Volatility Correction: The final c_high and c_low values are obtained by adjusting high_c and low_c with the calculated intraday volatility (IDV). These values are used to create the "Composite High" and "Composite Low" plots.
2. Momentum Blocks Based on Z-Score:
Relative Price Change (RPC):
The Relative Price Change (rpdev) is calculated as the difference between the current high-low-close average (hlc3) and the previous simple moving average (psma_hlc3) of the same quantity. This measures the change in price over time.
Additionally, std_hlc3 is calculated as the standard deviation of the hlc3 values over a specified look-back period. The standard deviation quantifies the dispersion or volatility in the price data.
The rpdev is then divided by the std_hlc3 to normalize the price change by the volatility. This normalization ensures that the price change is expressed in terms of standard deviations, which is a common practice in quantitative analysis.
Essentially, the rpdev represents how many standard deviations the current price is away from the previous moving average.
Volume Correction (VC): If the include_vc input is set to true, volume correction is applied by dividing the trading volume by the previous simple moving average of the volume (psma_volume). This accounts for changes in trading activity.
Volume Corrected Relative Price Change (VCRPD): The vcrpd is calculated by multiplying the rpdev by the volume correction factor (vc). This incorporates both price changes and volume data.
Z-Scores: The Z-scores are calculated by taking the difference between the vcrpd and the mean (mean_vcrpd) and then dividing it by the standard deviation (stddev_vcrpd). Z-scores measure how many standard deviations a value is away from the mean. They help identify whether a value is unusually high or low compared to its historical distribution.
Momentum Blocks: The "Momentum Blocks" are essentially derived from the Z-scores (avgZScore). The script assigns different colors to the "Fill Area" based on predefined Z-score ranges. These colored areas represent different momentum zones:
Positive Z-scores indicate bullish momentum, and different shades of green are used to fill the area.
Negative Z-scores indicate bearish momentum, and different shades of red are used.
Z-scores near zero (between -0.25 and 0.25) suggest neutrality, and a yellow color is used.

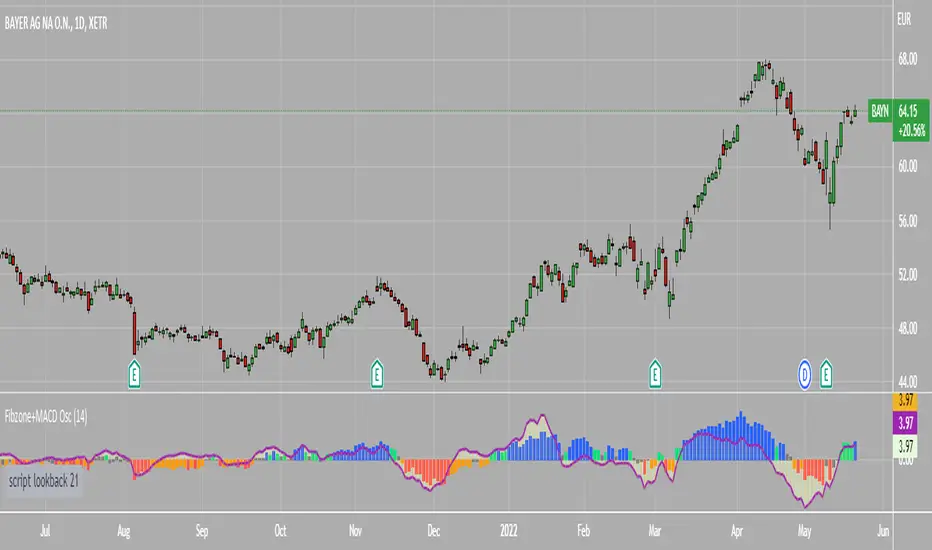
Fibonacci Zone Oscillator With MACD HistogramThe columns
After I found a way to calculate a price as a percent of the middle line of the KeltCOG Channel in the KCGmut indicator (published), I got the idea to use the same trick in the Fbonacci Zone Channel (also published), thus creating an oscillator.
I plot the percent’s as columns with the color of the KeltCOG Channel. Because the channels I created and published (i.e. Fibonacci Zone, Donchian Fibonacci Trading Tool, Keltner Fibzones, and KeltCOG) all use Fibonacci zones, this indicator also reports the position of the close in their zones.
Strategy and Use:
Blue column: Close in uptrend area, 4 supports, 0 resistance, ready to rally up.
Green column: Close in buyers area, 3 supports, 1 resistance, looking up.
Gray column: Close in center area 2 supports, 2 resistances, undecided.
Yellow column: Close in sellers area 1 support, 3 resistances, looking down.
Red column: Close in downtrend area, 0 support, 4 resistances, ready to rally down.
I use this indicator in a layout with three timeframes which I use for stock picking, I pick all stocks with a blue column in every timeframe, the indicator is so clear that I can flip through the 50 charts of my universe of high liquid European blue chips in 15 minutes to make a list of these stocks.
Because I use it in conjunction with KeltCOG I also gave it a ‘script sets lookback’ option which can be checked with a feedback label and switched off in the inputs.
The MACD histogram
I admire the MACD because it is spot on when predicting tops and bottoms. It is also the most sexy indictor in TA. Actually just the histogram is needed, so I don’t show the macd-line and the signal line. I use the same lookback for the slow-ma as for the columns, set the fast-ma to half and the signal-line to a third of the general lookback. Therefore I gave the lookback a minimum value of 6, so the signal gets at least a lookback of 2.
The histogram is plotted three times, first as a whitish area to provide a background, then the colums of the Fibzone Oscillator are plotted, then the histogram as a purple line, which contrasts nicely and then as a hardly visible brown histogram.
The input settings give the option to show columns and histogram separate or together.
Strategy and use:
I think about the columns as showing a ‘longer term chosen momentum’ and about the histogram as a ‘short term power momentum’. I use it as additional information.
Enjoy, Eykpunter.
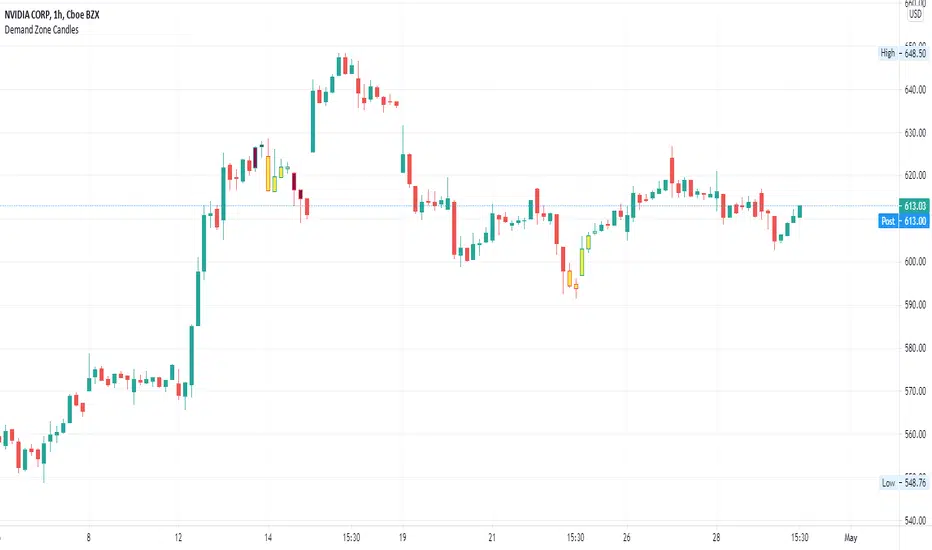
Supply/Demand Zone CandlesThis is a Pine Script to do a basic scan for demand zones and supply zones based on a Leg-Base-Leg-Base pattern.
Yellow candles define a Demand Zone.
Maroon candles define a Supply Zone.
Wick Stop ZonesCount how many wicks bottom out in each price zone. Specify the following inputs.
Lookback: How far back from the latest candle to look for wick intersects.
Zone Size: The price range size for zone. Wicks tips that fall into each zone will be counted.
Minimum Intersects: Specifies how many wick tips must intersect with the zone before the zone is allowed to plot.

Standard deviation zones Support & Resistance [LM]Hi Guy,
I would like to introduce you Standard deviation zones Support & Resistance horizontals. It draws line horizontals on high and low st dev zone. The colors are dynamic depending whether price is below or above the line.
Credit is due to @Zeiierman for st dev zone calculation so shout out to him.
There are various sections in setting:
general setting where you can select source for zone calculation
tops setting
bottom setting
show and hide section of the first timeframe
show and hide section of the second timeframe
Be aware that when new zone starts and is not finished yet than the top will trail the high of unfinished zone that could be also at the high of current candle and next candle it can change
Any suggestions are welcomed

CDC Action Zone V.2CDC Actionzone V2 is a simple 2MA system with small modification.
There are 4 Action Zones:
Green : Buy
Red : Sell
Blue : Prebuy - use with other indicators (eg. RSI Divergence) to comfirm.
Yellow : Presell - use with other indicators (eg. RSI Divergence) to comfirm.
Buy signalafter presell can be used for pyramiding in an vice-versa.

MTF Institutional Zones with Alerts (Impulse + Mitigation)This script plots multi-timeframe (MTF) Supply and Demand zones derived from impulse candles on higher timeframes.
How zones are created
A new zone is formed when an HTF candle has a body size greater than or equal to ATR(14) * Impulse Multiplier.
If the impulse candle is bullish, the script uses the most recent bearish candle (on that HTF) as the Demand zone source.
If the impulse candle is bearish, the script uses the most recent bullish candle (on that HTF) as the Supply zone source.
Filtering and zone management
Zones are kept only if the distance from the HTF impulse close to the zone source is within ATR(14) * Max Distance.
A maximum number of zones per side is stored for each timeframe. Older zones are deleted automatically.
Zones are extended to the right in real time.
Mitigation rule (50%)
A zone is removed when price mitigates 50% of its range:
Demand is removed when low reaches the midpoint.
Supply is removed when high reaches the midpoint.
Alerts
Formation alerts: triggered when a new HTF zone is created (TF1/TF2/TF3).
Proximity alerts (NEAR/IN): triggered when the candle range is within a configurable distance from a zone or when price is inside/touching it.
How to use
Choose TF1/TF2/TF3 (e.g., 4H / 1H / 15m).
Adjust Impulse Multiplier to detect only strong candles.
Adjust Proximity distance (%) to control when proximity alerts trigger.
Notes
This indicator highlights potential reaction areas. It does not guarantee reversals and should be used with proper risk management.

Fibonacci Entry Zone [OTE] (@ath.snipr)🇬🇧 English Description
📌 Fibonacci Entry Zone – @ath.snipr
Fibonacci Entry Zone is an indicator designed to automatically detect market structure, identify Change of Character (CHoCH), and project Optimal Trade Entry (OTE) zones using Fibonacci retracements.
It is suitable for scalping, day trading, and swing trading across all markets (Forex, indices, crypto, commodities).
🎯 Indicator Purpose
This indicator helps traders to:
✔ Detect significant swing highs and lows
✔ Identify structure shifts (CHoCH)
✔ Automatically draw Fibonacci retracement levels
✔ Highlight the Golden Zone (OTE)
✔ Dynamically track new swings in real-time
The goal is to patiently wait for price to retrace into a high-probability value area instead of chasing price.
🧠 How It Works
1️⃣ Market Structure Detection
The algorithm detects price pivots to identify:
📈 Bullish structure: Higher High / Higher Low
📉 Bearish structure: Lower High / Lower Low
When a structure shift occurs, a CHoCH label appears and a new Fibonacci projection is automatically created.
2️⃣ Fibonacci OTE Levels
Fibonacci levels are calculated between the latest swing high and swing low.
Default levels:
0.50
0.618
These represent the Optimal Trade Entry (OTE) zone where price statistically reacts more often.
The Golden Zone can be filled for better visualization.
3️⃣ Dynamic Updates
When Swing Tracker is enabled:
Fibonacci levels automatically update as new swings form.
The projection always stays aligned with the current market structure.
4️⃣ Visual Elements
The indicator displays:
✔ CHoCH labels
✔ Break of Structure lines
✔ Swing trend line (dotted)
✔ Swing price labels
✔ Extended Fibonacci levels
Everything is fully customizable.
🛠️ Key Settings
Structure
Structure Period – Swing sensitivity (higher = stronger structure).
Bullish / Bearish – Enable bullish or bearish structures.
BoS Width – Structure line thickness.
Fibonacci Mode
Swing Tracker – Auto-update Fibonacci levels.
Swing Line – Show swing connection line.
Swing Labels – Show swing price labels.
Fibonacci
Extend – Extend levels to current price.
Previous – Keep previous levels.
Fill Golden Zone – Highlight OTE zone.
Levels – Customize Fibonacci levels.
📈 How to Trade with It (example)
▶ Bullish Scenario
A bullish CHoCH appears.
Price impulsively moves up.
Wait for a retracement into the Golden Zone (0.5 – 0.618).
Confirm with your strategy (price action, liquidity, SMT, etc.).
Enter long with stop below the last swing low.
▶ Bearish Scenario
Same logic in reverse.
⚠️ Disclaimer
This indicator is a decision-support tool only.
It does not guarantee profits and must be used with proper risk management and personal confirmation.

Key Price Levels + Zones"Support and resistance are rarely exact lines; hey are zones where price reacts."
This indicator upgrades standard horizontal levels by visualizing Liquidity Zones around the most critical intraday reference points: Pre-Market, Previous Day, and Previous Week Highs/Lows.
Unlike basic scripts that just draw thin lines, this tool combines the precision of exact price levels with the reality of market volatility. It offers deep customization, allowing you to separate line colors from zone colors, perfect for keeping your charts clean and professional.
Key Features
1. Dual Zone Logic (Dynamic Sizing)
• Price Tier Mode (Default): Zones are sized based on the asset price (e.g., higher-priced stocks get wider zones automatically). This mimics "psychological" levels.
• ATR Volatility Mode: Switches calculation to use the Average True Range (ATR). Zones expand during high volatility and contract during chop, adapting to the market conditions in real-time.
2. Ultimate Customization
• Separate Colors: You can finally set your Line Color (e.g., Bright Green) independently from your Zone Fill (e.g., Faint Grey).
• Individual Toggles: Turn the Line, Zone, or Label on/off individually for every single level.
• Line Styles: Differentiate daily levels (Solid) from weekly levels (Dashed) instantly.
3. The "Smart" Levels
• PM High/Low: Real-time Pre-Market tracking that freezes at the open.
• PD High/Low: Previous Day’s range.
• PW High/Low: Previous Week’s range (Critical for swing points).
---
Settings Guide
• Extension Style:
- Individual: Keeps history of levels for backtesting.
- Most Recent: Keeps the chart minimal by extending only today's levels.
• Zone Thickness Mode: Switch between "Price Tier" and "ATR Volatility".
• ATR Settings: Fully adjustable Length and Multiplier (when in ATR mode).
• Transparency: Global slider to control how subtle or bold the zones appear.
How to Trade This
• The "Trap": If price breaks a Line but fails to close outside the Zone, it is often a liquidity grab (fakeout).
• The Retest: Watch for price to break a level and use the Zone as a cushion for a bounce/retest entry.

Diagonal Interest Zones ScannerThis indicator automatically scans and plots diagonal (slanted) interest zones – dynamic trend-parallel channels that identify statistically validated support/resistance levels within a trending price structure. It detects the strongest "bounce" zones where price has repeatedly respected slanted lines without breaking for a specified hold period, ideal for trending markets.
How It Works (Technical Methodology)
Trend Channel Detection
The script calculates a linear trend slope from a user-defined anchor point (start of lookback or fixed date) to the current close.
Range is determined by finding the maximum deviation above/below this trend line over the lookback period.
This creates a "channel envelope" capturing the full price oscillation around the trend.
Data can be sourced from current or higher timeframe for structural alignment.
Stable Update Mechanism
To prevent flickering on live bars:
Full recalculation (scanning + slope) occurs only after user-defined "Update Frequency" bars close (default 50).
All calculated values (slope, channel bottom, levels, scores) are "snapshotted" and frozen until next confirmed update.
Drawing uses these stable snapshots, ensuring zones remain fixed during real-time price movement.
Auto Mode Scanning
When enabled:
Scans the channel height in percentage steps (default 1.0%).
Each candidate creates a thin diagonal zone (thickness % of price, default 0.04%) parallel to the trend.
Counts valid "hits": Price touches zone and holds (no break) for user-defined bars (default 10).
Break source: "Close" (strict) or "Wick" (sensitive).
Direction assumed by close relative to zone center (support/resistance).
Level Selection and Filtering
Ranks by hit count, applies minimum distance (% of channel height) to avoid overlap.
Limits to max zones (default 9), sorted low to high.
Manual mode alternative: Directly uses input percentages (e.g., 0, 50, 100 for channel bottom/mid/top).
Diagonal Zone Construction
Zones are drawn as filled diagonal bands using two parallel lines (top/bottom) with linefill.
Thickness is volatility-adjusted (% of current price).
Optional extension far into future or limited projection.
Colors: Supply (above price, default light gray), Demand (below price, default cyan) – updates live but positions stay stable.
Dashboard and Visuals
Table shows current price at each zone (stable during bar), % level, hit count (green if high).
Update countdown displayed for transparency.
How to Use
Perfect for trending markets – identifies dynamic, parallel support/resistance zones that move with price structure.
High hit counts: Strong diagonal zones – expect bounces or acceleration on retest.
Update Frequency: Higher values (100+) for very stable long-term channels; lower for adaptive intraday.
Validation Bars: Increase for stricter zones (fewer false positives).
Multi-Timeframe: Use higher TF input for major trend channels on lower charts.
Supply Zones (Diagonal above price): Dynamic resistance – potential shorts or profit targets.
Demand Zones (Diagonal below price): Dynamic support – potential longs or trailing stops.
Manual Mode: Quick plotting of fixed % (e.g., channel median, quartiles).
Confluence: Combine with horizontal levels, volume, or order flow for entries.
Zones remain visually stable (no repainting during bar) thanks to snapshot logic – reliable for live trading decisions.
Disclaimer
This indicator is a technical analysis tool and should be used in conjunction with other forms of analysis. Past performance does not guarantee future results. Always use proper risk management.
