CryptoverseThis Indicator dynamically generates and charts Pivot Points, Support and Resistance Lines, Trend Channels and even Rsi Divergences in every market and every time period.
While it helps you identify your entry points, stop loss and take positions, it certainly does not include trading signals and trading strategy.
Bonus: the indicator contains ema21, ema50, ema100 and ema200 to support the lines created. If you wish, you can change the EMA values in the settings.
Recommendation: RSI is included in the indicator codes in order to detect divergences dataally, but it is not displayed on the chart. I recommend adding an additional RSI indicator to keep track of past and current potential divergences.
USER MANUAL:
----------------------------------------------
General Settings:
Pivot Period: This field determines how many candles before and after a candle should be controlled in order to be able to determine the top and bottom points on the chart.
Support and Resistance Lines and Trend Channels formed on the chart are created by calculating the Pivot points formed according to the period determined here. (Default value: 6)
Pivot Source: Determines the pivot points to be created according to the value of the relevant candle.
(Default and Recommended: closing)
----------------------------------------------
Support And Resistance Settings:
Custom Bars Back: This area allows you to specify how many pivot points from the current candle to the previous candle to create support resistance lines on the Chart. The default value is the last 500 candles.
*Note: The more old candles are checked, the more support and resistance lines will appear. This may prevent you from making sound determinations on the chart.*
Current Bar Decrease: This field works integrated with Custom Bars Back. By subtracting the current candle by the specified number, it provides the formation of lines without including those candles.
Default value: It is set to 0 to include current data.
Example: If Custom Bars Back: 500 and Current Bar Decrease: 10, Support and Resistance lines are created by considering 500 candles before the last 10 candles without including the last 10 candles on the chart.
Show S/R Lines: This field allows you to show or hide the Support and Resistance lines at any time.
Auto Simplification: This field is marked by default. It allows the Simplification Steps value to be determined automatically within the code according to the time period and current volatility of the relevant parity. (It is recommended to use the default version.)
Simplification Steps: This field allows you to get more understandable lines by simplifying the Support and Resistance lines based on Pivot points. If a simplification is not done, the lines to be formed with only the pivot points will be too many and this creates a dirty and useless appearance on the chart.
Each 1 digit you enter as a step combines the lines that are close to each other at a value of 0.01% and creates a common line.
Example: If you enter the number 10 as Steps, it will form a single common line from lines close together, starting at 0.01% respectively. It will continue to increase by 0.02%, 0.03%, 0.04% in its next steps. For the number 10, it will complete its loop by combining lines within the last remaining lines that are as close as 0.1% to each other and creating new lines from their midpoints.
The deafult value is 14. (Max. simplifies lines with closeness up to 1.4%.)
Important Note: If Auto Simplification is on, the entered value has no meaning. The Indicator performs simplification operations automatically. If you want to manage these steps manually, you can turn off Auto Simplification and enter your own value.
S/R Lines Color: Allows you to specify the color of the lines.
Label Location: Allows you to determine how many candles ahead the information label formed for each line will be positioned.
Line Label Descriptions:
Line: It is the price value that the line coincides with.*
Distance: Shows the percentage distance of the line from the current price.
▲ : Shows the percentage distance from the line above it.
▼ : Shows the percentage distance from the line below it.
Strength: Indicates the total number of steps the process has taken during the simplification process. The height of the number indicates the strength of resistance and support in the close price range.
C. Width: stands for Channel Width. It shows the percentage value between the highest price and the lowest price on the past candle as many candles specified by Custom Bars Back.
S. Steps: stands for Simplification Steps. Indicates the number of simplification steps applied. A value of 150 in the image indicates that a 1.5% simplification range has been applied.
----------------------------------------------
Trend Channels Settings:
Show All Trend Lines: Allows you to show and hide trend channels.
Hide Old Trend Lines: If you enable it, it will hide channels created in the past except for Current Trend channels.
Helper Line Format: Allows the auxiliary line that converts a trendline to a channel to be drawn based on percentage or price.
Note: There may be cases where the auxiliary lines do not provide full parallelism when using large time intervals by preferring a percentage.
Up Trend Color: Indicates the color of the Up Trend channel.
Down Trend Color: Specifies the color of the Downtrend channel.
Show Up Trend Overflow, Show Down Trend Overflow:
When the price closes above or below the trend channels, it provides awareness with the help of a text on the chart. Colors can be adjusted according to preference.
----------------------------------------------
RSI Divergences Settings:
This indicator gives you information about 4 different divergences. You can customize the divergence views with the show and hide options.
Bullish Regular, Bullish Hidden, Bearish Regular and Bearish Hidden.
Green divergences from the bottom of the graph represent bullish, and red divergences above the graph represent bearish.
Important note: Seeing a mismatch label definitely indicates that there is a mismatch between prices and rsi, but a mismatch does not always indicate a change in price.
Potential Divergence:
The indicator not only shows you past divergences, but also informs you of potential divergences based on the current status of the chart.
A potential divergence may not turn into a true one if the price flow continues to increase or decrease in the same direction. But all divergences seen in the past must have been shown as potential divergences beforehand.
Rsi Length, Rsi Source: Allows you to change settings for RSI values typically embedded within the indicator.
Note: Pivot Source and RSI Source using the same type of candle data ensures that divergences are displayed correctly.
----------------------------------------------
EMA Settings:
The indicator allows you to use 4 different EMA data in addition to Support and Resistance lines, Trend Channels and RSI divergences. By default, 21, 50, 100 and 200 are used. You can change the EMA values and colors in the Settings section, or you can use the show hide options in the Style section.
Cerca negli script per "大位科技同行业可替代股票的技术面分析数据(如5日均线、10日均线、支撑位、压力位)"

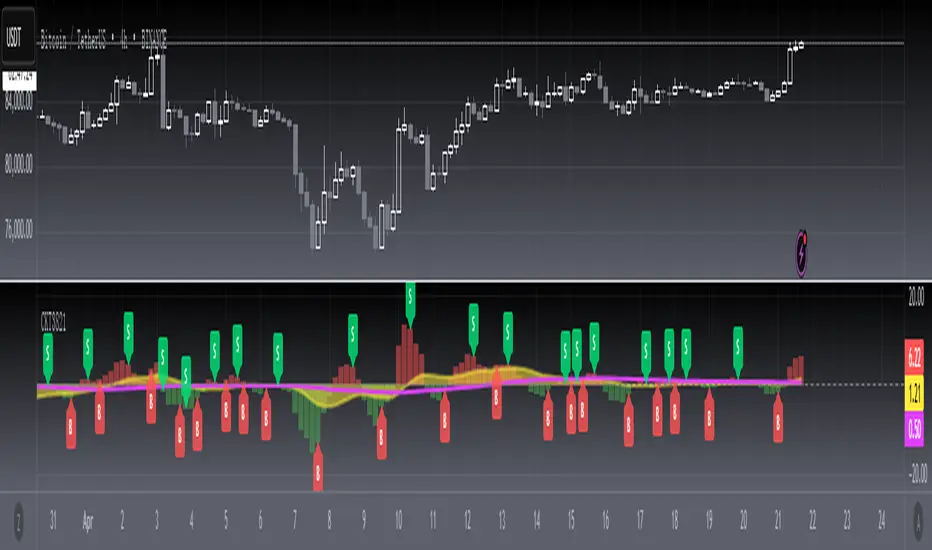
[blackcat] L3 Candle Skew 3821 TraderLevel 3
Background
By modeling skew to produce long and short entry points.
Function
The concept of skew comes from physics and statistics, and is used in market technical analysis to reflect the expectation of future stock price distribution. Because the return distribution of stocks in the trend market has skew (Skew), it is reasonable to judge the trend continuity according to the historical and current skew. It is precisely because the stock price rises that there is a skew. The greater the strength of the rise, the greater the angle of inclination and the greater the skew. The degree of this upward or downward slope in the statistical distribution of stock prices is defined as skew. Through the size of skew, we can know the direction, inertia and extent of the stock's rise or fall, and find stocks with a high probability of quick profit. The technical indicator introduced today is a simplified but effective stock price skew model used to generate buying and selling points.
The principle of this technical indicator is based on the success rate test results of different moving averages corresponding to different skews as follows:
10 trading cycles profit 5% success rate (%)
5 period moving average 10 period moving average 20 period moving average 30 period moving average 60 period moving average
skew>=0 51.36 52.26 52.65 52.55 52.08
skew>=0.5 55.44 58.06 60.56 62.37 65.66
skew>=1 59.72 63.06 67.07 69.78 70.62
skew>=1.5 63.01 67.08 71.61 72.9 70.61
skew>=2 65.53 70.22 74.18 73.76 70.12
skew>=2.5 67.89 72.93 75.32 73.66 68.92
skew>=3 70.07 75.32 75.69 72.54 67.45
skew>=3.5 71.85 77.05 75.32 73.63 63.82
skew>=4 73.6 78.06 74.19 68.96 59.91
skew>=4.5 76.04 78.56 72.85 69.55 49.24
skew>=5 77.44 78.88 71.58 67.28 51.69
skew>=5.5 78.97 78.39 70.33 64.31 49.7
skew>=6 79.68 78.07 68.82 61.65 53.57
Table 1
As can be seen from the above table, with the increase of the 5-period and 10-period moving average skew values, the success rate is increasing, but after the 20- and 30-period moving average skew values increase to an upper bound, it shows a downward trend. When the skew of the 20-period and 30-period moving averages is greater than 0.5, the 10-period profit of 5% is above 60%, and when it is greater than 1.5, the success rate can reach above 70%. The larger the 5-period moving average skew, the higher the success rate, but often because the short-term skew is too large, the stock price has risen rapidly to a high level, and chasing up is risky, which is not suitable for the investment habits of most people, so prudent investors may like to do swings. Investors may wish to pay more attention to the skew of the 20-period and 30-period moving averages. Based on the above analysis, as a short-term trading enthusiast, I need to choose the 5-period and 10-period moving average skew, and consider the medium-term trend as a compromise, and I also need to consider the 20-period moving average skew. Finally, according to the principle of personal preference, I chose 3 groups of periods based on Fibonacci magic numbers: 3 periods, 8 periods, 21 periods, and skews that take into account both short-term and mid-line trends. So, I named this indicator number 3821 as a distinction.
002084 1D from TradingView
BTCUSDT 1H from TradingView
Tesla 1D from TradingView
GT 5.1 Strategy═════════════════════════════════════════════════════════════════════════
█ OVERVIEW
People often look an indicator in their technical analysis to enter a position. We may also need to look at the signals of one or more indicators to verify the signals given by some indicators. In this context, I developed a strategy to test whether it really works by choosing some of the indicators that capture trend changes with the same characteristics. Also, since the subject is to catch the trend change, I thought it would be right to include an indicator using the heikin ashi logic. By averaging and smoothing the market noise, Heiken Ashi makes it easier to detect the direction of the trend helps to see possible reversal points on the chart. However, it should be noted that Heiken Ashi is a lagging indicator.
I picked 5 different indicators (but their purpose are similar) and combined them to produce buy and sell signals based on your choice(not repaint). First of all let's get some information about our indicators. So you will understand me why i picked these indicators and what is the meaning of their signals.
1 — Coral Trend Indicator by LazyBear
Coral Trend Indicator is a linear combination of moving averages, all obtained by a triple or higher order exponential smoothing. The indicator comes with a trend indication which is based on the normalized slope of the plot. the usage of this indicator is simple. When the color of the line is green that means the market is in uptrend. But when the color is red that means the market is in downtrend.
As you see the original indicator it is simple to find is it in uptrend or downtrend.
So i added a code to find when the color of the line change. When it turns green to red my script giving sell signals, when it turns red to green it gives buy signals.
I hide the candles to show you more clearly what is happening when you choose only Coral Strategy. But sometimes it is not enough only using itself. Even if green dots turn to red it continues in uptrend. So we need a to look another indicator to approve our signal.
2 — SSL channel by ErwinBeckers
Known as the SSL , the Semaphore Signal Level channel is an indicator that combines moving averages to provide you with a clear visual signal of price movement dynamics. In short, it's designed to show you when a price trend is forming. This indicator creates a band by calculating the high and low values according to the determined period. Simply if you decide 10 as period, it calculates a 10-period moving average on the latest 10 highs. Calculate a 10-period moving average on the latest 10 lows. If the price falls below the low band, the downtrend begins, if the price closes above the high band, the uptrend begins. Lets look the original form of indicator and learn how it using.
If the red line is below and the green band is above, it means that we are in uptrend, and if it is on the opposite side, it means that we are in downtrend. Therefore, it would be logical to enter a position where the trend has changed. So i added a code to find when the crossover has occured.
As you see in my strategy, it gives you signals when the trend has changed. But sometimes it is not enough only using this indicator itself. So lets look 2 indicator together in one chart.
Look circle SSL is saying it is in downtrend but Coral is saying it has entered in uptrend. if we just look to coral signal it can misleads us. So it can be better to look another indicator for validating our signals.
3 — Heikin Ashi RSI Oscillator by JayRogers
The Heikin-Ashi technique is used by technical traders to identify a given trend more easily. Heikin-Ashi has a smoother look because it is essentially taking an average of the movement. There is a tendency with Heikin-Ashi for the candles to stay red during a downtrend and green during an uptrend, whereas normal candlesticks alternate color even if the price is moving dominantly in one direction. This indicator actually recalculates the RSI indicator with the logic of heikin ashi. Due to smoothing, the bars are formed with a slight lag, reflecting the trend rather than the exact price movement. So lets look the original version to understand more clearly. If red bars turn to green bars it means uptrend may begin, if green bars turn to red it means downtrend may begin.
As you see HARSI giving lots of signal some of them is really good but some of them are not very well. Because it gives so much signals Now i will change time period and lets look same chart again.
Now results are better because of heikin ashi's logic. it is not suitable for day traders, it gives more accurate result when using the time period is longer. But it can be useful to use this indicator in short time periods using with other indicators. So you may catch the trend changes more accurately.
4 — MACD DEMA by ToFFF
This indicator uses a double EMA and MACD algorithm to analyze the direction of the trend. Though it might seem a tough task to manage the trades with the help of MACD DEMA once you know how the proper way to interpret the signal lines, it will be an easy task.
This indicator also smoothens the signal lines with the time series algorithm which eventually makes the higher time frame important. So, expecting better results in the lower time frame can result in big losses as the data reading from the MACD DEMA will not be accurate. In order to understand the function of this indicator, you have to know the functions of the EMA also.
The exponential moving average tends to give more priority to the recent price changes. So, expecting better results when the volatility is very high is a very risky approach to trade the market. Moreover, the MACD has some lagging issues compared to the EMA, so it is super important to use a trading method that focuses on the higher time frame only. What does MACD 12 26 Close 9 mean? When the DEMA-9 crosses above the MACD(12,26), this is considered a bearish signal. It means the trend in the stock – its magnitude and/or momentum – is starting to shift course. When the MACD(12,26) crosses above the DEMA-9, this is considered a bullish signal. Lets see this indicator on Chart.
When the blue line crossover red line it is good time to buy. As you see from the chart i put arrows where the crossover are appeared.
When the red line crossover blue line it is good time to sell or exit from position.
5 — WaveTrend Oscillator by LazyBear
This is a technical indicator that creates high and low bands between two values. It then creates a trend indicator that draws waves with highs and lows within these boundaries. WaveTrend is a widely used indicator for finding direction of an asset.
Calculation period: number of candles used to calculate WaveTrend, defaults to 10. Averaging period: number of candles used to average WaveTrend, defaults to 21.
As you see in chart when the lines crossover occured my strategy gives buy or sell signals.
═════════════════════════════════════════════════════════════════════════
█ HOW TO USE
I hope you understand how the indicators I mentioned above work and what they are used for. Now, I will explain in detail how to use the strategy I have created.
When you enter the settings section, you will see 5 types of indicators. If you want to use the signals of the indicators, simply tick the box next to the indicators. Also, under each option there is an area where you can set the "lookback". This setting is a field that will make the signals overlap when you select more than one option. If you are going to trade with only one option, you should make sure that this field is 0. Otherwise, it may continue to generate as many signals as you choose.
Lets see in chart for easy understanding.
As you see chart, if i chose only HARSI with lookback 0 (HARSI and CORAL should be 1 minumum because of algorithm-we looking 1 bar before, others 0 because we are looking crossovers), it will give signals only when harsı bar's color changed. But when i changed Lookback as 7 it will be like this in chart.
Now i will choose 2 indicator with settings of their lookback 0.
As you see it will give signals when both of them occurs same time. But HARSI is an indicator giving very early signal so we can enter position 5-6 bars after the first bar color change. So i will change HARSI Lookback settings as 7. Lets look what happens when we use lookback option.
So it wil be useful to change lookback settings to find best signals in each time period and in each symbol. But it shouldnt be too high. Because you can be late to catch trend's starting.
this is an image of MACD and WAVE trend used and lookback option are both 6.
Now lets see an example with 3 options are chosen with lookback option 11-1-5
Now lets talk about indicators settings. After strategy options you will see each indicators settings, you can change their settings as you desired. So each indicators signal will be changed according to your adjustment.
I left strategy options with default settings. You can change it manually as if you want.
═════════════════════════════════════════════════════════════════════════
█ LIMITATIONS: Don't rely on non-standard charts results. For example Heikin Ashi is a technical analysis method used with the traditional candlestick chart.Heikin Ashi vs. Candlestick Chart: The decisive visual difference between Heikin Ashi and the traditional chart is that Heikin Ashi flattens the traditional candlestick chart using a modified formula.
The primary advantage of Heikin Ashi is that it makes the chart more reader-friendly and helps users identify and analyze trends .
Because Heikin Ashi provides averaged price information rather than real-time price and reacts slowly to volatility — not suitable for scalpers and high-frequency traders. I added HARSI indicator as a supportive signal because it is useful with using CORAL and SSL channel indicators. If you change your candle types to Heikin Ashi , your profit will change in good way but dont rely on it.
═════════════════════════════════════════════════════════════════════════
█ THANKS:
Special thanks to authors of the scripts that i used.
@LazyBear and @ErwinBeckers and @JayRogers and @ToFFF
═════════════════════════════════════════════════════════════════════════
█ DISCLAIMER
Any trade decisions you make are entirely your own responsibility.

STD/C-Filtered, N-Order Power-of-Cosine FIR Filter [Loxx]STD/C-Filtered, N-Order Power-of-Cosine FIR Filter is a Discrete-Time, FIR Digital Filter that uses Power-of-Cosine Family of FIR filters. This is an N-order algorithm that turns the following indicator from a static max 16 orders to a N orders, but limited to 50 in code. You can change the top end value if you with to higher orders than 50, but the signal is likely too noisy at that level. This indicator also includes a clutter and standard deviation filter.
See the static order version of this indicator here:
STD/C-Filtered, Power-of-Cosine FIR Filter
Amplitudes for STD/C-Filtered, N-Order Power-of-Cosine FIR Filter:
What are FIR Filters?
In discrete-time signal processing, windowing is a preliminary signal shaping technique, usually applied to improve the appearance and usefulness of a subsequent Discrete Fourier Transform. Several window functions can be defined, based on a constant (rectangular window), B-splines, other polynomials, sinusoids, cosine-sums, adjustable, hybrid, and other types. The windowing operation consists of multipying the given sampled signal by the window function. For trading purposes, these FIR filters act as advanced weighted moving averages.
What is Power-of-Sine Digital FIR Filter?
Also called Cos^alpha Window Family. In this family of windows, changing the value of the parameter alpha generates different windows.
f(n) = math.cos(alpha) * (math.pi * n / N) , 0 ≤ |n| ≤ N/2
where alpha takes on integer values and N is a even number
General expanded form:
alpha0 - alpha1 * math.cos(2 * math.pi * n / N)
+ alpha2 * math.cos(4 * math.pi * n / N)
- alpha3 * math.cos(4 * math.pi * n / N)
+ alpha4 * math.cos(6 * math.pi * n / N)
- ...
Special Cases for alpha:
alpha = 0: Rectangular window, this is also just the SMA (not included here)
alpha = 1: MLT sine window (not included here)
alpha = 2: Hann window (raised cosine = cos^2)
alpha = 4: Alternative Blackman (maximized roll-off rate)
This indicator contains a binomial expansion algorithm to handle N orders of a cosine power series. You can read about how this is done here: The Binomial Theorem
What is Pascal's Triangle and how was it used here?
In mathematics, Pascal's triangle is a triangular array of the binomial coefficients that arises in probability theory, combinatorics, and algebra. In much of the Western world, it is named after the French mathematician Blaise Pascal, although other mathematicians studied it centuries before him in India, Persia, China, Germany, and Italy.
The rows of Pascal's triangle are conventionally enumerated starting with row n = 0 at the top (the 0th row). The entries in each row are numbered from the left beginning with k=0 and are usually staggered relative to the numbers in the adjacent rows. The triangle may be constructed in the following manner: In row 0 (the topmost row), there is a unique nonzero entry 1. Each entry of each subsequent row is constructed by adding the number above and to the left with the number above and to the right, treating blank entries as 0. For example, the initial number in the first (or any other) row is 1 (the sum of 0 and 1), whereas the numbers 1 and 3 in the third row are added to produce the number 4 in the fourth row.
Rows of Pascal's Triangle
0 Order: 1
1 Order: 1 1
2 Order: 1 2 1
3 Order: 1 3 3 1
4 Order: 1 4 6 4 1
5 Order: 1 5 10 10 5 1
6 Order: 1 6 15 20 15 6 1
7 Order: 1 7 21 35 35 21 7 1
8 Order: 1 8 28 56 70 56 28 8 1
9 Order: 1 9 36 34 84 126 126 84 36 9 1
10 Order: 1 10 45 120 210 252 210 120 45 10 1
11 Order: 1 11 55 165 330 462 462 330 165 55 11 1
12 Order: 1 12 66 220 495 792 924 792 495 220 66 12 1
13 Order: 1 13 78 286 715 1287 1716 1716 1287 715 286 78 13 1
For a 12th order Power-of-Cosine FIR Filter
1. We take the coefficients from the Left side of the 12th row
1 13 78 286 715 1287 1716 1716 1287 715 286 78 13 1
2. We slice those in half to
1 13 78 286 715 1287 1716
3. We reverse the array
1716 1287 715 286 78 13 1
This is our array of alphas: alpha1, alpha2, ... alphaN
4. We then pull alpha one from the previous order, order 11, the middle value
11 Order: 1 11 55 165 330 462 462 330 165 55 11 1
The middle value is 462, this value becomes our alpha0 in the calculation
5. We apply these alphas to the cosine calculations
example: + alpha4 * math.cos(6 * math.pi * n / N)
6. We then divide by the sum of the alphas to derive our final coefficient weighting kernel
**This is only useful for orders that are EVEN, if you use odd ordering, the following are the coefficient outputs and these aren't useful since they cancel each other out and result in a value of zero. See below for an odd numbered oder and compare with the amplitude of the graphic posted above of the even order amplitude:
What is a Standard Deviation Filter?
If price or output or both don't move more than the (standard deviation) * multiplier then the trend stays the previous bar trend. This will appear on the chart as "stepping" of the moving average line. This works similar to Super Trend or Parabolic SAR but is a more naive technique of filtering.
What is a Clutter Filter?
For our purposes here, this is a filter that compares the slope of the trading filter output to a threshold to determine whether to shift trends. If the slope is up but the slope doesn't exceed the threshold, then the color is gray and this indicates a chop zone. If the slope is down but the slope doesn't exceed the threshold, then the color is gray and this indicates a chop zone. Alternatively if either up or down slope exceeds the threshold then the trend turns green for up and red for down. Fro demonstration purposes, an EMA is used as the moving average. This acts to reduce the noise in the signal.
Included
Bar coloring
Loxx's Expanded Source Types
Signals
Alerts

STD-Stepped, Variety N-Tuple Moving Averages [Loxx]STD-Stepped, Variety N-Tuple Moving Averages is the standard deviation stepped/filtered indicator of the following indicator
Variety N-Tuple Moving Averages is a moving average indicator that allows you to create 1- 30 tuple moving average types; i.e., Double-MA, Triple-MA, Quadruple-MA, Quintuple-MA, ... N-tuple-MA. This version contains 5 different moving average types including T3. A list of tuples can be found here if you'd like to name the order of the moving average by depth: Tuples extrapolated
STD-Stepped, You'll notice that this is a lot of code and could normally be packed into a single loop in order to extract the N-tuple MA, however due to Pine Script limitations and processing paradigm this is not possible ... yet.
If you choose the EMA option and select a depth of 2, this is the classic DEMA ; EMA with a depth of 3 is the classic TEMA , and so on and so forth this is to help you understand how this indicator works. This version of NTMA is restricted to a maximum depth of 30 or less. Normally this indicator would include 50 depths but I've cut this down to 30 to reduce indicator load time. In the future, I'll create an updated NTMA that allows for more depth levels.
This is considered one of the top ten indicators in forex. You can read more about it here: forex-station.com
How this works
Step 1: Run factorial calculation on the depth value,
Step 2: Calculate weights of nested moving averages
factorial(nemadepth) / (factorial(nemadepth - k) * factorial(k); where nemadepth is the depth and k is the weight position
Examples of coefficient outputs:
6 Depth: 6 15 20 15 6
7 Depth: 7 21 35 35 21 7
8 Depth: 8 28 56 70 56 28 8
9 Depth: 9 36 34 84 126 126 84 36 9
10 Depth: 10 45 120 210 252 210 120 45 10
11 Depth: 11 55 165 330 462 462 330 165 55 11
12 Depth: 12 66 220 495 792 924 792 495 220 66 12
13 Depth: 13 78 286 715 1287 1716 1716 1287 715 286 78 13
Step 3: Apply coefficient to each moving average
For QEMA, which is 5 depth EMA , the caculation is as follows
ema1 = ta. ema ( src , length)
ema2 = ta. ema (ema1, length)
ema3 = ta. ema (ema2, length)
ema4 = ta. ema (ema3, length)
ema5 = ta. ema (ema4, length)
qema = 5 * ema1 - 10 * ema2 + 10 * ema3 - 5 * ema4 + ema5
Included:
Alerts
Loxx's Expanded Source Types
Bar coloring
Signals
Standard deviation stepping

Variety N-Tuple Moving Averages [Loxx]Variety N-Tuple Moving Averages is a moving average indicator that allows you to create 1- 30 tuple moving average types; i.e., Double-MA, Triple-MA, Quadruple-MA, Quintuple-MA, ... N-tuple-MA. This version contains 5 different moving average types including T3. A list of tuples can be found here if you'd like to name the order of the moving average by depth: Tuples extrapolated
You'll notice that this is a lot of code and could normally be packed into a single loop in order to extract the N-tuple MA, however due to Pine Script limitations and processing paradigm this is not possible ... yet.
If you choose the EMA option and select a depth of 2, this is the classic DEMA; EMA with a depth of 3 is the classic TEMA, and so on and so forth this is to help you understand how this indicator works. This version of NTMA is restricted to a maximum depth of 30 or less. Normally this indicator would include 50 depths but I've cut this down to 30 to reduce indicator load time. In the future, I'll create an updated NTMA that allows for more depth levels.
This is considered one of the top ten indicators in forex. You can read more about it here: forex-station.com
How this works
Step 1: Run factorial calculation on the depth value,
Step 2: Calculate weights of nested moving averages
factorial(nemadepth) / (factorial(nemadepth - k) * factorial(k); where nemadepth is the depth and k is the weight position
Examples of coefficient outputs:
6 Depth: 6 15 20 15 6
7 Depth: 7 21 35 35 21 7
8 Depth: 8 28 56 70 56 28 8
9 Depth: 9 36 34 84 126 126 84 36 9
10 Depth: 10 45 120 210 252 210 120 45 10
11 Depth: 11 55 165 330 462 462 330 165 55 11
12 Depth: 12 66 220 495 792 924 792 495 220 66 12
13 Depth: 13 78 286 715 1287 1716 1716 1287 715 286 78 13
Step 3: Apply coefficient to each moving average
For QEMA, which is 5 depth EMA, the caculation is as follows
ema1 = ta.ema(src, length)
ema2 = ta.ema(ema1, length)
ema3 = ta.ema(ema2, length)
ema4 = ta.ema(ema3, length)
ema5 = ta.ema(ema4, length)
qema = 5 * ema1 - 10 * ema2 + 10 * ema3 - 5 * ema4 + ema5
Included:
Alerts
Loxx's Expanded Source Types
Bar coloring

Inside Bar SetupScript Details
- This script plots Inside Bar for given day in selected time-frame (applicable only for Timeframes < Day)
- Basis plotted inside bar, relevant targets are marked on the chart
- Targets can be customised from script settings. Example, if range of mother candle is 10 points, then T1 is 10 * x above/below mother candle and T2 is 10 * y above/below mother candle. This x & y are configured via script settings
How to use this script ?
- This script works well on 10-15 mins timeframe for stocks, 15/30 mins timeframe for nifty index and 30/60 mins time frame for bank nifty index
- If mother candle high is broken, take long trade with SL of mother candle low and if low is broken, take short trade with SL of mother candle high
Remember:
1. Above logic is to be combined with support/resistances i.e. price action. This script is an add-on to price action analysis giving you more conviction.
2. If range of mother candle is very high, it is recommended to avoid the trade.
3. Basis inside bar formed on higher time frame, take trade on basis of lower time frame i.e if inside bar is formed on 60 mins, take trade on the basis of 10-15 mins time frame
Example:
1. As seen in the chart, Nifty is near it's resistance and we are seeing Inside Bar being formed, In such scenario, even if High of Mother Candle is broken, we should be more interested to short as we are near resistance and probability of getting our targets in long side is less.
2. So, if I see breakdown of mother candle i.e. price going below low of mother candle, we will short with SL of high of mother candle.
3. As seen in the chart, both the targets are achieved.
Additional Info:
1. Targets on Long/Short Side can be configured via settings. For indices 1 times/1.5 times the range works well.
2. This script plots targets basis the first inside bar formed in the day for selected time frame.
3. Inside bars formed through out the day are coloured separately but lines are plotted only on the basis of 1st formed inside bar as this strategy works well for the first formed inside bar)
4. Don't forget to check volume in case of breakout/breakdown.
Note:
1. Mother Candle - First Candle of Inside Bar
2. Child Candle - Candle formed inside Mother Candle (Second Candle of Inside Bar)
Happy Trading :)

Smoothed Heikin Ashi Trend on Chart - TraderHalai BACKTESTSmoothed Heikin Ashi Trend on chart - Backtest
This is a backtest of the Smoothed Heikin Ashi Trend indicator, which computes the reverse candle close price required to flip a Heikin Ashi trend from red to green and vice versa. The original indicator can be found in the scripts section of my profile.
This particular back test uses this indicator with a Trend following paradigm with a percentage-based stop loss.
Note, that backtesting performance is not always indicative of future performance, but it does provide some basis for further development and walk-forward / live testing.
Testing was performed on Bitcoin , as this is a primary target market for me to use this kind of strategy.
Sample Backtesting results as of 10th June 2022:
Backtesting parameters:
Position size: 10% of equity
Long stop: 1% below entry
Short stop: 1% above entry
Repainting: Off
Smoothing: SMA
Period: 10
8 Hour:
Number of Trades: 1046
Gross Return: 249.27 %
CAGR Return: 14.04 %
Max Drawdown: 7.9 %
Win percentage: 28.01 %
Profit Factor (Expectancy): 2.019
Average Loss: 0.33 %
Average Win: 1.69 %
Average Time for Loss: 1 day
Average Time for Win: 5.33 days
1 Day:
Number of Trades: 429
Gross Return: 458.4 %
CAGR Return: 15.76 %
Max Drawdown: 6.37 %
Profit Factor (Expectancy): 2.804
Average Loss: 0.8 %
Average Win: 7.2 %
Average Time for Loss: 3 days
Average Time for Win: 16 days
5 Day:
Number of Trades: 69
Gross Return: 1614.9 %
CAGR Return: 26.7 %
Max Drawdown: 5.7 %
Profit Factor (Expectancy): 10.451
Average Loss: 3.64 %
Average Win: 81.17 %
Average Time for Loss: 15 days
Average Time for Win: 85 days
Analysis:
The strategy is typical amongst trend following strategies with a less regular win rate, but where profits are more significant than losses. Most of the losses are in sideways, low volatility markets. This strategy performs better on higher timeframes, where it shows a positive expectancy of the strategy.
The average win was positively impacted by Bitcoin’s earlier smaller market cap, as the percentage wins earlier were higher.
Overall the strategy shows potential for further development and may be suitable for walk-forward testing and out of sample analysis to be considered for a demo trading account.
Note in an actual trading setup, you may wish to use this with volatility filters, combined with support resistance zones for a better setup.
As always, this post/indicator/strategy is not financial advice, and please do your due diligence before trading this live.
Original indicator links:
On chart version -
Oscillator version -
Update - 27/06/2022
Unfortunately, It appears that the original script had been taken down due to auto-moderation because of concerns with no slippage / commission. I have since adjusted the backtest, and re-uploaded to include the following to address these concerns, and show that I am genuinely trying to give back to the community and not mislead anyone:
1) Include commission of 0.1% - to match Binance's maker fees prior to moving to a fee-less model.
2) Include slippage of 10 ticks (This is a realistic slippage figure from searching online for most crypto exchanges)
3) Adjust account balance to 10,000 - since most of us are not millionaires.
The rest of the backtesting parameters are comparable to previous results:
Backtesting parameters:
Initial capital: 10000 dollars
Position size: 10% of equity
Long stop: 2% below entry
Short stop: 2% above entry
Repainting: Off
Smoothing: SMA
Period: 10
Slippage: 10 ticks
Commission: 0.1%
This script still remains to shows viability / profitablity on higher term timeframes (with slightly higher drawdown), and I have included the backtest report below to document my findings:
8 Hour:
Number of Trades: 1082
Gross Return: 233.02%
CAGR Return: 14.04 %
Max Drawdown: 7.9 %
Win percentage: 25.6%
Profit Factor (Expectancy): 1.627
Average Loss: 0.46 %
Average Win: 2.18 %
Average Time for Loss: 1.33 day
Average Time for Win: 7.33 days
Once again, please do your own research and due dillegence before trading this live. This post is for education and information purposes only, and should not be taken as financial advice.

Scalping The Bull IndicatorName: Scalping The Bull Indicator
Category: Scalping, Trend Following, Mean Reversion.
Timeframe: 1M, 5M, 30M, 1D depending on the specific technique.
Technical Analysis: The indicator supports the operations of the trader named "Scalping The Bull" which uses price action and exponential moving averages.
Suggested usage: Altcoin showing strong trends for scalping and intra-day trades. Trigger points are used as entry and exit points and to be used to understand when a signal has more power.
It is possible to identify the following conformations:
Shimano: look at the price records of a consecutive series of closings between the EMA 60 and the EMA 223 when a certain threshold is reached. Use the trigger points as price structures to identify entry and exit zones (e.g. breakout of the yesterday high as for entry point) .
Bomb: look at the price registers a percentage variation in a single candle, greater than a threshold such as 2%, in particular on shorter timeframes and around the trigger points.
Viagra: look at there is a consecutive series of closes below the EMA 10.
Downward fake: look when, after a cross under (Death Cross), the price returns above the EMA 223 using the yesterday high as a trigger point.
Emergence: look at the EMA 60 is about to cross over the EMA 223.
Anti-crossing: look at, after an important price rise and a subsequent retracement, the EMA 60 is about to cross under the EMA 223 but a bullish impulse brings the price back above the EMAs.
For Sales: look at two types of situations: 1) when the price falls by more than 10% from the opening price and around the yesterday’s low or 2) when the price falls and then reaches, in the last 5 days, a bigger percentage and then breaks a trigger point.
Colour change: look at the opening price of the session - indicated as a trigger point.
Third touch of EMA 60: look for 3 touches below the EMA 60, and enter when there is a close above the EMA 60.
Third touch of EMA 223: look for 3 touches when there are 3 touches below the EMA 223, and enter when there is a close above the EMA 60.
Bud: look at price when it crosses upwards the average 10 and subsequently at least 2 "rest" candles are between the maximum and minimum of the breaking candle.
Fake on EMA 10: look for the open of a candle higher than the EMA 10, the minimum of the candle lower and the closing price returns above the EMA 10..
For Stop Loss and Profit Targets consider a proper R/R depending on Risk Management, using price structures such as the low of the entering candle and a quick Position Management moving quickly the Stop-Loss at Break-Even.
Configuration:
Market
EMA: The indicator automatically configure itself on market it knows (Binance, Piazza Affari and NASDAQ) otherwise it can be configured manually fo Crypto market (5/10/60/223) or Stock Market (5/10/50/200).
Additional Average: You can display an additional average, e.g. 20-period average.
Chart elements:
Session Separators: indicates the beginning of the current session (in blue)
Background: signals with the background in green an uptrend situation ( 60 > 223) and in red background a downtrend situation (60 < 223).
Trigger points:
Today's highs and lows: draw on the chart the opening price of the daily candle and the highs and lows of the day (high in purple, low in red and open in green)
Yesterday's highs and lows: draw on the chart the opening price of the daily candle, the highs and lows of the previous day (high in yellow, low in red).
Credits
Massimo : for refactoring and suggestions.

Ratings AlgoThe ratings algo is my discount version of the many paid-for algorithms put out by numerous different companies. A technical "rating" (by default between -10 and 10) is produced for each candle, telling the user when to buy, sell, or hold. I took 11 of my personal favorite indicators to develop a rating system. They are:
50/200 SMA crossover
10/20 SMA crossover
10/20 LSMA crossover
10/20 EMA crossover
"Arnold" a rate-of-change analysis of a smoothed LSMA
PVT and OBV momentum
MACD
RSI
DMI
Fisher Transform
The ratings system is very basic (a more complex, detailed version will be coming in the future!) where each indicator returns -1, 0, or 1, and the MAs and Oscillators are stratified with a user-defined weighting. The total calculation is based on the function:
maweight * (average of MA ratings) + oscillator weight * (average of osc ratings)
If the total value > user-defined threshold, the bar is teal, and if > 2.5 * threshold, is green, and vice versa for orange/red respectively. Purple is given if the total value is close to zero.
"Strong" signals are printed if the bar changes to either green or red and exits are printed if the bars change from green/red to any other color.
A table is also produced showing what each indicator is indicating, either "Buy" "Sell" or "Hold.
Reversal Bands are printed, intended to be used as areas where a trade might be exited if the market is sideways. If a Strong Buy signal is produced, it may be a good idea to enter the trade, and hold until the price enters the reversal bands, then hold until a candle closes outside the band for the first time.
This indicator truly shines in trending markets (like most indicators), but with very fast-acting exit signals and reversal zones, will facilitate minimal losses and possibly even profits in sideways markets.

Weighted RiskONessRevision of tedtalksmacro's risk-on metric. Number go up means global markets are more risk-on; number go down means more risk-off. Weights now allow you to adjust the weights of various elements of the indicator. These are exponentials with the weight being the power / 10.
I.e. setting gold's weight to 10 takes it's value ^ (10 / 10). Setting it to 5 would square root it (^5/10 = ^1/2) while 20 would square it (^20/10 = ^2).
A green line means "riskONess" has gone up in the last day, red means down.
Resolution minimum for the indicator is 1D due to TradingView's limitations.

Double SupertrendThis strategy is based on a custom indicator that was created based on the Supertrend indicator. At its core, there are always 2 super trend indicators with different factors to reduce market noise (false signals).
The strategy/indicator has some parameters to improve the signals and filters.
TECHNICAL ANALYSIS
☑ Show Indicators
This option will enable/disable the Supertrend indicators on the chart.
☑ Length
The length will be used on the Supertrend Indicator to calculate its values.
☑ Dev Fast
The fast deviation or factor from one of the super trend indicators. This will be the leading indicator for entry signals, as well as for the exit signals.
☑ Dev Slow
The slow deviation or factor from one of the super trend indicators. This will be the confirmation indicator for entry and exit signals.
☑ Exit Type
It's possible to select from 4 options for the exit signals. Exit signals always take profit target.
☑ ⥹ Reversals
This option will make the strategy/indicator calculate the exit signals based on the difference between the given period's highest and lowest candle value (see Period on this list). It's displayed on the chart with the cross. As it's possible to verify in the image below, there are multiple exit spots for every entry.
☑ ⥹ ATR
Using ATR as a base indicator for exit signals will make the strategy/indicator place limit/stop orders. Candle High + ATR for longs, Candle Low - ATR for shorts. The strategy will show the ATR level for take profit and stick with it until the next signal. This way, the take profit value remains based on the candle of the entry signal.
☑ ⥹ Fast Supertrend
With this option selected, the exit signals will be based on the Fast Supertsignal value, mirrored to make a profit.
☑ ⥹ Slow Supertrend
With this option selected, the exit signals will be based on the Slow Supertsignal value, which is mirrored to take profit.
☑ Period
This will represent the number of candles used on the exit signals when Reversals is selected as Exit Type. It's also used to calculate the gradient used on the Fills and Supertrend signals.
☑ Multiplier
It's used on the take profit when the ATR option is selected on the Exit Type.
STRATEGY
☑ Use The Strategy
This will enable/disable the strategy to show the trades calculations.
☑ Show Use Long/Short Entries
Option to make the strategy show/use Long or Short signals. Available only if Use The Strategy is enabled
☑ Show Use Exit Long/Short
Option to make the strategy show/use Exit Long or Short signals (valid when Reversals option is selected on the Exit Type). Available only if Use The Strategy is enabled
☑ Show Use Add Long/Short
Option to make the strategy show/use Add Long or Short signals. With this option enabled, the strategy will place multiple trades in the same direction, almost the same concept as a pyramiding parameter. It's based on the Fast Supersignal when the candle fails to cross and reverses. Available only if Use The Strategy is enabled
☑ Trades Date Start/End
The date range that the strategy will check the market data and make the trades
HOW TO USE
It's very straightforward. A long signal will appear as a green arrow with a text Long below it. A short signal will appear as a red arrow with a text Short above it. It's ideal to wait for the candle to finish to validate the signal.
The exit signals are optional but give a good idea of the configuration used when backtesting. Each market and timeframe will have its own configuration for the best results. On average, sticking to ATR as an exit signal will have less risk than the other options.
☑ Entry Signals
Follow the arrows with Long/Short texts on them. Wait for the signal candle to close to validate the entry.
☑ Exit Signals
Use them to close your position or to trail stop your orders and maximize profits. Select the exit type suitable for each timeframe and market
☑ Add Entries
It's possible to increase the position following the add margin/contracts based on the Add signals. Not mandatory, but may work as reentries or late entries using the same signal.
☑ What about Stop Loss?
The stop-loss levels were not included as a separated signal because it's already in the chart. There are some possible ideas for the stop loss:
☑⥹ Candle High/Low (2nd recommend option)
When it's a Long signal from the entry signal candle, the stop loss can be the Low value of the same candle. Very tight stop loss in some cases, depending on the candle range
☑⥹ Local Top/Bottom
Selecting the local top/bottom as stop loss will give the strategy more room for false breakouts or reversals, keeping the trade open and minimizing noises. Increases the risk
☑⥹ Fast Supertrend (1st recommend option)
The fast supertrend can be used as stop-loss as well. making it a moving level and working close to trail stop management
☑⥹ Fixed Percentage
It's possible to use a fixed risk percentage for the trades, making the risk easier to control and project. Since the market volatility is not fixed, this may affect the accuracy of the trades
☑⥹ Based on the ATR (3rd recommend option)
When the exit type option ATR is selected, it will display the take profit level for that entry. Just mirror that value and put it as stop-loss, or multiply that amount by 1.5 to have more room for market noise.
EXAMPLE CONFIGURATIONS
Here are some configuration ideas for some markets (all of them are from crypto, especially futures markets)
BTCUSDT 15min - Default configuration
BTCUSDT 1h - Length 10 | Dev Fast 3 | Dev Slow 4 | Exit Type ATR | Period 50 | Multiplier 1
BTCUSDT 4h - Length 10 | Dev Fast 2 | Dev Slow 4 | Exit Type ATR | Period 50 | Multiplier 1
ETHUSDT 15min - Length 20 | Dev Fast 1 | Dev Slow 3 | Exit Type Fast Supertrend | Period 50 | Multiplier 1
IOTAUSDT 15min - Length 10 | Dev Fast 1 | Dev Slow 2 | Exit Type Slow Supertrend | Period 50 | Multiplier 1
OMGUSDT 15min - Length 10 | Dev Fast 1 | Dev Slow 4 | Exit Type Slow Supertrend | Period 50 | Multiplier 1
VETUSDT 15min - Length 10 | Dev Fast 3 | Dev Slow 4 | Exit Type Slow Supertrend | Period 50 | Multiplier 1
HOW TO FIND OTHER CONFIGURATIONS
Here are some steps to find suitable configurations
select a market and time frame
enable the Use This Strategy option on the strategy
open the strategy tester panel and select the performance summary
open the strategy configuration and go to properties
change the balance to the same price of the symbol (example: BTCUSDT 60.000, use 60.000 as balance)
go back to the inputs tab and keep changing the parameters until you see the net profit be positive and bigger than the absolute value of the drawdown
in case you can't find a suitable configuration, try other timeframes
Since the tester reflects what happened in the past candles, it's not guaranteed to give the same results. However, this indicator/Strategy can be used with other indicators as a leading signal or confirmation signal.

MathConstantsLibrary "MathConstants"
Mathematical Constants
E() The number e
Log2E() The number log (e)
Log10E() The number log (e)
Ln2() The number log (2)
Ln10() The number log (10)
LnPi() The number log (pi)
Ln2PiOver2() The number log (2*pi)/2
InvE() The number 1/e
SqrtE() The number sqrt(e)
Sqrt2() The number sqrt(2)
Sqrt3() The number sqrt(3)
Sqrt1Over2() The number sqrt(1/2) = 1/sqrt(2) = sqrt(2)/2
HalfSqrt3() The number sqrt(3)/2
Pi() The number pi
Pi2() The number pi*2
PiOver2() The number pi/2
Pi3Over2() The number pi*3/2
PiOver4() The number pi/4
SqrtPi() The number sqrt(pi)
Sqrt2Pi() The number sqrt(2pi)
SqrtPiOver2() The number sqrt(pi/2)
Sqrt2PiE() The number sqrt(2*pi*e)
LogSqrt2Pi() The number log(sqrt(2*pi))
LogSqrt2PiE() The number log(sqrt(2*pi*e))
LogTwoSqrtEOverPi() The number log(2 * sqrt(e / pi))
InvPi() The number 1/pi
TwoInvPi() The number 2/pi
InvSqrtPi() The number 1/sqrt(pi)
InvSqrt2Pi() The number 1/sqrt(2pi)
TwoInvSqrtPi() The number 2/sqrt(pi)
TwoSqrtEOverPi() The number 2 * sqrt(e / pi)
Degree() The number (pi)/180 - factor to convert from Degree (deg) to Radians (rad).
Grad() The number (pi)/200 - factor to convert from NewGrad (grad) to Radians (rad).
PowerDecibel() The number ln(10)/20 - factor to convert from Power Decibel (dB) to Neper (Np). Use this version when the Decibel represent a power gain but the compared values are not powers (e.g. amplitude, current, voltage).
NeutralDecibel() The number ln(10)/10 - factor to convert from Neutral Decibel (dB) to Neper (Np). Use this version when either both or neither of the Decibel and the compared values represent powers.
Catalan() The Catalan constant
Sum(k=0 -> inf){ (-1)^k/(2*k + 1)2 }
EulerMascheroni() The Euler-Mascheroni constant
lim(n -> inf){ Sum(k=1 -> n) { 1/k - log(n) } }
GoldenRatio() The number (1+sqrt(5))/2, also known as the golden ratio
Glaisher() The Glaisher constant
e^(1/12 - Zeta(-1))
Khinchin() The Khinchin constant
prod(k=1 -> inf){1+1/(k*(k+2))^log(k,2)}

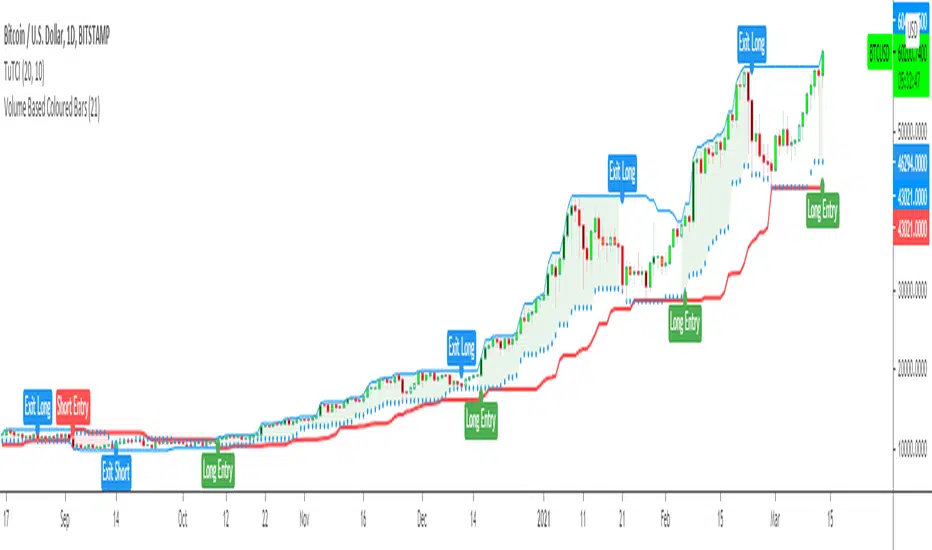
Turtle Trade Channels Indicator TUTCILegendary trade system which proved that great traders can be made, not born.
Turtle Trade Experiment made 80% annual return for 4 years and made 150 million $
Turtle Trade trend following system is a complete opposite to the "buy low and sell high" approach.
This trend following system was taught to a group of average and normal individuals, and almost everyone turned into a profitable trader.
They used the basis logic of well known DONCHIAN CHANNELS which developed by Richard Donchian.
The main rule is "Trade an 20-day breakout and take profits when an 10-day high or low is breached ". Examples:
Buy a 20-day breakout and close the trade when price action reaches a 10-day low.
Go short a 20-day breakout and close the trade when price action reaches a 10-day high.
In this indicator,
The red line is the trading line which indicates the trend directio n:
Price bars over the trend line indicates uptrend
Price bars under the trend line means downtrend
The dotted blue line is the exit line.
Original system is:
Go long when the price High is equal to or above previous 20 day Highest price.
Go short when the price Low is equal to or below previous 20 day Lowest price.
Exit long positions when the price touches the exit line
Exit short positions when the price touches the exit line
Recommended initial stop-loss is ATR * 2 from the opening price.
Default system parameters were 20,10 and 55,20.
Original Turtle Rules:
To trade exactly like the turtles did, you need to set up two indicators representing the main and the failsafe system.
Set up the main indicator with EntryPeriod = 20 and ExitPeriod = 10 (A.k.a S1)
Set up the failsafe indicator with EntryPeriod = 55 and ExitPeriod = 20 using a different color. (A.k.a S2)
The entry strategy using S1 is as follows
Buy 20-day breakouts using S1 only if last signaled trade was a loss.
Sell 20-day breakouts using S1 only if last signaled trade was a loss.
If last signaled trade by S1 was a win, you shouldn't trade -Irregardless of the direction or if you traded last signal it or not-
The entry strategy using S2 is as follows:
Buy 55-day breakouts only if you ignored last S1 signal and the market is rallying without you
Sell 55-day breakouts only if you ignored last S1 signal and the market is pluging without you
You can Highlight the chart with provided trade signals:
Green background color when Long
Red background color when Short
No background color when flat
WARNING: TURTLE TRADE STOP or ADDING more UNITS RULES ARE NOT INCLUDED.
Author: Kıvanç Özbilgiç
Also you can show or hide trade signals with the button on the settings menu
RSI EMA CrossOver RameshThe RSI is one of the most popular technical indicators. The RSI measures the internal strength of the security. The RSI indicator oscillates between oversold and over bought levels, where a trader is advised to look for buying opportunities when the stock is in over sold region and selling opportunities when the stock is in over bought region.
The RSI with EMA strategy signals a trade when EMA of 7 period RSI crosses over the EMA of a 14 period RSI.
Buy: when 10 EMA of 7 period RSI crossing up 10 EMA of a 14 period RSI
Sell: when 10 EMA of 7 period RSI crossing down 10 EMA of a 14 period RSI
EMA = Exponential Moving Average
Crossover = Simple crossover between current RSI values and its 10 day EMA

Multi SMA EMA WMA HMA BB (4x5 MAs Bollinger Bands) Adv MTF - RRBMulti SMA EMA WMA HMA 4x5 Moving Averages with Bollinger Bands Advanced MTF by RagingRocketBull 2019
Version 1.0
This indicator shows multiple MAs of any type SMA EMA WMA HMA etc with BB and MTF support, can show MAs as dynamically moving levels.
There are 4 MA groups + 1 BB group, a total of 4 TFs * 5 MAs = 20 MAs. You can assign any type/timeframe combo to a group, for example:
- EMAs 12,26,50,100,200 x H1, H4, D1, W1 (4 TFs x 5 MAs x 1 type)
- EMAs 8,10,13,21,30,50,55,100,200,400 x M15, H1 (2 TFs x 10 MAs x 1 type)
- D1 EMAs and SMAs 8,10,12,26,30,50,55,100,200,400 (1 TF x 10 MAs x 2 types)
- H1 WMAs 7,77,89,167,231; H4 HMAs 12,26,50,100,200; D1 EMAs 89,144,169,233,377; W1 SMAs 12,26,50,100,200 (4 TFs x 5 MAs x 4 types)
- +1 extra MA type/timeframe for BB
There are several versions: Simple, MTF, Pro MTF, Advanced MTF and Ultimate MTF. This is the Advanced MTF version. The Differences are listed below. All versions have BB
- Simple: you have 2 groups of MAs that can be assigned any type (5+5)
- MTF: +2 custom Timeframes for each group (2x5 MTF) +1 TF for BB, TF XY smoothing
- Pro MTF: 4 custom Timeframes for each group (4x3 MTF), 1 TF for BB, MA levels and show max bars back options
- Advanced MTF: +2 extra MAs/group (4x5 MTF), custom Ticker/Symbols, Timeframe <>= filter, Remove Duplicates Option
- Ultimate MTF: +individual settings for each MA, custom Ticker/Symbols
Features:
- 4x5 = 20 MAs of any type
- 4x MTF groups with XY step line smoothing
- +1 extra TF/type for BB MAs
- 4x5 = 20 MA levels with adjustable group offsets, indents and shift
- supports any existing type of MA: SMA, EMA, WMA, Hull Moving Average (HMA)
- custom tickers/symbols for each group - you can compare MAs of the same symbol across exchanges
- show max bars back option
- show/hide both groups of MAs/levels/BB and individual MAs
- timeframe filter: show only MAs/Levels with TFs <>= Current TF
- hide MAs/Levels with duplicate TFs
- support for custom TFs that are not available in free accounts: 2D, 3D etc
- support for timeframes in H: H, 2H, 4H etc
Notes:
- Uses timeframe textbox instead of input resolution dropdown to allow for 240 120 and other custom TFs
- Uses symbol textbox instead of input symbol to avoid establishing multiple dummy security connections to the current ticker - otherwise empty symbols will prevent script from running
- Possible reasons for missing MAs on a chart:
- there may not be enough bars in history to start plotting it. For example, W1 EMA200 needs at least 200 bars on a weekly chart.
- price << default Y smoothing step 5. For charts with low/fractional prices (i.e. 0.00002 << 5) adjust X Y smoothing as needed (set Y = 0.0000001) or disable it completely (set X,Y to 0,0)
- TradingView Replay Mode UI and Pinescript security calls are limited to TFs >= D (D,2D,W,MN...) for free accounts
- attempting to plot any TF < D1 in Replay Mode will only result in straight lines, but all TFs will work properly in history and real-time modes. This is not a bug.
- Max Bars Back (num_bars) is limited to 5000 for free accounts (10000 for paid), will show error when exceeded. To plot on all available history set to 0 (default)
- Slow load/redraw times. This indicator becomes slower, its UI less responsive when:
- Pinescript Node.js graphics library is too slow and inefficient at plotting bars/objects in a browser window. Code optimization doesn't help much - the graphics engine is the main reason for general slowness.
- the chart has a long history (10000+ bars) in a browser's cache (you have scrolled back a couple of screens in a max zoom mode).
- Reload the page/Load a fresh chart and then apply the indicator or
- Switch to another Timeframe (old TF history will still remain in cache and that TF will be slow)
- in max possible zoom mode around 4500 bars can fit on 1 screen - this also slows down responsiveness. Reset Zoom level
- initial load and redraw times after a param change in UI also depend on TF. For example:
D1/W1 - 2 sec, H1/H4 - 5-6 sec, M30 - 10 sec, M15/M5 - 4 sec, M1 - 5 sec.
M30 usually has the longest history (up to 16000 bars) and W1 - the shortest (1000 bars).
- when indicator uses more MAs (plots) and timeframes it will redraw slower. Seems that up to 5 Timeframes is acceptable, but 6+ Timeframes can become very slow.
- show_last=last_bars plot limit doesn't affect load/redraw times, so it was removed from MA plot
- Max Bars Back (num_bars) default/custom set UI value doesn't seem to affect load/redraw times
- In max zoom mode all dynamic levels disappear (they behave like text)
1. based on 3EmaBB, uses plot*, barssince and security functions
2. you can't set certain constants from input due to Pinescript limitations - change the code as needed, recompile and use as a private version
3. Levels = trackprice implementation
4. Show Max Bars Back = show_last implementation
5. swma has a fixed length = 4, alma and linreg have additional offset and smoothing params
6. Smoothing is applied by default for visual aesthetics on MTF. To use exact ma mtf values (lines with stair stepping) - disable it
Good Luck! You can explore, modify/reuse the code to build your own indicators.

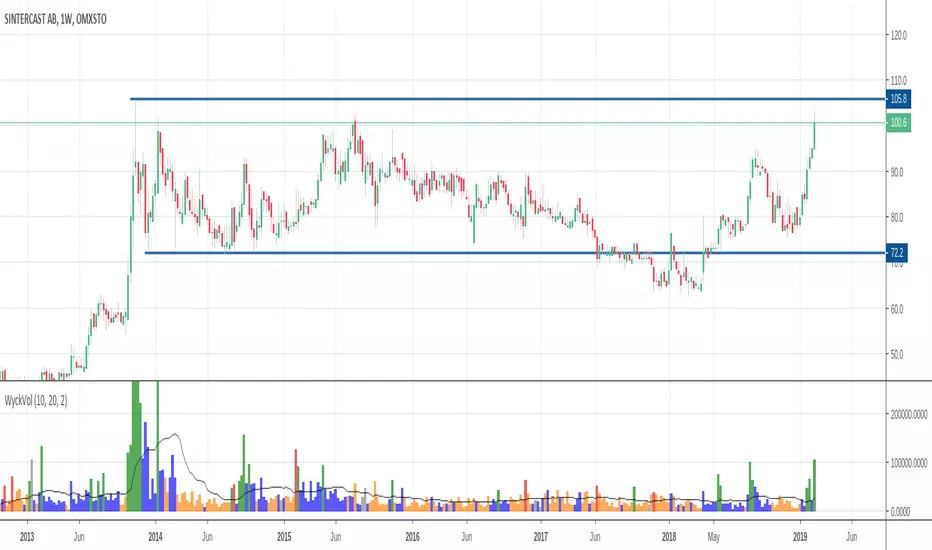
Wyckoff Volume ColorThis volume indicator is intended to be used for the Wyckoff strategy.
Green volume bar indicates last price close above close 10 days ago together with volume larger than 2 * SMA(volume, 20)
Blue volume bar indicates last price close above close 10 days ago together with volume less than 2 * SMA(volume, 20)
Orange volume bar indicates last price close lower than close 10 days ago together with volume less than 2 * SMA(volume, 20)
Red volume bar indicates last price close lower than close 10 days ago together with volume larger than 2 * SMA(volume, 20)
The main purpose is to have green bars with a buying climax and red bars with a selling climax.
Three variables can be changed by simply pressing the settings button.
How many days back the closing price is compared to. Now 10 days.
How many times the SMA(volume) is multiplied by. Now times 2.
How many days the SMA(volume) consists by. Now 20 days.
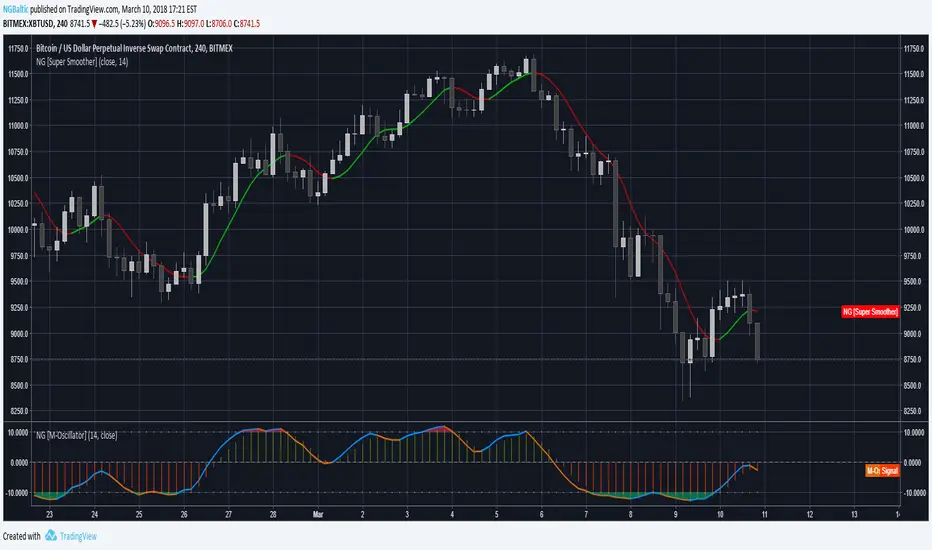
M-OscillatorThe M-Oscillator is a bounded oscillator that moves between (-14) and (+14), it gives early buy/sell signals, spots divergences, displays overbought/oversold levels, and provides re-entry points, and it also work as a trend identifier.
Interpretation
• M-Oscillator is plotted along the bottom of the price chart; it fluctuates between positive and negative 14.
• Movement above 10 is considered overbought, and movement below -10 is oversold.
• In sharp moves to the upside, the M-Oscillator fluctuates between 5 and 14, while in down side it fluctuates between -5 and -14.
• In an uptrend, the M-Oscillator fluctuates between zero and 14 and vice versa.
Trading tactics
Overbought/Oversold: We define the overbought area as anywhere above the 10 level.
The oversold area is below -10. When the M-Oscillator goes above 10 (overbought) and then re-crosses it to the downside, a sell signal is triggered.
When the M-Oscillator surpasses -10 to the downside and then re-crosses back above this level, a buy signal is triggered.
This tactic is only successful during sideways markets; during an uptrend, the oscillator will remain in its overbought territory for long period of times.
During a downtrend, it will remain in oversold for a long time.
Divergence
Divergence is one of the most striking features of the M-Oscillator.
It is a very important aspect of technical analysis that enhances trading tactics enormously; it shows hidden weakness or strength in the market, which is not apparent in the price action.
A positive divergence occurs when the price is declining and makes a lower low, while M-Oscillator witnesses a higher low.
A negative divergence occurs when the price is rising and makes a higher High, while the M-Oscillator makes a lower high, which indicates hidden weakness in the market.
Divergences are very important as they give us early hints of trend reversal (weekly chart)
Iridescent Liquidity Prism [JOAT]Iridescent Liquidity Prism | Peer Momentum HUD
A multi-layered order-flow indicator that combines microstructure analysis, smart-money footprint detection, and intermarket momentum signals. The script uses dynamic color-shifting themes to visualize liquidity patterns, structure, and peer momentum data directly on the chart.
There is so much to choose from inside the settings, if you think it's a mess on the chart it's because you have to personally customize it based on your needs...
Core Functionality
The indicator calculates and displays several analytical layers simultaneously:
Order-Flow Imbalance (OFI): Calculates buy vs. sell volume pressure using volume-weighted price distribution within each bar. Uses an EMA filter (default: 55 periods) to smooth the signal. Values are normalized using standard deviation to identify significant imbalances.
Smart Money Footprints: Detects accumulation and distribution zones by comparing volume rate of change (ROC) against price ROC. When volume ROC exceeds a threshold (default: 65%) and price ROC is positive, accumulation is detected. When volume ROC is high but price ROC is negative, distribution is detected.
Fractal Structure Mapping: Identifies pivot highs and lows using a fractal detection algorithm (default: 5-bar period). Maintains a rolling window of recent structure points (default: 4 levels) and draws connecting lines to show trend structure.
Fair Value Gap (FVG) Detection: Automatically detects price gaps where three consecutive candles create an imbalance. Bullish FVGs occur when the current low exceeds the high two bars ago. Bearish FVGs occur when the current high is below the low two bars ago. Gaps persist for a configurable duration (default: 320 bars) and fade when price fills the gap.
Liquidity Void Detection: Identifies candles where the high-low range exceeds an ATR threshold (default: 1.7x ATR) while volume is below average (default: 65% of 20-bar average). These conditions suggest areas where liquidity may be thin.
Price/Volume Divergence: Uses linear regression to detect when price trend direction disagrees with volume trend direction. A divergence alert appears when price is trending up while volume is trending down, or vice versa.
Peer Momentum Heatmap (PMH): Calculates composite momentum scores for up to 6 symbols across 4 timeframes. Each score combines RSI (default: 14 periods) and StochRSI (default: 14 periods, 3-bar smooth) to create a momentum composite between -1 and +1. The highest absolute momentum score across all combinations is displayed in the HUD.
Custom settings using Fractal Pivots, Skeleton Structure, Pulse Liquidity Voids, Bottom Colorful HeatMaps, and Iridescent Field.
---
Visual Components
Spectrum Aura Glow: ATR-weighted bands (default: 0.25x ATR) that expand and contract around price action, indicating volatility conditions. The thickness adapts to market volatility.
Chromatic Flow Trail: A blended line combining EMA and WMA of price (default: 8-period EMA blended with WMA at 65% ratio). The trail uses gradient colors that shift based on a phase oscillator, creating an iridescent effect.
Volume Heat Projection: Creates horizontal volume profile bands at price levels (default: 14 levels). Scans recent bars (default: 150 bars) to calculate volume concentration. Each level is colored based on its volume density relative to the maximum volume level.
Structure Skeleton: Dashed lines connecting fractal pivot points. Uses two layers: a primary line (2-3px width) and an optional glow overlay (4-5px width) for enhanced visibility.
Fractal Markers: Diamond shapes placed at pivot high and low points. Color-coded: primary color for highs, secondary color for lows.
Iridescent Color Themes: Five color themes available: Iridescent (default), Pearlescent, Prismatic, ColorShift, and Metallic. Colors shift dynamically using a phase oscillator that cycles through the color spectrum based on bar index and a speed multiplier (default: 0.35).
---
HUD Console Metrics
The right-side HUD displays seven key metrics:
Flow: Shows OFI status: ▲ FLOW BUY when normalized OFI exceeds imbalance threshold (default: 2.2), ▼ FLOW SELL when below -2.2, or ◆ FLOW BAL when balanced.
Struct: Structure trend bias: ▲ STRUCT BULL when microtrend > 2, ▼ STRUCT BEAR when < -2, or ◆ STRUCT RANGE when neutral.
Smart$: Institutional activity: ◈ ACCUM when smart money index = 1, ◈ DISTRIB when = -1, or ○ IDLE when inactive.
Liquid: Liquidity state: ⚡ VOID when a liquidity void is detected, or ● NORMAL otherwise.
Diverg: Divergence status: ⚠ ALERT when price/volume divergence detected, or ✓ CLEAR when aligned.
PMH: Peer Momentum Heatmap status: Shows dominant timeframe and momentum score. Displays 🪩 for bull surge (above 0.55 threshold) or 🧨 for bear surge (below -0.55).
FVG: Fair Value Gap status: Shows active gap count or CLEAR when no gaps exist. Displays GAP LONG when bullish gap detected, GAP SHORT when bearish gap detected.
Pearlscent Color with Volume Heatmap.
Parameters and Settings
Microstructure Engine:
Analysis Depth: 20-250 bars (default: 55) - Controls OFI smoothing period
Liquidity Threshold ATR: 1.0-4.0 (default: 1.7) - Multiplier for void detection
Imbalance Ratio: 1.5-6.0 (default: 2.2) - Standard deviations for OFI significance
Smart Money Layer:
Smart Money Window: 10-150 bars (default: 24) - Period for ROC calculations
Accumulation Threshold: 40-95% (default: 65%) - Volume ROC threshold
Structural Mapping:
Fractal Pivot Period: 3-15 bars (default: 5) - Period for pivot detection
Structure Memory: 2-8 levels (default: 4) - Number of structure points to track
Volume Heat Projection:
Heat Map Lookback: 60-400 bars (default: 150) - Bars to analyze for volume profile
Heat Map Levels: 5-30 levels (default: 14) - Number of price level bands
Heat Map Opacity: 40-100% (default: 92%) - Transparency of heat map boxes
Heat Map Width Limit: 6-80 bars (default: 26) - Maximum width of heat map boxes
Heat Map Visibility Threshold: 0.0-0.5 (default: 0.08) - Minimum density to display
Iridescent Enhancements:
Visual Theme: Iridescent, Pearlescent, Prismatic, ColorShift, or Metallic
Color Shift Speed: 0.05-1.00 (default: 0.35) - Speed of color phase oscillation
Aura Thickness (ATR): 0.05-1.0 (default: 0.25) - Multiplier for aura band width
Chromatic Trail Length: 2-50 bars (default: 8) - Period for trail calculation
Trail Blend Ratio: 0.1-0.95 (default: 0.65) - EMA/WMA blend percentage
FVG Persistence: 50-600 bars (default: 320) - Bars to keep FVG boxes active
Max Active FVG Boxes: 10-200 (default: 40) - Maximum boxes on chart
FVG Base Opacity: 20-95% (default: 80%) - Transparency of FVG boxes
Peer Momentum Heatmap:
Peer Symbols: Comma-separated list of up to 6 symbols (e.g., "BTCUSD,ETHUSD")
Peer Timeframes: Comma-separated list of up to 4 timeframes (default: "60,240,D")
PMH RSI Length: 5-50 periods (default: 14)
PMH StochRSI Length: 5-50 periods (default: 14)
PMH StochRSI Smooth: 1-10 periods (default: 3)
Super Momentum Threshold: 0.2-0.95 (default: 0.55) - Threshold for surge detection
Clarity & Readability:
Liquidity Void Opacity: 5-90% (default: 30%)
Smart Money Footprint Opacity: 5-90% (default: 35%)
HUD Background Opacity: 40-95% (default: 70%)
Iridescent Field:
Field Opacity: 20-100% (default: 86%) - Background color intensity
Field Smooth Length: 10-200 bars (default: 34) - Smoothing for background gradient
---
Alerts
The indicator provides seven alert conditions:
Liquidity Void Detected - Triggers when void conditions are met
Strong Order Flow - Triggers when normalized OFI exceeds imbalance ratio
Smart Money Activity - Triggers when accumulation or distribution detected
Price/Volume Divergence - Triggers when divergence conditions occur
Structure Shift - Triggers when structure polarity changes significantly
PMH Bull Surge - Triggers when PMH exceeds positive threshold (if enabled)
PMH Bear Surge - Triggers when PMH exceeds negative threshold (if enabled)
Bull/Bear Prismatic FVG - Triggers when new FVG is detected (if FVG display enabled)
---
Usage Considerations
Performance may vary on lower timeframes due to the volume heat map calculations scanning multiple bars. Consider reducing heat map lookback or levels if experiencing slowdowns.
The PMH feature requires data requests to other symbols/timeframes, which may impact performance. Limit the number of peer symbols and timeframes for optimal performance.
FVG boxes automatically expire after the persistence period to prevent chart clutter. The maximum box limit (default: 40) prevents excessive memory usage.
Color themes affect all visual elements. Choose a theme that provides good contrast with your chart background.
The indicator is designed for overlay display. All visual elements are positioned relative to price action.
Structure lines are drawn dynamically as new pivots form. On fast-moving markets, structure may update frequently.
Volume calculations assume typical volume data availability. Symbols without volume may show incomplete data for volume-dependent features.
---
Technical Notes
Built on Pine Script v6 with dynamic request capability for PMH functionality.
Uses exponential moving averages (EMA) and weighted moving averages (WMA) for trail calculations to balance responsiveness and smoothness.
Volume profile calculation uses price level buckets. Higher levels provide finer granularity but require more computation.
Iridescent color engine uses a phase oscillator with sine wave calculations for smooth color transitions.
Box management includes automatic cleanup of expired boxes to maintain performance.
All visual elements use color gradients and transparency for smooth blending with price action.
---
Customization Examples
Intraday Scalping Setup:
Analysis Depth: 30 bars
Heat Map Lookback: 100 bars
FVG Persistence: 150 bars
PMH Window: 15 bars
Fast color shift speed: 0.5+
Macro Structure Tracking:
Analysis Depth: 100+ bars
Heat Map Lookback: 300+ bars
FVG Persistence: 500+ bars
Structure Memory: 6-8 levels
Slower color shift speed: 0.2
---
Limitations
Volume heat map calculations may be computationally intensive on lower timeframes with high lookback values.
PMH requires valid symbol names and accessible timeframes. Invalid symbols or timeframes will return no data.
FVG detection requires at least 3 bars of history. Early bars may not show FVG boxes.
Structure lines connect points but do not predict future structure. They reflect historical pivot relationships.
Color themes are aesthetic choices and do not affect calculation logic.
The indicator does not provide trading signals. All visual elements are analytical tools that require interpretation in context of market conditions.
Open Source
This indicator is open source and available for modification and distribution. The code is published with Pine Script v6 compliance. Users are free to customize parameters, modify calculations, and adapt the visual elements to their trading needs.
For questions, suggestions, or anything please talk to me in private messages or comments below!
Would love to help!
- officialjackofalltrades

Trading Volatility Clock⏰ TRADING VOLATILITY CLOCK - Know When the Action Happens (Anywhere in the World)
A real-time session tracker with multi-timezone support for active traders who need to know when US market volatility strikes - no matter where they are in the world. Perfect for day traders, scalpers, and anyone trading liquid US markets.
══════════════════════════════════════════════════════
📊 WHAT IT DOES
This indicator displays a live clock showing:
- Current time in YOUR selected timezone (10 major timezones supported)
- Active US market session with color-coded volatility levels
- Countdown timer showing time remaining in current session
- Preview of the next upcoming session
- Optional alerts when entering high-volatility periods
══════════════════════════════════════════════════════
🌍 MULTI-TIMEZONE SUPPORT
SESSIONS ALWAYS TRACK US MARKET HOURS (Eastern Time):
No matter which timezone you select, the sessions always trigger at the correct US market times. Perfect for international traders who want to:
• See their local time while tracking US market sessions
• Know exactly when US volatility hits in their timezone
• Plan their trading day around US market hours
SUPPORTED TIMEZONES:
• America/New_York (ET) - Eastern Time
• America/Chicago (CT) - Central Time
• America/Los_Angeles (PT) - Pacific Time
• Europe/London (GMT) - Greenwich Mean Time
• Europe/Berlin (CET) - Central European Time
• Asia/Tokyo (JST) - Japan Standard Time
• Asia/Shanghai (CST) - China Standard Time
• Asia/Hong_Kong (HKT) - Hong Kong Time
• Australia/Sydney (AEDT) - Australian Eastern Time
• UTC - Coordinated Universal Time
EXAMPLE: A trader in Tokyo selects "Asia/Tokyo"
• Clock shows: 11:30 PM JST
• Session shows: "Opening Drive" 🔥 HIGH
• They know: US market just opened (9:30 AM ET in New York)
══════════════════════════════════════════════════════
🎯 WHY IT'S USEFUL
Whether you trade futures, high-volume stocks, or ETFs, volatility isn't constant throughout the day. Knowing WHEN to expect movement is critical:
🔥 HIGH VOLATILITY (Red):
• Opening Drive (9:30-10:30 AM ET) - Highest volume of the day
• Power Hour (3:00-4:00 PM ET) - Second-highest volume, final push
⚡ MEDIUM VOLATILITY (Yellow):
• Pre-Market (8:00-9:30 AM ET) - Building momentum
• Lunch Return (1:00-2:00 PM ET) - Traders returning
• Afternoon Session (2:00-3:00 PM ET) - Trend continuation
• After Hours (4:00-5:00 PM ET) - News reactions
💤 LOW VOLATILITY (Gray):
• Overnight Grind (12:00-8:00 AM ET) - Thin volume
• Mid-Morning Chop (10:30-11:30 AM ET) - Ranges form
• Lunch Hour (11:30 AM-1:00 PM ET) - Dead zone
• Evening Fade (5:00-8:00 PM ET) - Volume dropping
══════════════════════════════════════════════════════
⚙️ CUSTOMIZATION OPTIONS
TIMEZONE SETTINGS:
• Select from 10 major timezones worldwide
• Clock automatically displays in your local time
• Sessions remain locked to US market hours
SESSION TIME CUSTOMIZATION:
• Every session boundary is adjustable (in minutes from midnight ET)
• Perfect for traders who define sessions differently
• Advanced users can create custom volatility schedules
DISPLAY OPTIONS:
• Toggle next session preview on/off
• Enable/disable high volatility alerts
• Clean, unobtrusive table display in top-right corner
══════════════════════════════════════════════════════
💡 HOW TO USE
1. Add indicator to any chart (works on all timeframes)
2. Select your timezone in Settings → Timezone Settings
3. Set your chart to 1-minute timeframe for real-time updates
4. Customize session times if needed (Settings → Session Time Customization)
5. Watch the top-right corner for live session tracking
TRADING APPLICATIONS:
• Avoid trading during dead zones (lunch hour, mid-morning chop)
• Increase position size during high volatility windows
• Set alerts for Opening Drive and Power Hour
• Plan your trading day around US market volatility schedule
• International traders can track US sessions in their local time
══════════════════════════════════════════════════════
🎓 EDUCATIONAL VALUE
This indicator teaches traders:
• Market microstructure and volume patterns
• Why certain times produce better opportunities
• How institutional flows create intraday patterns
• The importance of timing in active trading
• How to adapt US market trading to any timezone
══════════════════════════════════════════════════════
⚠️ IMPORTANT NOTES
- Works best on 1-minute charts for frequent updates
- Sessions are ALWAYS based on US Eastern Time (ET)
- Timezone selection only changes the clock display
- Clock updates when new bar closes (not tick-by-tick)
- Alerts trigger once per bar when enabled
- Perfect for international traders tracking US markets
══════════════════════════════════════════════════════
📈 BEST USED WITH
- High-volume US stocks: TSLA, NVDA, AAPL, AMD, META
- Major US ETFs: SPY, QQQ, IWM, DIA
- US Futures: ES, NQ, RTY, YM, MES, MNQ
- Any liquid US instrument with clear intraday volume patterns
══════════════════════════════════════════════════════
🌏 FOR INTERNATIONAL TRADERS
This tool is specifically designed for traders outside the US who need to:
• Track US market sessions in their local timezone
• Know when to be at their desk for US volatility
• Avoid waking up for low-volatility periods
• Maximize trading efficiency around US market hours
No more timezone confusion. No more missing the opening bell. Just set your timezone and trade with confidence.
══════════════════════════════════════════════════════
This is an open-source educational tool. Feel free to modify and adapt to your trading style!
Happy Trading! 🚀

Candle Pattern Library [1CG]Candle Pattern Library
A comprehensive and easy-to-use Pine Script™ library for detecting single, two, and three-candle patterns. This library provides detailed pattern analysis including size classification, direction validation, and specific pattern identification.
Quick Start
1. Import the Library
import OneCleverGuy/CandlePatternLibrary/1 as CPL
2. Analyze Candles
Use the main analysis functions to detect patterns. You can analyze the current forming candle or confirmed historical candles.
// 1. Analyze candles (Current , Previous , and the one before )
// Note: We use full variable names for clarity.
CandleData candleNewest = CPL.analyzeCandle(open, high, low, close, 250, 50, 10, 50, 85)
CandleData candleMiddle = CPL.analyzeCandle(open , high , low , close , 250, 50, 10, 50, 85)
CandleData candleOldest = CPL.analyzeCandle(open , high , low , close , 250, 50, 10, 50, 85)
// 2. Analyze multi-candle patterns
// Pass candles in chronological order: Oldest -> Newest
var twoCandleData = CPL.analyzeTwoCandlePattern(candleMiddle, candleNewest, 10, 85)
var threeCandleData = CPL.analyzeThreeCandlePattern(candleOldest, candleMiddle, candleNewest)
Enums Reference
These are the Enum Types exported by the library. When checking results, use the pattern Alias.EnumType.Value (e.g., CPL.CandlePattern.Hammer).
CandlePattern
Enum Type for single-candle formations.
Usage: CPL.CandlePattern.
Values:
Unknown : No specific pattern detected.
RegularBullish : A standard bullish candle.
RegularBearish : A standard bearish candle.
BullishMarubozu : Bullish candle with little to no wicks.
BearishMarubozu : Bearish candle with little to no wicks.
Hammer : Small body at the top of the range (bullish reversal).
ShootingStar : Small body at the bottom of the range (bearish reversal).
SpinningTop : Small body centered in the range.
Doji : Open and close are effectively equal.
LongLeggedDoji : Doji with long upper and lower wicks.
CrossDoji : Doji with the body in the upper section.
DragonflyDoji : Doji where open/close are at the high.
InvertedCrossDoji : Doji with the body in the lower section.
GravestoneDoji : Doji where open/close are at the low.
FourPriceDoji : Open, High, Low, and Close are all equal.
TwoCandlePattern
Enum Type for two-candle formations.
Usage: CPL.TwoCandlePattern.
Values:
None : No two-candle pattern detected.
BullishEngulfingWeak : Bullish candle engulfs the previous body (close does not engulf range).
BullishEngulfingStrong : Bullish candle completely engulfs the previous body close outside range.
BearishEngulfingWeak : Bearish candle engulfs the previous body.
BearishEngulfingStrong : Bearish candle completely engulfs the previous body.
InsideBar : The second candle is completely contained within the first.
TweezerTop : Two candles with matching highs (bearish reversal).
TweezerBottom : Two candles with matching lows (bullish reversal).
BullishRailRoad : Two opposite Marubozus (Down -> Up).
BearishRailRoad : Two opposite Marubozus (Up -> Down).
ThreeCandlePattern
Enum Type for three-candle formations.
Usage: CPL.ThreeCandlePattern.
Values:
None : No three-candle pattern detected.
ThreeWhiteSoldiers : Three consecutive bullish candles.
ThreeBlackCrows : Three consecutive bearish candles.
ThreeWhiteSoldiersWithBullishFVG : Three White Soldiers containing a Bullish FVG.
ThreeWhiteSoldiersWithBearishFVG : Three White Soldiers containing a Bearish FVG.
ThreeBlackCrowsWithBullishFVG : Three Black Crows containing a Bullish FVG.
ThreeBlackCrowsWithBearishFVG : Three Black Crows containing a Bearish FVG.
MorningStar : Bearish -> Small/Doji -> Bullish (Bullish Reversal).
EveningStar : Bullish -> Small/Doji -> Bearish (Bearish Reversal).
BullishAbandonedBaby : Morning Star with gaps between all candles.
BearishAbandonedBaby : Evening Star with gaps between all candles.
EngulfingSandwich : Bearish -> Bullish (Engulfing) -> Bearish (Inside).
BullishFairValueGap : A gap between Candle 1 High and Candle 3 Low.
BearishFairValueGap : A gap between Candle 1 Low and Candle 3 High.
CandleSize
Enum Type for candle size classification.
Usage: CPL.CandleSize.
Values:
Short
Normal
Long
CandleDirection
Enum Type for candle direction classification.
Usage: CPL.CandleDirection.
Values:
Bearish
Neutral
Bullish
Function Reference
Analysis Functions
analyzeCandle(_open, _high, _low, _close, _avgSize, _sizeThresholdPct, _equivTolerance, _bodyTolerance, _positionThreshold)
analyzeCandle - Analyzes a single candle's OHLC data to determine its size, direction, and single-candle pattern.
Parameters:
_open (float) : (float) - Candle open price.
_high (float) : (float) - Candle high price.
_low (float) : (float) - Candle low price.
_close (float) : (float) - Candle close price.
_avgSize (float) : (float) - Baseline size (wick range) to compare against.
_sizeThresholdPct (float) : (float) - % difference from average to be considered Long/Short (e.g., 50.0).
_equivTolerance (float) : (float) - Absolute price diff for Close to equal Open (Doji checks).
_bodyTolerance (float) : (float) - Absolute price diff for "Small Body" checks.
_positionThreshold (int) : (int) - Int (0-100) determining valid wick ratios for Hammers/Shooting Stars (e.g., 85).
Returns: (CandleData) - CandleData object containing CandlePattern, CandleSize, CandleDirection.
analyzeTwoCandlePattern(_candle1, _candle2, _equivTolerance, _positionThreshold)
analyzeTwoCandlePattern - Analyzes two consecutive candles to find pairs like Engulfing, Tweezers, or Inside Bars.
Parameters:
_candle1 (CandleData) : (CandleData) - The first (older) candle data (previous).
_candle2 (CandleData) : (CandleData) - The second (newer) candle data (current).
_equivTolerance (float) : (float) - Price tolerance for matching highs/lows (Tweezers).
_positionThreshold (int) : (int) - Threshold for wick validations.
Returns: (TwoCandleData) - TwoCandleData object containing TwoCandlePattern.
analyzeThreeCandlePattern(_candle1, _candle2, _candle3)
analyzeThreeCandlePattern - Analyzes three consecutive candles to find complex patterns like Morning Stars, Abandoned Babies, or Three White Soldiers.
Parameters:
_candle1 (CandleData) : (CandleData) - The first (oldest) candle data.
_candle2 (CandleData) : (CandleData) - The second (middle) candle data.
_candle3 (CandleData) : (CandleData) - The third (newest) candle data.
Returns: (ThreeCandleData) - ThreeCandleData object containing ThreeCandlePattern.
Naming Utilities
getPatternName(_pattern)
getPatternName - Returns the string name of a candle pattern.
Parameters:
_pattern (CandlePattern) : (CandlePattern) - The candle pattern enum value.
Returns: (string) - Human-readable pattern name (e.g., "Hammer").
getTwoCandlePatternName(_pattern)
getTwoCandlePatternName - Returns the string name of a two-candle pattern.
Parameters:
_pattern (TwoCandlePattern) : (TwoCandlePattern) - The two-candle pattern enum value.
Returns: (string) - Human-readable pattern name (e.g., "Bullish Engulfing").
getThreeCandlePatternName(_pattern)
getThreeCandlePatternName - Returns the string name of a three-candle pattern.
Parameters:
_pattern (ThreeCandlePattern) : (ThreeCandlePattern) - The three-candle pattern enum value.
Returns: (string) - Human-readable pattern name (e.g., "Morning Star").
getSizeName(_size)
getSizeName - Returns the string name of a candle size.
Parameters:
_size (CandleSize) : (CandleSize) - The candle size enum value.
Returns: (string) - Human-readable size name ("Short", "Normal", or "Long").
getDirectionName(_direction)
getDirectionName - Returns the string name of a candle direction.
Parameters:
_direction (CandleDirection) : (CandleDirection) - The candle direction enum value.
Returns: (string) - Human-readable direction name ("Bullish", "Bearish", or "Neutral").

Simple Candle Strategy# Candle Pattern Strategy - Pine Script V6
## Overview
A TradingView trading strategy script (Pine Script V6) that identifies candlestick patterns over a configurable lookback period and generates trading signals based on pattern recognition rules.
## Strategy Logic
The strategy analyzes the most recent N candlesticks (default: 5) and classifies their patterns into three categories, then generates buy/sell signals based on specific pattern combinations.
### Candlestick Pattern Classification
Each candlestick is classified as one of three types:
| Pattern | Definition | Formula |
|---------|-----------|---------|
| **Close at High** | Close price near the highest price of the candle | `(high - close) / (high - low) ≤ (1 - threshold)` |
| **Close at Low** | Close price near the lowest price of the candle | `(close - low) / (high - low) ≤ (1 - threshold)` |
| **Doji** | Opening and closing prices very close; long upper/lower wicks | `abs(close - open) / (high - low) ≤ threshold` |
### Trading Rules
| Condition | Action | Signal |
|-----------|--------|--------|
| Number of Doji candles ≥ 3 | **SKIP** - Market is too chaotic | No trade |
| "Close at High" count ≥ 2 + Last candle closes at high | **LONG** - Bullish confirmation | Buy Signal |
| "Close at Low" count ≥ 2 + Last candle closes at low | **SHORT** - Bearish confirmation | Sell Signal |
## Configuration Parameters
All parameters are adjustable in TradingView's "Settings/Inputs" tab:
| Parameter | Default | Range | Description |
|-----------|---------|-------|-------------|
| **K-line Lookback Period** | 5 | 3-20 | Number of candlesticks to analyze |
| **Doji Threshold** | 0.1 | 0.0-1.0 | Body size / Total range ratio for doji identification |
| **Doji Count Limit** | 3 | 1-10 | Number of dojis that triggers skip signal |
| **Close at High Proximity** | 0.9 | 0.5-1.0 | Required proximity to highest price (0.9 = 90%) |
| **Close at Low Proximity** | 0.9 | 0.5-1.0 | Required proximity to lowest price (0.9 = 90%) |
### Parameter Tuning Guide
#### Proximity Thresholds (Close at High/Low)
- **0.95 or higher**: Stricter - only very strong candles qualify
- **0.90 (default)**: Balanced - good for most market conditions
- **0.80 or lower**: Looser - catches more patterns, higher false signals
#### Doji Threshold
- **0.05-0.10**: Strict doji identification
- **0.10-0.15**: Standard doji detection
- **0.15+**: Includes near-doji patterns
#### Lookback Period
- **3-5 bars**: Fast, sensitive to recent patterns
- **5-10 bars**: Balanced approach
- **10-20 bars**: Slower, filters out noise
## Visual Indicators
### Chart Markers
- **Green Up Arrow** ▲: Long entry signal triggered
- **Red Down Arrow** ▼: Short entry signal triggered
- **Gray X**: Skip signal (too many dojis detected)
### Statistics Table
Located at top-right corner, displays real-time pattern counts:
- **Close at High**: Count of candles closing near the high
- **Close at Low**: Count of candles closing near the low
- **Doji**: Count of doji/near-doji patterns
### Signal Labels
- Green label: "✓ Long condition met" - below entry bar
- Red label: "✓ Short condition met" - above entry bar
- Gray label: "⊠ Too many dojis, skip" - trade skipped
## Risk Management
### Exit Strategy
The strategy includes built-in exit rules based on ATR (Average True Range):
- **Stop Loss**: ATR × 2
- **Take Profit**: ATR × 3
Example: If ATR is $10, stop loss is at -$20 and take profit is at +$30
### Position Sizing
Default: 100% of equity per trade (adjustable in strategy properties)
**Recommendation**: Reduce to 10-25% of equity for safer capital allocation
## How to Use
### 1. Copy the Script
1. Open TradingView
2. Go to Pine Script Editor
3. Create a new indicator
4. Copy the entire `candle_pattern_strategy.pine` content
5. Click "Add to Chart"
### 2. Apply to Chart
- Select your preferred timeframe (1m, 5m, 15m, 1h, 4h, 1d)
- Choose a trading symbol (stocks, forex, crypto, etc.)
- The strategy will generate signals on all historical bars and in real-time
### 3. Configure Parameters
1. Right-click the strategy on chart → "Settings"
2. Adjust parameters in the "Inputs" tab
3. Strategy will recalculate automatically
4. Backtest results appear in the Strategy Tester panel
### 4. Backtesting
1. Click "Strategy Tester" (bottom panel)
2. Set date range for historical testing
3. Review performance metrics:
- Win rate
- Profit factor
- Drawdown
- Total returns
## Key Features
✅ **Execution Model Compliant** - Follows official Pine Script V6 standards
✅ **Global Scope** - All historical references in global scope for consistency
✅ **Adjustable Sensitivity** - Fine-tune all pattern detection thresholds
✅ **Real-time Updates** - Works on both historical and real-time bars
✅ **Visual Feedback** - Clear signals with labels and statistics table
✅ **Risk Management** - Built-in ATR-based stop loss and take profit
✅ **No Repainting** - Signals remain consistent after bar closes
## Important Notes
### Before Trading Live
1. **Backtest thoroughly**: Test on at least 6-12 months of historical data
2. **Paper trading first**: Practice with simulated trades
3. **Optimize parameters**: Find the best settings for your trading instrument
4. **Manage risk**: Never risk more than 1-2% per trade
5. **Monitor performance**: Review trades regularly and adjust as needed
### Market Conditions
The strategy works best in:
- Trending markets with clear directional bias
- Range-bound markets with defined support/resistance
- Markets with moderate volatility
The strategy may underperform in:
- Highly choppy/noisy markets (many false signals)
- Markets with gaps or overnight gaps
- Low liquidity periods
### Limitations
- Works on chart timeframes only (not intrabar analysis)
- Requires at least 5 bars of history (configurable)
- Fixed exit rules may not suit all trading styles
- No trend filtering (will trade both directions)
## Technical Details
### Historical Buffer Management
The strategy declares maximum bars back to ensure enough historical data:
```pine
max_bars_back(close, 20)
max_bars_back(open, 20)
max_bars_back(high, 20)
max_bars_back(low, 20)
```
This prevents runtime errors when accessing historical candlestick data.
### Pattern Detection Algorithm
```
For each bar in lookback period:
1. Calculate (high - close) / (high - low) → close_to_high_ratio
2. If close_to_high_ratio ≤ (1 - threshold) → count as "Close at High"
3. Calculate (close - low) / (high - low) → close_to_low_ratio
4. If close_to_low_ratio ≤ (1 - threshold) → count as "Close at Low"
5. Calculate abs(close - open) / (high - low) → body_ratio
6. If body_ratio ≤ doji_threshold → count as "Doji"
Signal Generation:
7. If doji_count ≥ cross_count_limit → SKIP_SIGNAL
8. If close_at_high_count ≥ 2 AND last_close_at_high → LONG_SIGNAL
9. If close_at_low_count ≥ 2 AND last_close_at_low → SHORT_SIGNAL
```
## Example Scenarios
### Scenario 1: Bullish Signal
```
Last 5 bars pattern:
Bar 1: Closes at high (95%) ✓
Bar 2: Closes at high (92%) ✓
Bar 3: Closes at mid (50%)
Bar 4: Closes at low (10%)
Bar 5: Closes at high (96%) ✓ (last bar)
Result:
- Close at high count: 3 (≥ 2) ✓
- Last closes at high: ✓
- Doji count: 0 (< 3) ✓
→ LONG SIGNAL ✓
```
### Scenario 2: Skip Signal
```
Last 5 bars pattern:
Bar 1: Doji pattern ✓
Bar 2: Doji pattern ✓
Bar 3: Closes at mid
Bar 4: Doji pattern ✓
Bar 5: Closes at high
Result:
- Doji count: 3 (≥ 3)
→ SKIP SIGNAL - Market too chaotic
```
## Performance Optimization
### Tips for Better Results
1. **Use Higher Timeframes**: 15m or higher reduces false signals
2. **Combine with Indicators**: Add volume or trend filters
3. **Seasonal Adjustment**: Different parameters for different seasons
4. **Instrument Selection**: Test on liquid, high-volume instruments
5. **Regular Rebalancing**: Adjust parameters quarterly based on performance
## Troubleshooting
### No Signals Generated
- Check if lookback period is too large
- Verify proximity thresholds aren't too strict (try 0.85 instead of 0.95)
- Ensure doji limit allows for trading (try 4-5 instead of 3)
### Too Many False Signals
- Increase proximity thresholds to 0.95+
- Reduce lookback period to 3-4 bars
- Increase doji limit to 3-4
- Test on higher timeframes
### Strategy Tester Shows Losses
- Review individual trades to identify patterns
- Adjust stop loss and take profit ratios
- Change lookback period and thresholds
- Test on different market conditions
## References
- (www.tradingview.com)
- (www.tradingview.com)
- (www.investopedia.com)
- (www.investopedia.com)
## Disclaimer
**This strategy is provided for educational and research purposes only.**
- Not financial advice
- Past performance does not guarantee future results
- Always conduct thorough backtesting before live trading
- Trading involves significant risk of loss
- Use proper risk management and position sizing
## License
Created: December 15, 2025
Version: 1.0
---
**For updates and modifications, refer to the accompanying documentation files.**

ICT Premium/Discount Zones [Exponential-X]Premium/Discount Zones - Visual Market Structure Tool
Overview
This indicator helps traders visualize premium and discount price zones based on recent market structure. It automatically identifies swing highs and lows within a specified lookback period and divides the price range into three key areas: Premium Zone, Equilibrium, and Discount Zone.
What This Indicator Does
The script continuously monitors price action and calculates:
Highest High and Lowest Low within the lookback period
Equilibrium Level - the midpoint between the swing high and low
Premium Zone - the area from equilibrium to the swing high (typically viewed as relatively expensive price levels)
Discount Zone - the area from the swing low to equilibrium (typically viewed as relatively cheap price levels)
Core Calculation Method
The indicator uses pivot point logic to identify significant swing highs and lows based on the pivot strength parameter. It then calculates the highest high and lowest low over the specified lookback period. The equilibrium is computed as the arithmetic mean of these two extremes, creating a fair value reference point.
The zones are dynamically updated as new price data becomes available, ensuring the visualization remains relevant to current market conditions.
Key Features
Dynamic Zone Detection
Automatically adjusts zones based on recent price action
Uses customizable lookback period for flexibility across different timeframes
Employs pivot strength parameter to filter out minor price fluctuations
Visual Clarity
Color-coded zones for easy identification (red for premium, green for discount)
Optional equilibrium line display
Adjustable zone label placement
Customizable color schemes to match your charting preferences
Alert Capabilities
Alerts when price enters the premium zone
Alerts when price enters the discount zone
Alerts when price returns to equilibrium
Helps traders monitor key zone interactions without constant chart watching
Customization Options
Adjustable lookback period (5-500 bars)
Configurable pivot strength for swing detection (1-20 bars)
Control over box extension into the future
Toggle labels and equilibrium line on/off
Full color customization for all visual elements
How to Use This Indicator
Setup
Add the indicator to your chart
Adjust the lookback period to match your trading timeframe (shorter for intraday, longer for swing trading)
Set pivot strength to filter out noise (higher values for major swings, lower for more frequent updates)
Customize colors and labels to your preference
Interpretation
Premium Zone: Price trading here may indicate potential resistance or selling opportunities when aligned with other technical factors
Discount Zone: Price trading here may indicate potential support or buying opportunities when aligned with other technical factors
Equilibrium: Acts as a fair value reference point where price often consolidates or reacts
Trading Applications
This tool works well when combined with other forms of analysis such as:
Trend identification indicators
Volume analysis
Support and resistance levels
Price action patterns
Market structure analysis
Important Considerations
This indicator identifies zones based purely on historical price data
Premium and discount zones are relative to the recent lookback period
The effectiveness varies across different market conditions and timeframes
Should be used as part of a comprehensive trading strategy, not in isolation
Past price structure does not guarantee future price behavior
Technical Details
Calculation Method
Uses Pine Script's ta.pivothigh() and ta.pivotlow() functions for swing detection
Employs ta.highest() and ta.lowest() for range calculation
Updates dynamically with each new bar
Draws zones using box objects for clear visual representation
Performance Optimization
Efficiently manages box and line objects to minimize resource usage
Uses conditional plotting to reduce unnecessary calculations
Limited to essential visual elements for chart clarity
Timeframe Compatibility
This indicator works on all timeframes but the recommended settings vary:
1-5 minute charts: Lookback period 10-20, Pivot strength 3-5
15-60 minute charts: Lookback period 20-50, Pivot strength 5-10
Daily charts: Lookback period 50-100, Pivot strength 10-15
Weekly charts: Lookback period 20-50, Pivot strength 5-10
Adjust these values based on the volatility of your specific instrument.
Limitations and Considerations
What This Indicator Does NOT Do
Does not provide buy or sell signals on its own
Does not predict future price movements
Does not account for fundamental factors or market events
Does not guarantee profitability or accuracy
Market Condition Awareness
In strong trending markets, price may remain in premium or discount zones for extended periods
During ranging conditions, price typically oscillates between zones more predictably
High volatility can cause frequent zone recalculations
Low volatility may result in narrow zones with limited practical use
Risk Considerations
Premium and discount are relative concepts, not absolute values
What appears as a discount zone may continue lower in a downtrend
What appears as a premium zone may continue higher in an uptrend
Always use proper risk management and position sizing
Consider multiple timeframe analysis for context
Version Information
This indicator is written in Pine Script v6, ensuring compatibility with the latest TradingView features and optimal performance.
Final Notes
This tool is designed to enhance your market analysis by providing a clear visual representation of premium and discount price zones. It should be used as one component of a well-rounded trading approach that includes proper risk management, multiple forms of analysis, and realistic expectations about market behavior.
The concept of premium and discount zones is rooted in auction market theory and the idea that price oscillates around fair value. However, traders should understand that these zones are interpretive tools based on historical data and do not constitute trading advice or predictions about future price action.
Remember to backtest any strategy using this indicator on historical data before applying it to live trading, and always trade responsibly within your risk tolerance.
Disclaimer: The information provided by this indicator is for educational and informational purposes only. It does not constitute financial advice, investment advice, trading advice, or any other sort of advice. Always conduct your own research and consult with qualified financial professionals before making trading decisions.
