Bollinger Band Spread (Dunk)Bollinger Band Width measures the distance between the upper and lower Bollinger Bands. It reflects market volatility—wider bands mean higher volatility, narrower bands mean lower volatility.
When the width contracts to low levels, it can signal price consolidation and potential breakouts. When the width expands, it indicates active markets or strong trends.
Traders use it to spot volatility squeezes, confirm breakouts, and compare relative volatility across assets or timeframes.
Cerca negli script per "弘历投教boll指标代码分析"

Bollinger RSI + SuperTrend TrailingBollinger Band RSI buy and sell signals with a super trend trailing stop

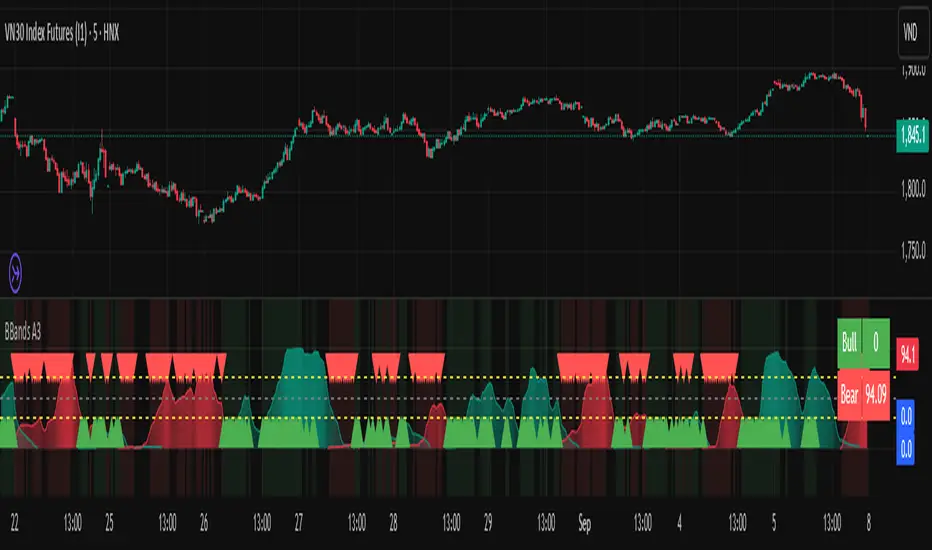
Bollinger Breakout A3 updateBollinger Breakout A3 update from LuxAlgo signal
You can try it with some another signal.
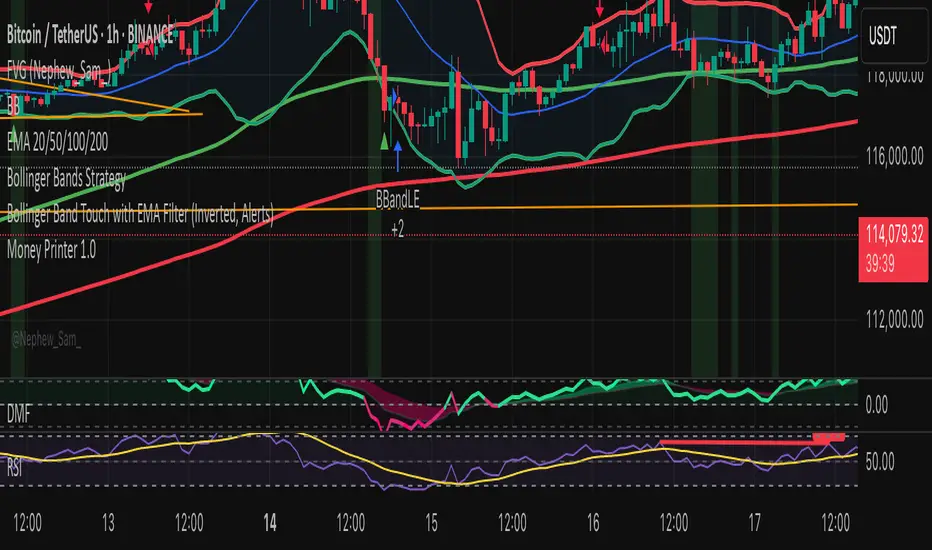
Bollinger Band Touch with EMA Filter (Inverted, Alerts)Bollinger Band Touch with EMA Filter above or below the 100 nd 200 emas


bollingerBandsV2Library "bollingerBandsV2"
Bollinger bands related functions
get_multiple_bollinger_bands(stdv1, stdv2, stdv3, stdv4, stdv5, stdv6, stdv7, length, source)
: Calculates 7 sets of bollinger bands, with 7 different standard deviations
Parameters:
stdv1 (float) : (simple int): standard deviation 1
stdv2 (float) : (simple int): standard deviation 2
stdv3 (float) : (simple int): standard deviation 3
stdv4 (float) : (simple int): standard deviation 4
stdv5 (float) : (simple int): standard deviation 5
stdv6 (float) : (simple int): standard deviation 6
stdv7 (float) : (simple int): standard deviation 7
length (simple int) : (simple int): Length for the bands
source (float) : (simple float): source for the calculation
Returns: : Returns 8 levels plus the range of all the levels.
get_bb_volatility(bb_highest, bb_lowest, ma_length, lookback)
: Provides a volatility indicator based on Bollinger Bands, and indicates wheather the volatility is increasing or decreasing.
Parameters:
bb_highest (float) : (simple float): Top Bollinger Band on which to calculate the range.
bb_lowest (float) : (simple float): Bottom Bollinger Band on which to calculate the range.
ma_length (simple int) : (simple int): Length to use in the smoothing of Bollinger Bands range.
lookback (int) : (simple int): Lookback period to identify a change in the Bollinger Bands range.
Returns: : Returns 8 levels plus the range of all the levels.
get_bbVolatility_data(source, length, stdv1, stdv2, stdv3, stdv4, stdv5, stdv6, stdv7, trend_direction)
: Generates Bollinger Bands Volatility
Parameters:
source (float) : (float): Source for Bollinger Bands
length (simple int) : (int): Length for Bollinger Bands
stdv1 (int) : (int): Standard Deviation 1
stdv2 (int) : (int): Standard Deviation 2
stdv3 (int) : (int): Standard Deviation 3
stdv4 (int) : (int): Standard Deviation 4
stdv5 (int) : (int): Standard Deviation 5
stdv6 (int) : (int): Standard Deviation 6
stdv7 (int) : (int): Standard Deviation 7
trend_direction (string) : (string): Current direction of the trend
Returns: : Returns a map with the levels, plus direction flag and the data table

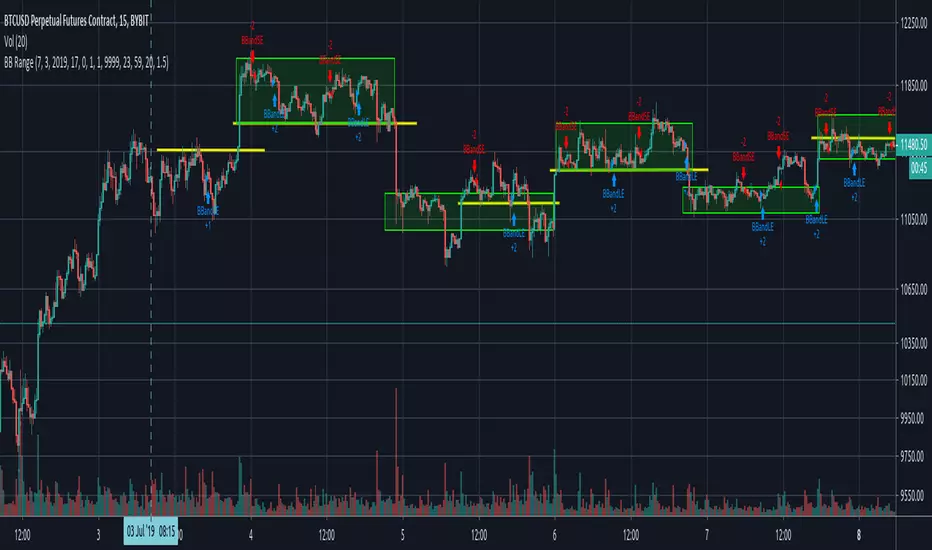
B.Bands | Augmented | Intra-range | Long-OnlyHere you have the essential trading engine based on Bollinger Bands .
The idea behind is to trade the intra-range of the bands.
How is going to work?
Define which Bollinger Bands we want to use. Classic Bollinger Bands or Augmented Bollinger Bands . Without selecting, the algorithm doesn't show a strategy.
Define the length of the Moving Average and the Standard Deviation by default the classic 20-2.
Define the Bollinger Bands Spread Max Range (Upper-Lower) to be able to determine wheter or not you're in a price range or potential breakout.
Define data source to trigger exit and entry points.
Define profit based on Middle Band or Opposite Band.
Define Stop Loss % and activate Trailing Stop if desired with the percentage required.
Determine if you want to sell only on profit after triggering the entry signal. * Note Stop Loss remains activated.
Choose a date range if you want to study a specific period.
Bear in mind, this is the essential trading engine, open for you to test, try and improve under your requirements. You can determinate when is the ideal market to implement it based on many other indicators. Maybe you wish to change the stop loss settings for ATR, previous low, etc. Totally up to you.
Note the script comes with initial capital, fee % and slippage by deault. This may change for your assets. Make sure you define it in advance.
NOTE: If you trade assets such BTC, you must update the initial capital. By default 5000 (USD) The script doesn't support fraction trading such 0.01BTC.
Will be updated on next version.
Feel free to get in touch if you've got any question.

Breakdown OscillatorThis is an indicator I made, based on the observation that the longer the price action hugs the bottom bollinger band, the greater the danger of a breakdown occurring (price decline). Essentially its a moving average of the difference between close price and the bottom bollinger band, divided by the bottom bollinger band; I like to use 1.5 standard deviations for the 20 day bollinger band. When it crosses below zero there is increased danger of a breakdown, although of course it could turn right around and go up again. In fact if it does turn around sharply from near zero it can be a good time to buy in the context of a pullback within an uptrend. I also have included the 'slope factor' which makes the indicator more negative based on the rate of downward movement of the bollinger moving average (set to 0 to omit this modification). The indicator can be used just for exits or can be used for entry signals when crossing over the green bar if desired. In the example chart you can see the price hitting the lower band or crossing below the 50dMA plenty of times on the way up while the indicator says to hold tight. When the breakdown comes its after a prolonged period of low volatility (band squeeze) on the lower side of the moving average so the signal comes quickly - they won't all be this good of course. This indicator can also be used to help spot potential shorting candidates.
This indicator also works well on weekly charts; I like the 1 standard deviation with 16 to 24 week long period, 6 to 10 week short period and 30 buy level. Your mileage may vary, please do your own research.

Vector Trinity I: Structure [VWAP-DBB] This indicator is **Part 1** of the "Vector Trinity" trading system—a comprehensive, data-driven framework designed to analyze market behavior through three distinct physical dimensions:
* **I: Structure (Space):** Defines the battlefield and volatility boundaries (Current Indicator).
* **II: Impulse (Time):** Identifies momentum ignition and energy release.
* **III: Flow (Energy):** Validates the move via volume and capital flow.
**2. Core Logic: Why Rolling VWAP?**
Most standard Bollinger Bands use a Simple Moving Average (SMA) as the centerline. The flaw in SMA is that it treats every candle equally, regardless of trading activity.
**Vector Trinity I** replaces the SMA with a **Rolling VWAP (Volume-Weighted Average Price)** over a rolling window (default 20).
* **Data Logic:** Price combined with Volume represents the true "cost basis" of the market.
* **Behavior:** The centerline becomes "sticky" during high-volume nodes and moves faster when real capital enters. It represents the *True Mean* of the market structure.
**3. The Dual-Band "Highway" Structure**
Instead of a single channel, this system utilizes a Double Bollinger Band (DBB) architecture based on Standard Deviations (StdDev) from the VWAP:
* **The Noise Zone (Basis to 1.0 StdDev):** The empty space in the middle. Price action here is often choppy and directionless.
* **The Acceleration Zone (1.0 to 2.0 StdDev):** The filled "Cloud." When candles close and stay within this zone, it indicates a strong trend (The Highway).
* **The Reversion Zone (> 2.0 StdDev):** Price is statistically extended and may revert to the mean.
**4. Volatility Squeeze Detection**
The indicator integrates a mechanical "Squeeze" detection based on the relationship between the Bollinger Bands (Variance) and Keltner Channels (ATR).
* **Squeeze ON (Orange Cloud & Dots):** Daily variance is at extreme lows. Energy is compressing. Do not trade direction; prepare for a breakout.
* **Squeeze OFF (Grey Cloud):** Expansion phase. Volatility is returning to the market.
**5. How to Use**
* **Step 1:** Observe the **Purple Line (VWAP)**. Its slope dictates the dominant trend structure.
* **Step 2:** Look for **Orange Zones**. This indicates a "Squeeze." Wait for the cloud to turn Grey.
* **Step 3:** Trade the breakout when price closes inside the "Acceleration Zone" (between the inner and outer bands) accompanied by Volume.
**Settings:**
* **Rolling Length:** 20 (Standard for swing/day trading).
* **Inner/Outer Bands:** 1.0 / 2.0 (The standard trend definition).
* **Squeeze Sensitivity:** 1.5 (Standard KC Multiplier).
---
### **中文说明**
**1. 简介:矢量三位一体系统 (Vector Trinity)**
本指标是“矢量三位一体”交易系统的 **第一部分**。这是一套基于数据逻辑的综合分析框架,旨在通过三个物理维度解构市场行为:
* **I: Structure 结构 (空间):** 定义价格运行的战场边界与波动率结构(本指标)。
* **II: Impulse 脉冲 (时间):** 识别动能的点火与能量释放。
* **III: Flow 流向 (能量):** 通过成交量与资金流验证突破的真伪。
**2. 核心逻辑:为什么要用 Rolling VWAP?**
传统的布林带使用简单移动平均线 (SMA) 作为中轨。SMA 的缺陷在于它平等地对待每一根 K 线,而忽略了成交量的权重。
**Vector Trinity I** 使用 **Rolling VWAP (滚动成交量加权平均价)** 替代了 SMA。
* **数据逻辑:** 只有结合了成交量的价格,才代表市场真实的“平均持仓成本”。
* **表现特征:** 在放量交易区,中轨会表现出更强的支撑/阻力特性;在缩量区则表现平滑。它代表了市场结构的*真实均值*。
**3. 双通道“高速公路”结构**
本系统不使用单条轨道,而是基于 VWAP 的标准差 (StdDev) 构建了双重布林带 (DBB) 架构:
* **噪音区 (中轨 到 1.0 标准差):** 中间的空白区域。在此区域内的价格通常是无方向的震荡。
* **加速区 (1.0 到 2.0 标准差):** 填充颜色的“云带”。当 K 线收盘并运行于此区域时,代表趋势确立,价格进入了“高速公路”。
* **回归区 (> 2.0 标准差):** 价格在统计学上过热,可能面临均值回归。
**4. 波动率挤压监测 (Squeeze)**
指标内置了基于布林带(方差)与肯特纳通道(ATR)对比的机械化“挤压”监测。
* **挤压状态 (橙色云带 & 底部圆点):** 每日方差处于极低值 (Variance at extreme lows)。市场正在积蓄能量。此时不应猜测方向,而应等待爆发。
* **扩张状态 (灰色云带):** 挤压结束,波动率回归,趋势展开。
**5. 使用方法**
* **第一步:** 观察 **紫色中轨 (VWAP)**。它的倾斜方向决定了主要的结构趋势。
* **第二步:** 寻找 **橙色区域**。这代表“挤压”正在发生。耐心等待云带变回灰色。
* **第三步:** 当价格突破并收盘在“加速区”(内轨与外轨之间)时,配合成交量介入交易。
**参数设置:**
* **Rolling Length (周期):** 20 (波段/日内交易的标准设置)。
* **Inner/Outer Bands (内外轨):** 1.0 / 2.0 (经典的趋势定义范围)。
* **Squeeze Sensitivity (敏感度):** 1.5 (标准肯特纳通道倍数)。

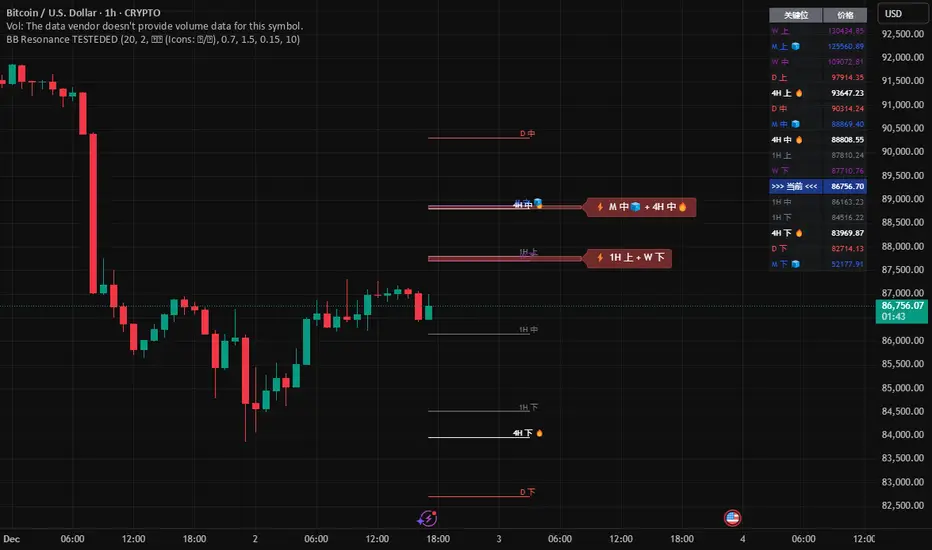
Global BB Resonance [by TESTEDED]📈 Global BB Resonance Hunter
1. Design Philosophy: Dimensional Reduction
In modern trading, "Information Overload" is the enemy. Traders often clutter their charts with 15+ Bollinger Band lines across 1H, 4H, Daily, and Weekly timeframes, resulting in a "spaghetti chart" that is impossible to read quickly.
The core logic of this indicator is "Dimensional Reduction." Instead of drawing every single line, this script runs a background algorithm to detect "Confluence" (Resonance).
The Thesis: A single Bollinger line (e.g., 1H Upper) is easily broken. However, when multiple dimensions overlap (e.g., 1H Upper + Daily Mid + Weekly Low) at the exact same price level, a "Market Consensus" is formed. These are the critical "Walls" of the market.
The Solution: We sort all data by Price, not Time. If lines cluster together within a specific threshold (e.g., 0.15%), the script draws a single Resonance Box instead of multiple confusing lines.
2. Key Features
🛡️ Multi-Timeframe Monitoring: Simultaneously monitors 1H, 4H, Daily, Weekly, and Monthly Bollinger Bands in the background, regardless of your chart's current timeframe.
⚡ Smart Resonance Detection: Automatically groups overlapping levels into "Resonance Boxes."
⚡ (2-Line Confluence): Watch closely.
⚡⚡ (3-Line Confluence): Strong Support/Resistance.
⚡⚡⚡ (4+ Lines): "Iron Wall" Resonance.
📊 Volatility State Perception: Detects if the bands are Squeezing (accumulating energy) or Expanding (trending).
Style Options: Choose between Icons (🧊/🔥) or Geek Symbols (>.< / <^>).
🧘 Focus Mode (Sniper View): A unique feature that hides all individual lines, leaving only the Resonance Boxes and the Dashboard. This keeps your chart clean and distraction-free.
🔔 Smart Alerts: Get notified immediately when Price touches a Resonance Box or when a Squeeze occurs.
3. Visual Guide
A. The Symbols (State Indicators)
You can switch styles in the settings.
B. The Resonance Boxes
Red Box: Resistance Zone (Above Price).
Green Box: Support Zone (Below Price).
Label: E.g., ⚡⚡ 1H Up + D Mid. This tells you exactly which levels are overlapping.
4. Usage Strategy
The "Reversal" Setup: Look for a Green Resonance Box below price with High Confluence (⚡⚡). Ensure the state is NOT Expanding (<^> or 🔥).
The "Breakout" Setup: Look for the Squeeze Symbol (>.< or 🧊) on the dashboard. If price approaches a Resonance Box while Squeezing, expect a breakout.
The "Sniper" Method: Turn on Focus Mode. Set Alerts. Only look at the chart when price hits a "Wall."
How to use: youtu.be
📈 布林带多维共振捕猎者
1. 设计哲学:降维打击
在现代交易中,“信息过载”是最大的敌人。交易者经常在图表上叠加 1H、4H、日线、周线等 15 条以上的布林带线条,导致图表像“盘丝洞”一样难以阅读。
本指标的核心逻辑是“降维打击”与“数据可视化”。 我们不再画出每一条线,而是在后台运行算法来捕捉**“共振”(Confluence)**。
核心理念:单一周期的布林线(如 1H 上轨)很容易被刺破。但是,当多个维度的力量(如 1H 上轨 + 日线中轨 + 周线下轨)在同一个价格水平重叠时,就形成了**“市场合力”**。这些位置才是市场真正的“铜墙铁壁”。
解决方案:系统按价格而非时间对数据进行排序。如果多条线在特定阈值(如 0.15%)内聚集,脚本会画出一个**“共振框”**,而不是无数条混乱的线。
2. 核心功能
🛡️ 全维幽灵监控:无论当前图表周期如何,脚本都会在后台实时监控 1H, 4H, 日线, 周线, 月线 的数据。
⚡ 智能共振雷达:自动检测并合并重叠的关键位。
⚡ (2线共振):值得关注。
⚡⚡ (3线共振):强力支撑/阻力。
⚡⚡⚡ (4线以上):核弹级/铁壁共振。
📊 波动率状态感知:自动识别布林带是处于 挤压蓄势 还是 扩张爆发 阶段。
风格切换:支持 图标模式 (🧊/🔥) 或 极客符号模式 (>.< / <^>)。
🧘 专注模式 (Focus Mode):一键隐藏所有单线,只保留共振框和仪表盘。让您的图表瞬间清空,像狙击手一样只关注目标。
🔔 智能警报:当价格触及共振框,或出现极度压缩信号时,立即发送警报。
3. 视觉指南
A. 状态符号说明
您可以在设置中切换显示风格。
B. 共振框说明
红色方框:上方阻力区 (Resistance)。
绿色方框:下方支撑区 (Support)。
标签示例:⚡⚡ 1H Up + D Mid —— 明确告知您是哪几条线发生了共振。
4. 实战策略
“反转”交易:寻找价格下方的绿色共振框,且具有高星级 (⚡⚡)。前提是当前状态不是扩张状态 (<^> 或 🔥)。
“突破”交易:在仪表盘上看到 挤压符号 (>.< 或 🧊)。如果价格在挤压状态下逼近共振框,不要逆势阻挡,大概率会发生强力突破。
“狙击”模式:开启 专注模式。设置好警报。不要盯着 K 线波动,直到价格撞上“墙壁”触发警报时再介入。
使用说明: youtu.be
Calm before the StormCalm before the Storm - Bollinger Bands Volatility Indicator
What It Does
This indicator identifies and highlights periods of extremely low market volatility by analyzing Bollinger Bands distance. It uses percentile-based analysis to find the "quietest" market periods and highlights them with a gradient background, operating on the premise that low volatility periods often precede significant price movements.
How It Works
Volatility Measurement: Calculates the distance between Bollinger Bands upper and lower boundaries
Percentile Analysis: Analyzes the lowest X% of volatility periods over a configurable lookback period (default: lowest 40% over 200 bars)
Visual Highlighting: Uses gradient opacity to show volatility levels - the lower the volatility, the more opaque the background highlighting
Adaptive Threshold: Automatically calculates what constitutes "low volatility" based on recent market conditions
Who Should Use It
Primary Users:
Breakout Traders: Looking for consolidation periods that may precede significant moves
Options Traders: Seeking low implied volatility periods before volatility expansion
Swing Traders: Identifying accumulation/distribution phases before trend continuation or reversal
Range Traders: Spotting tight trading ranges for mean reversion strategies
Trading Styles:
Volatility-based strategies
Breakout and momentum trading
Options strategies (volatility plays)
Market timing approaches
When to Use It
Market Conditions:
Consolidation Phases: When price is moving sideways with decreasing volatility
Pre-Announcement Periods: Before earnings, economic data, or major events
Market Transitions: During shifts between trending and ranging markets
Low Volume Periods: When institutional participation is reduced
Strategic Applications:
Entry Timing: Wait for volatility compression before positioning for breakouts
Risk Management: Reduce position sizes during highlighted periods (anticipating volatility expansion)
Options Strategy: Sell premium during low volatility, buy during expansion
Multi-Timeframe Analysis: Combine with higher timeframe trends for confluence
Key Benefits
Objective Volatility Measurement: Removes subjectivity from identifying "quiet" markets
Adaptive Analysis: Automatically adjusts to current market conditions
Visual Clarity: Easy-to-interpret gradient highlighting
Customizable Sensitivity: Adjustable percentile thresholds for different trading styles
Best Used In Combination With:
Trend analysis tools
Support/resistance levels
Volume indicators
Momentum oscillators
This indicator is particularly valuable for traders who understand that periods of low volatility are often followed by periods of high volatility, allowing them to position ahead of potential significant price movements.
bollingerBandsLibrary "bollingerBands"
Bollinger bands related functions
get_multiple_bollinger_bands(stdv1, stdv2, stdv3, stdv4, stdv5, stdv6, stdv7, length, source)
Parameters:
stdv1 (int)
stdv2 (int)
stdv3 (int)
stdv4 (int)
stdv5 (int)
stdv6 (int)
stdv7 (int)
length (simple int)
source (float)
get_bb_volatility(bb_highest, bb_lowest, ma_length, lookback)
Parameters:
bb_highest (float)
bb_lowest (float)
ma_length (simple int)
lookback (int)

Coin Bureau BB/EMA/RSI IndicatorThis indicator was inspired by Coin Bureau's How To Spot The Crypto Top video. In the video, Coin Bureau uses Bollinger bands, 7-period EMA and RSI to look for early signs of a top, thus presenting an opportunity to sell.
Using the basic principles found in the video, I've made a tentative indicator as a way to visualise all 3 indicators at once. Alerts will only fire when all 3 criteria are met:
Price closes outside 20-period Bollinger bands
Price closes ~2sd away from 7-period EMA
RSI is overbought or oversold
The indicator will also update in real-time and show when 1, 2 or all 3 conditions are satisfied. Additionally, there is built-in functionality to toggle historical/current alerts and users can set their own bounds for what constitutes a buy or sell alert.
This is just a personal project purely for edutainment purposes and should not be used to make financial decisions. This project is not affiliated with Coin Bureau.
Some caveats:
Using only 7 periods to calculate the standard deviation of price data will not lead to a statistically significant result, thus this figure may have no right being in the script. However, this was more to trial some techniques and to get acquainted with the pine scripting language.
As you can see, there are a lot of false positives. There are moments when the indicator flashes a sell alert only for the price to keep on rising. This is due to the specificity/sensitivity trade-off. The indicator has been tuned to give the optimal sensitivity (the more critical component). These are the best results I could find for this asset in this time frame.

[DIP] Inverse BB HighlightThis indicator allows you to highlight the area outside of the Bollinger Bands in order to draw more attention to it. This is especially useful for those who only trade when we are outside of the bands.
Keep in mind this indicator only works on bars, not on candles.
