Dynamic Zone of Bollinger Band Stops Line [Loxx]Dynamic Zone of Bollinger Band Stops Line is a Bollinger Band indicator with Dynamic Zones. This indicator serves as both a trend indicator and a dynamic stop-loss indicator.
What are Bollinger Bands?
A Bollinger Band is a technical analysis tool defined by a set of trendlines plotted two standard deviations (positively and negatively) away from a simple moving average (SMA) of a security's price, but which can be adjusted to user preferences.
Bollinger Bands were developed and copyrighted by famous technical trader John Bollinger, designed to discover opportunities that give investors a higher probability of properly identifying when an asset is oversold or overbought.
What are Dynamic Zones?
As explained in "Stocks & Commodities V15:7 (306-310): Dynamic Zones by Leo Zamansky, Ph .D., and David Stendahl"
Most indicators use a fixed zone for buy and sell signals. Here’ s a concept based on zones that are responsive to past levels of the indicator.
One approach to active investing employs the use of oscillators to exploit tradable market trends. This investing style follows a very simple form of logic: Enter the market only when an oscillator has moved far above or below traditional trading lev- els. However, these oscillator- driven systems lack the ability to evolve with the market because they use fixed buy and sell zones. Traders typically use one set of buy and sell zones for a bull market and substantially different zones for a bear market. And therein lies the problem.
Once traders begin introducing their market opinions into trading equations, by changing the zones, they negate the system’s mechanical nature. The objective is to have a system automatically define its own buy and sell zones and thereby profitably trade in any market — bull or bear. Dynamic zones offer a solution to the problem of fixed buy and sell zones for any oscillator-driven system.
An indicator’s extreme levels can be quantified using statistical methods. These extreme levels are calculated for a certain period and serve as the buy and sell zones for a trading system. The repetition of this statistical process for every value of the indicator creates values that become the dynamic zones. The zones are calculated in such a way that the probability of the indicator value rising above, or falling below, the dynamic zones is equal to a given probability input set by the trader.
To better understand dynamic zones, let's first describe them mathematically and then explain their use. The dynamic zones definition:
Find V such that:
For dynamic zone buy: P{X <= V}=P1
For dynamic zone sell: P{X >= V}=P2
where P1 and P2 are the probabilities set by the trader, X is the value of the indicator for the selected period and V represents the value of the dynamic zone.
The probability input P1 and P2 can be adjusted by the trader to encompass as much or as little data as the trader would like. The smaller the probability, the fewer data values above and below the dynamic zones. This translates into a wider range between the buy and sell zones. If a 10% probability is used for P1 and P2, only those data values that make up the top 10% and bottom 10% for an indicator are used in the construction of the zones. Of the values, 80% will fall between the two extreme levels. Because dynamic zone levels are penetrated so infrequently, when this happens, traders know that the market has truly moved into overbought or oversold territory.
Calculating the Dynamic Zones
The algorithm for the dynamic zones is a series of steps. First, decide the value of the lookback period t. Next, decide the value of the probability Pbuy for buy zone and value of the probability Psell for the sell zone.
For i=1, to the last lookback period, build the distribution f(x) of the price during the lookback period i. Then find the value Vi1 such that the probability of the price less than or equal to Vi1 during the lookback period i is equal to Pbuy. Find the value Vi2 such that the probability of the price greater or equal to Vi2 during the lookback period i is equal to Psell. The sequence of Vi1 for all periods gives the buy zone. The sequence of Vi2 for all periods gives the sell zone.
In the algorithm description, we have: Build the distribution f(x) of the price during the lookback period i. The distribution here is empirical namely, how many times a given value of x appeared during the lookback period. The problem is to find such x that the probability of a price being greater or equal to x will be equal to a probability selected by the user. Probability is the area under the distribution curve. The task is to find such value of x that the area under the distribution curve to the right of x will be equal to the probability selected by the user. That x is the dynamic zone.
Included
Bar coloring
Signals
Alerts
3 types of signal smoothing
Cerca negli script per "弘历投教boll指标代码分析"

Bollinger Bands + EMA 9A 1 minute scalping strategy.
Uses Bollinger Bands (no basis line) and a 9 period EMA.
Waits for price to close below the lower Bollinger Band and the next candle to close bullish above the lower Bollinger Band but below the 9 Period EMA.
If all conditions are met, the script enters a long position with TP at the 9 Period EMA.

Bollinger Band with Moving Average & Pin BarsThis indicator was specifically built to be used for trading the Scalpius Trading System promoted by @scottphillipstrading. Additionally I've added Daily and Weekly Highs, Lows and Central Pivot lines
The central indicators used in the Scalpius trading system which are included here are: The Bollinger Band, chart plotting of Pin Bars (Hammers & Shooting Stars) and an Exponential Moving Average.
In the settings the user has the option select EMA, SMA or WMA along with desired length, the default settings are 8EMA as per the Scalpius system rules. Also the Bollinger Band settings can be amended by the user and the Pin Bar chart plots and daily + weekly high and low plots can be removed by the user.

Pluto Star - Bollinger Band Trap//DESCRIPTION
//Pluto star appears on a chart when price goes in the in the extreme price range territory, i.e. beyond 2 standard deviation from the mean (or mid Bollinger Band).
//What makes a Pluto Star appear on a chart:
//1. Check if the candle 's' high and low, both are completely outside of the Bollinger Bands (close, 20, 2) - Lets call it Pluto Star Candle
//2. Pluto Star Candle must not be a result of sudden price movement. Hence the previous candle must give a BB Blast.
// In other words, the candle must have it's either open or close outside of Bollinger Bands, to confirm a BB Blast before the Pluto Star
//3. Candle, following the Pluto Star must not break the high (in case of upper BB i.e. short call) or low (in case of lower BB, i.e. long call), to confirm the reversal to the mean
// This implies that Pluto Star appears on chart, above/below the next candle of actual Pluto Star Candle
//----- The above 3 conditions make a Pluto Star appear on a chart. But one must wait for a trade signal. Read the following conditions
//4. There is a signal line, which is nothing but ema(close,5)
//5. The red dotted line is the signal range (and also acts as Stop Loss). The price must close above/below the signal line within the signal range
//6. For a red Pluto Star (short call), the price must close below the signal line, within next 6 candles (signal range). Else there is no trigger for a trade
//7. For a green Pluto Star (long call), the price must close above the signal line, within next 6 candles (signal range). Else there is no trigger for a trade
//8. If any of the candle crosses the Stop Loss line within signal range, there is no trigger for a trade
//9. In a normal scenario, the price must return to the mean, i.e. mid Bollinger Band. In best case scenario, it must go to the opposite side Bollinger Band.
//Recommendation: Test it with Nifty and Bank Nifty charts on 30 mins and 1 hour timeframes

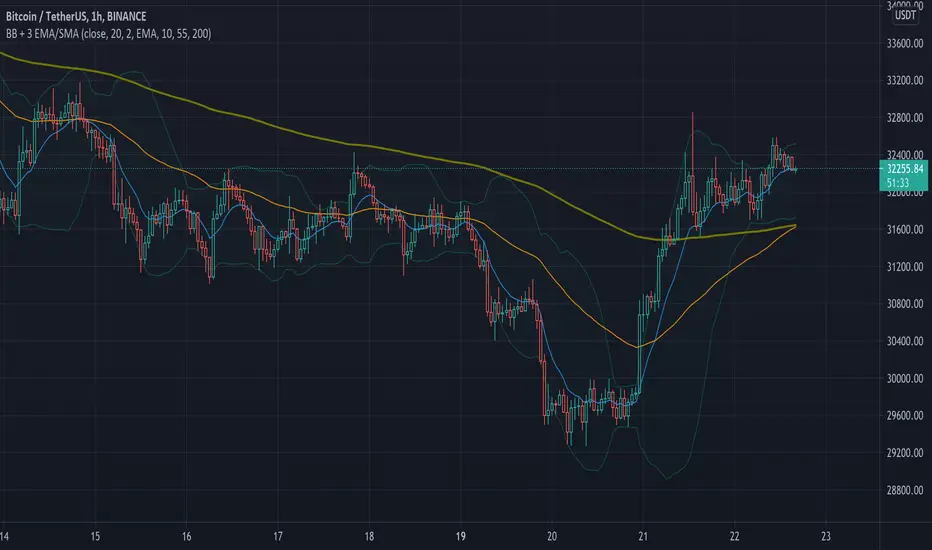
Simple Bollinger Bands + 3 EMAWe know that the number of indicators that we can use is limited, that is why with this indicator the Bollinger Bands + 3 EMAs join and be able to use 4 indicators in 1.
Bollinger Bands (BB)
Bollinger Bands (BB) are a widely popular technical analysis instrument created by John Bollinger in the early 1980’s. Bollinger Bands consist of a band of three lines which are plotted in relation to security prices. The line in the middle is usually a Simple Moving Average (SMA) set to a period of 20 days (the type of trend line and period can be changed by the trader; however a 20 day moving average is by far the most popular). The SMA then serves as a base for the Upper and Lower Bands which are used as a way to measure volatility by observing the relationship between the Bands and price. Typically the Upper and Lower Bands are set to two standard deviations away from the SMA (The Middle Line); however the number of standard deviations can also be adjusted by the trader.
Exponential Moving Average (EMA)
Moving averages visualize the average price of a financial instrument over a specified period of time. However, there are a few different types of moving averages. They typically differ in the way that different data points are weighted or given significance. An Exponential Moving Average (EMA) is very similar to (and is a type of) a weighted moving average. The major difference with the EMA is that old data points never leave the average. To clarify, old data points retain a multiplier (albeit declining to almost nothing) even if they are outside of the selected data series length.
The 3 EMAs that the Script has, are configured as follows:
Fast EMA (purple) 10 periods.
Slow EMA (blue) 55 periods.
Big EMA (olive) 200 periods.
However, you can configure each one with the color and the number of periods you want.
There are other indicators in the Public Library that have similar functions to this Script, but they all do it in a more complex and less friendly way when configuring it, for this reason we wanted to keep this Script as simple as possible.
Bollinger Bands strategy with RSI and MACD v1.0 This is a strategy based on the Bollinger Bands, where buy trades are made when the price crosses the lower line of the Bollinger Bands upwards, and sell trades are made when the price crosses the upper line downwards.
In addition, it is possible through the inputs to enable trading with RSI and MACD, so that buy or sell trades are supported by these two indicators.
Trades are partially and fully closed in the following way, a buy trade will close half of the position when the price touches the middle line of the Bollinger bands and will be fully closed when the price touches the upper band. In the case of a sell position, half of the position will be closed if the price touches the middle band and the entire position will be closed when the price touches the lower band. Alternatively, a fixed take profit can be placed. In case the price moves against us, trailing stops can be placed.
In case of selecting to use RSI, MACD, or MACD variation, trades will be executed as long as The Bollinger Bands, and all the above-mentioned indicators give the same signals, either buy or sell.
For example in the case of selecting only Use RSI, buy trades would be made as long as RSI and BB give buy signals.
Strategy inputs:
-BB source: Bollinger Bands price source.
-Bollinger Bands SMA length: Bollinger Bands simple moving average length.
-Bollinger Bands StdDev length: Bollinger Bands standard deviation length.
-Trail Long Loss (%): Distance in percentage at which the stop loss will initially be placed for buy trades.
-Trail Short Loss (%): Distance in percentage at which the stop loss will be initially placed for sell trades.
-Maximum orders: Maximum of simultaneous operations, for example, if it is 3, up to 3 parallel operations of buy and up to 3 parallel operations of sell will be carried out.
-Position size: Number of contracts per trade.
-Use RSI: If selected, the strategy will also trade based on oversold or overbought signals provided by the RSI.
-RSI source: RSI price source.
-RSI period: The RSI period to use.
-RSI value for buy: If the RSI is below this value, it will give a buy signal.
-RSI value for sell: If the RSI value is above this value, it will give a sell signal.
-Use MACD: If selected, buy trades will be made when the MACD crosses 0 upwards, and sell trades will be made when the MACD crosses 0 downwards.
-Use MACD variation: Only available if MACD is previously selected. In this case, buy trades are made if the MACD value in the last 3 candles has been decreasing, and sell trades are made if the MACD value has been increasing.
-MACD source: MACD price source.
-MACD fast length: MACD fast EMA lenght.
-MACD slow length: MACD slow EMA lenght.
-MACD signal length: MACD signal EMA lenght.
-Use maximum TP long: If selected, a fixed take profit will be placed for buy trades. The position could be closed before reaching this take profit if the price touches one of the lower or upper lines first.
-Maximum take profit long (%): Distance in percentage at which the take profit will be placed for buy trades.
-Use maximum TP short: if selected, a fixed take profit will be placed for sell trades. The position could be closed before reaching this take profit if the price touches one of the lower or upper lines first.
-Maximum take profit short (%): Distance in percentage at which the take profit will be set for sell trades.
I hope you like it and as always all feedback is welcome.

Asynchronous Bollinger Bands - Async BBThis indicator allows you to draw Bollinger bands using higher timeframes.
Note: The timer of your Bollinger Bands must be a multiple of the current chart of the chart.
For example: If your chart is 4 h and you set the sync value to 3, the Bollinger Bands will be drawn with a 12H time frame. 3 * 4H = 12
If the sync is equal to 1, normal Bollinger bands are drawn and will be no different from the normal Bollinger band .
Using this indicator may be appropriate for fractal perspectives.

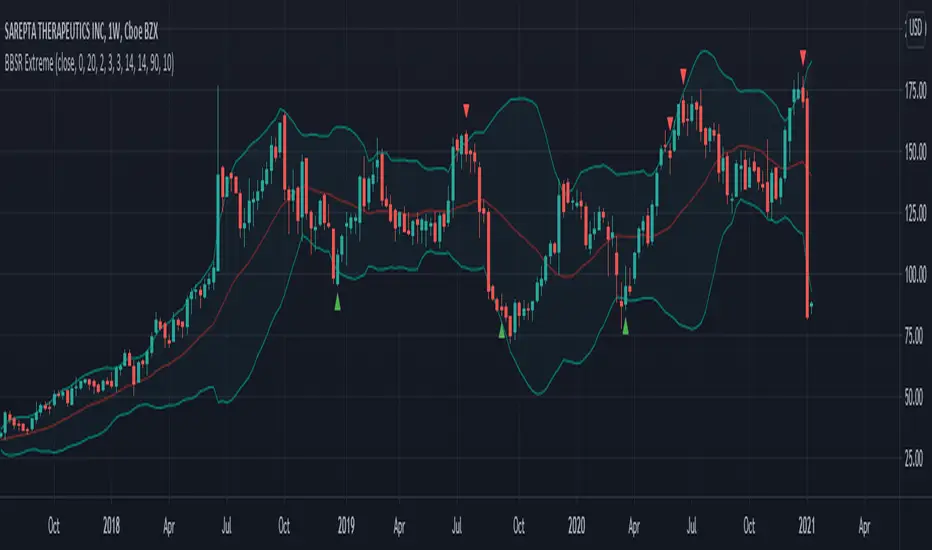
Bollinger Bands Stochastic RSI Extreme SignalThis is the finalized code released to the public that I created in a video linked here.
This indicators combines a Bollinger Band and Stochastic RSI to produce signals for possible price reversal. The signals are displayed by default as green arrows for bullish and red arrows for bearish.
To trigger a signal the indicator checks for the following:
(Bullish)
A candle closes above the upper Bollinger Band
The following candle closes within the upper Bollinger Band
The RSI Stochastic is below the set threshold (10 by default)
(Bearish)
A candle closes below the lower Bollinger Band
The following candle closes within the lower Bollinger Band
The RSI Stochastic is above the set threshold (90 by default)
Bollinger + RSI, Double Strategy Long-Only (by ChartArt) v1.2This strategy uses the RSI indicator together with the Bollinger Bands to go long when the price is below the lower Bollinger Band (and to close the long trade when this value is above the upper Bollinger band).
This simple strategy only places a long, when both the RSI and the Bollinger Bands indicators are at the same time in a oversold condition.
In this new version 1.2 the strategy was simplified even more than before by going long-only, which made the strategy more successful in backtesting than the previous version (that older version also opened short trades).
This strategy does not repaint and was updated to PineScript version 3.
All trading involves high risk; past performance is not necessarily indicative of future results. Hypothetical or simulated performance results have certain inherent limitations. Unlike an actual performance record, simulated results do not represent actual trading. Also, since the trades have not actually been executed, the results may have under- or over-compensated for the impact, if any, of certain market factors, such as lack of liquidity. Simulated trading programs in general are also subject to the fact that they are designed with the benefit of hindsight. No representation is being made that any account will or is likely to achieve profits or losses similar to those shown.
P.S. For advanced users: If you want also be able to short with the same strategy approach, then please use my older version 1.1:

Bollinger + RSI, Double Strategy (by ChartArt)Bollinger Bands + RSI, Double Strategy
This strategy uses a slower RSI with period 16 to sell when the RSI increases over the value of 55 (or to buy when the value falls below 45), with the classic Bollinger Bands strategy to sell when the price is above the upper Bollinger Band and falls below it (and to buy when the price is below the lower band and rises above it). This strategy only triggers when both the RSI and the Bollinger Bands indicators are at the same time in the described overbought or oversold condition. In addition there are color alerts which can be deactivated.
This basic strategy is based upon the "RSI Strategy" and "Bollinger Bands Strategy" which were created by Tradingview and uses no money management like a trailing stop loss and no scalping methods. Every win/loss trade is simply counted from the last overbought/oversold condition to the next one.
This strategy does not use close prices from higher-time frame and should not repaint after the current candle has closed. It might repaint like every Tradingview indicator while the current candle hasn't closed.
All trading involves high risk; past performance is not necessarily indicative of future results. Hypothetical or simulated performance results have certain inherent limitations. Unlike an actual performance record, simulated results do not represent actual trading. Also, since the trades have not actually been executed, the results may have under- or over-compensated for the impact, if any, of certain market factors, such as lack of liquidity. Simulated trading programs in general are also subject to the fact that they are designed with the benefit of hindsight. No representation is being made that any account will or is likely to achieve profits or losses similar to those shown.

Welford Bollinger Bands (WBB)The Welford method is an algorithm for calculating the running average and variance of a series of numbers in a single pass, without the need to store all the previous values. It works by maintaining an ongoing running average and variance, updating them with each new value in the series. The running average is updated using a simple formula that adds the new value to the previous average, weighed by the number of values that have been processed so far. The variance is updated using a similar formula that takes into account the deviation of the new value from the running average.
The Welford method has several advantages that make it a good fit for use in calculating Bollinger Bands. First, it is more numerically stable than other methods, as it avoids accumulating round-off errors and can handle large numbers of data points without overflow or underflow. This is important when working with financial data, which can contain large price movements and wide ranges of values.
Second, the Welford method is well-suited for use in real-time or streaming data scenarios where all the data may not be available upfront. This is useful in the context of Bollinger Bands, which are often used to identify trend changes and trading opportunities in real-time, as the bands are updated with each new data point.
Finally, the Welford method is simple and efficient, making it easy to implement and fast to compute. This is important when creating technical indicators and trading strategies, as performance is often a critical factor.
Overall, the Welford method is a reliable and efficient way to calculate the running average and variance of a series of numbers, making it a good fit for use in calculating Bollinger Bands and other technical indicators.

Bollinger Band strategy with split, limit, stopEntering a short position after breaking the upper Bollinger Band, entering a long position when entering after breaking the lower Bollinger Band
Provides templates for how to display position average price, stop loss, and profit price using the plot function on the chart, and how to buy splits
After entering the position, if the price crosses the mid-band line, the stop loss is adjusted to the mid-band line.

Bollinger Bands and RSI Short Selling (by Coinrule)The Bollinger Bands are among the most famous and widely used indicators. A Bollinger Band is a technical analysis tool defined by a set of trendlines plotted two standard deviations (positively and negatively) away from a simple moving average ( SMA ) of a security's price, but which can be adjusted to user preferences. They can suggest when an asset is oversold or overbought in the short term, thus provide the best time for buying and selling it.
The relative strength index ( RSI ) is a momentum indicator used in technical analysis . RSI measures the speed and magnitude of a security's recent price changes to evaluate overvalued or undervalued conditions in the price of that security. The RSI can do more than point to overbought and oversold securities. It can also indicate securities that may be primed for a trend reversal or corrective pullback in price. It can signal when to buy and sell. Traditionally, an RSI reading of 70 or above indicates an overbought situation. A reading of 30 or below indicates an oversold condition.
The short order is placed on assets that present strong momentum when it's more likely that it is about to decrease further. The rule strategy places and closes the order when the following conditions are met:
ENTRY
The closing price is greater than the upper standard deviation of the Bollinger Bands
The RSI is less than 70
EXIT
The trade is closed in profit when the RSI is less than 70
Upper standard deviation of the Bollinger Band is greater than the the closing price.
This strategy comes with a stop loss and a take profit, and as you can see by the results, it is well suited for a bear market.
This trade works very well with ETH (1h timeframe), AVA (4h timeframe), and SOL (3h timeframe) and is backtested from the 1 December 2021 to capture how this strategy would perform in a bear market.
To make the results more realistic, the strategy assumes each order to trade 30% of the available capital. A trading fee of 0.1% is taken into account. The fee is aligned to the base fee applied on Binance, which is the largest cryptocurrency exchange.

Bollinger Band Clouds [vnhilton]I recommend to turn off 'Labels on price scale' & 'Values in status line' as this indicator's intended use is for visualizing volatility in the form of overextensions & pullbacks only.
Default settings for intraday use - however you can change various settings for your personal use.
Bollinger bands is a volatility indicator which plots X standard deviation bands away from the base moving average. When price isn't volatile, bands are compressed (closer to base moving average), & expand when volatility starts to increase - this makes Bollinger bands a great visual indicator for displaying volatility cycles. Although prices aren't normally distributed (i.e. 2 standard deviation bands won't mean 95% of price will lie within the bands), Bollinger bands can be useful to show strong abnormal trends when price is outside the bands, which can be seen as overextensions & will have to retrace sooner or later, towards the moving averages. Price trends within bands are seen as healthy trends (price grinds fit this description).
This indicator creates clouds (fill) between 2 different moving average standard deviation bands. The idea is to better visualize strong trends/overextensions as the shorter period standard deviation bands will be outside the longer period bands. This indicator also provides bar color changes for when the bar close is outside the longer period standard deviation bands to help illustrate the strong trends/overextensions. The chart snapshot image shows standard deviation clouds for a 10-20 period SMA. This indicator also allows for better visualization on pullbacks to the mean, by giving a MA cloud between the 2 short & long period MAs.
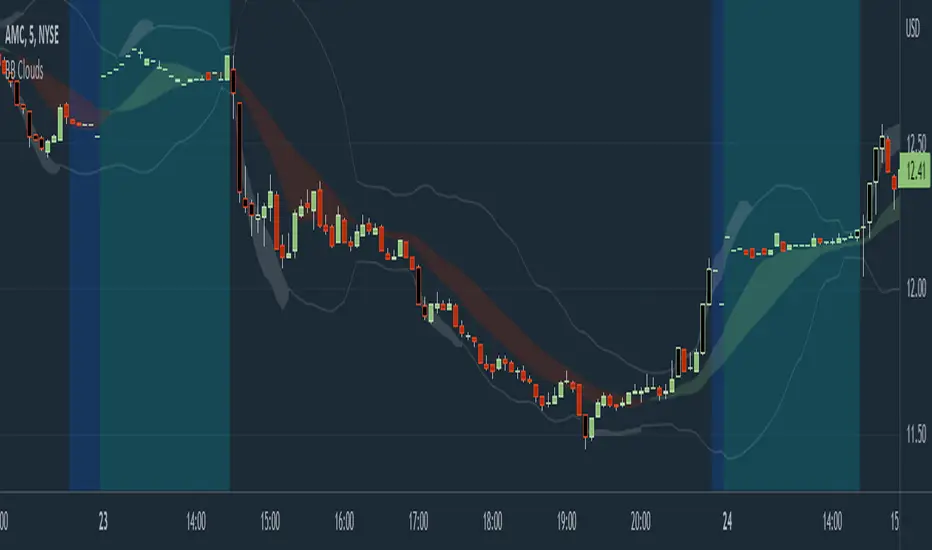
Bollinger CloudsThis indicator plots Bollinger Bands for your current timeframe (e.g 5 minutes) and also plots the Bollinger Bands for a higher timeframe (15 minutes for 5 minute timeframe). Then the gaps between the current and higher timeframe upper and lower bands is filled to create clouds which can be used as entry zones. Like Bollinger Bands, this indicator shouldn't be solely used for entries, use it in conjunction with other indicators.
Bollinger Band Timeframes
Current / Higher
1 minute / 5 minutes
3 minutes / 10 minutes
5 minutes / 15 minutes
10 minutes / 30 minutes
15 minutes / 1 hour
30 minutes / 2 hours
45 minutes / 1.5 hours
1 hour / 4 hours
2 hours / 8 hours
2.5 hours / 10 hours
4 hours / 1 Day
1 Day / 3 Days
3 Days / 9 Days
5 Days / 2 Weeks
1 Week / 1 Month

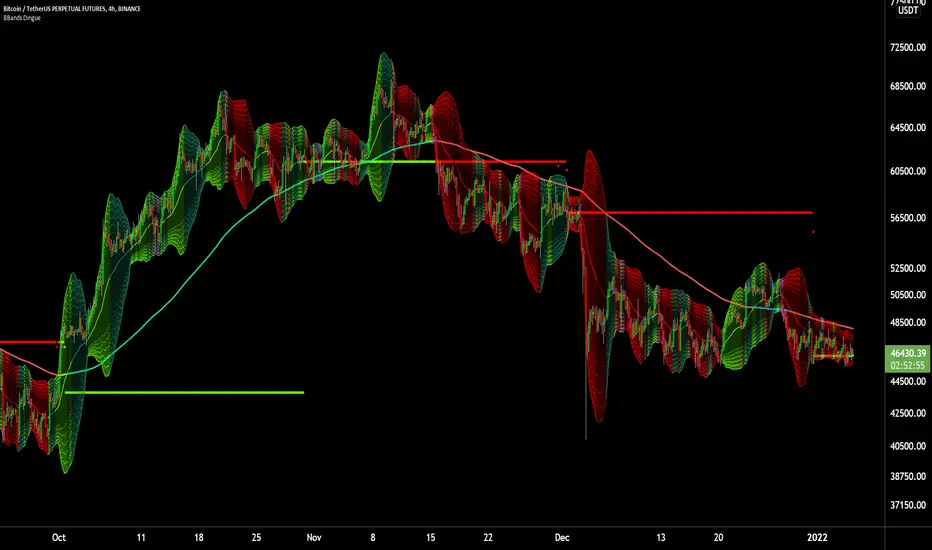
6X Bollinger Bands + MA + VWAP Dingue V56X Bollinger Bands Dingue V5 - This is the updated version for Pine Script 5
This indicator lets you quickly see all the intricacies of the Bollinger Bands; it simplifies its usage and maximizes the results.
Color-coded if the price is above or under the middle and based on direction.
Color-coded for expansion and contraction of the bands.
Option to plot ‘Squeezed bands’. It will show above the bands when they become smaller than the setting chosen. This helps identify build-up that might explode one way or another.
- 6x independent Bands can be adjusted as you want. It gives you possibilities in how you see variance, trends, support and resistance.
You can also select the MA type: SMA EMA WMA VWAM FRAMA … to explore new ways to see the Bollinger bands.
New in this version, you can now add a separate ‘Long MA’ that you can select independently from the Bands. Ex. Plot 200 SMA This helps in building a strategy with the trend and the bands.
Like the MA above, you can also plot 2 different VWAP independently from the Bands. This also helps knowing where the price stands compared to the bigger time frame VWAP’s price.
'Tool tips' explain other settings, if you have any questions, feel free to ask in the comments below.
Thank you for the feedback and check all my ‘Dingue’ indicators.
[KL] Double Bollinger Bands Strategy (for Crypto/FOREX)This strategy uses a setup consisting of two Bollinger Bands based on the 20 period 20-SMA +/-
(a) upper/lower bands of two standard deviations apart, and
(b) upper/lower bands of one standard deviation apart.
We consider price at +/- one standard deviation apart from 20-SMA as the "Neutral Zone".
If price closes above Neutral Zone after a period of consolidation, then it's an opportunity for entry. Strategy will long, anticipating for breakout.
The illustration below shows price closing above the Neutral Zone after a period of consolidation.
a.c-dn.net
Position is exited when prices closes at Neutral Zone (being lower than prior bars)

Forex Scalping 1min Bollinger Bands, RSI and ADX Trading SystemThis is a Forex Scalping Trading Sytem based on the Bollinger Bands.
Its suited for major pairs, with lowest possible comission (below 1 pip) and with timeframes ranging between 1-15 min.
Indicators:
Bollinger bands
ADX
RSI
Rules for entry:
Long Entry: price to move below the upper Bollinger Bands RSI raise above the 30 line and ADX<32 at the same time.
Short Entry: price to move above the upper Bollinger Bands, RSI raise below the 70 line and ADX<32 at the same time.
Rules for exit
Profit Exit: 3 options: 1, exit position when the price touches the middle band, 2) when the price touches the opposite band, X pips target profit.
Loss Exit: X pips loss

Bollinger Band + RSI + ADX + MACD + HeikinashiThis script takes into picture Bollinger Bands, RSI with a comparator value, ADX with a comparator value, and MACD with Heikinashi Direction
THIS IS A LONG-ONLY STRATEGY. SHORT TRADES ARE NOT INCLUDED
Strategy:
The Strategy takes a trade only after ALL the following conditions are met.
Candle low is lower than the Bollinger Lower band
RSI is higher than the comparator value
ADX is higher than the comparator value
MACD value is higher than the Signal value
Stop Loss : Max of (Low of the candle - 0.22% and Close of the candle - 0.32%) - FYI, because its max, it's lower of the 2 and your risk is lesser
Target : Max of (Bollinger Band Upper band and 0.75% of the value of underlying) - FYI, it takes the maximum available

Bollinger Bands Bar ColoringThis is a simple script that colors bars/candles based on where price is relative to the basis, and the upper and lower bands of the Bollinger Bands.
If price is above the basis, candles will be colored green, and if price is below the basis, candles will be colored red.
If price is outside of the bands on either side, the candles will be colored a darker shade of either color depending on if it is above or below.
I created this indicator because I like that at a glance I can have an idea of the bullishness or bearishness of price action based on the Bollinger Bands, without actually having the Bands overlayed on my charts.
It's also quite nice because I find that the areas where there is a shift in candle color (especially from green to red and vice versa) aid in identifying levels of support and resistance, and shifts in market structure.
I have another indicator that is a huge modification of the Bollinger Bands %B, which includes the candle coloring (and MAs), but this frees up space on my chart while still providing me with the primary information I'm looking for.

Projected Bollinger Bands - Quadratic RegressionBased on the work of Alex Groove : https://www tradingview com/script/YnoXd2AY-forecasting-quadratic-regression/
and also based on https://www tradingview com/script/YnoXd2AY-forecasting-quadratic-regression/ by capissimo
Notes:
1. This Bollinger Bands uses the QREG as its middle line (not MA as the original Bollinger Bands) so this should be acknowledged.
2. This indicator forecasts 3 candles (periods) ahead.
3. The label's position is quite messy, so you need to adjust the chart zoom in order to make the indicator doesn't overlap anything.
4. You need to manually set the time frame in the indicator settings because i'm not able to make the indicator recognizes it automatically
I'm trying to make the Bollinger Bands Forecasting from Quadratic Regression, and i'm really sure that there are a lot of mistakes here and there, so i 'm hoping corrections coming from you guys...
CHEERS!!!

EMA (10,20,60) + Bollinger BandsCombination of bollinger bands and exponential moving averages (10, 20, 60)
The coloring is optimized for dark background, and it is editable
This indicator combined 3 exponential moving average lines and bollinger bands . The EMA lines can be add or deleted in pine editor, and its parameters can be changed too. Same to the bollinger bands . Defaulted value for BB is 20SMA with 2 standard deviations.
Useful as a supplmentary indicators

3Commas Bollinger StrategyThis strategy is intended for use as a way of backtesting various parameters available on 3commas.io composite bot using a bollinger band type trading strategy. While it's primary intention is to provide users a way of backtesting bot parameters, it can also be used to trigger a deal start by either using the {{strategy.open.alert_message}} field in your alert and providing the bot details in the configuration screen for the strategy or by including the usual deal start message provided by 3commas. You can find more information about how to do this from help.3commas.io
The primary inputs for the strategy are:
// USER INPUTS
Short MA Window - The length of the Short moving average
Long MA Window - The length of the Long moving average
Upper Band Offset - The offset to use for the upper bollinger offset
Lower Band Offset - The offset to use for the lower bollinger offset
Long Stop Loss % - The stop loss percentage to test
Long Take Profit % - The Take profit percentage to test
Initial SO Deviation % - The price deviation percentage required to place to first safety order
Safety Order Vol Step % - The volume scale to test
3Commas Bot ID - (self explanatory)
Bot Email Token - Found in the deal start message for your bot (see link in previous section for details)
3Commas Bot Trading Pair - The pair to include for composite bot start deals (should match format of 3commas, not TradingView IE. USDT_BTC not BTCUSDT)
Start Date, Month, Year and End Date, Month and Year all apply to the backtesting window. By default it will use as much data as it can given the current period select (there is less historical data available for periods below 1H) back as far as 2016 (there appears to be no historical data on Trading view much before this). If you would like to test a different period of time, just change these values accordingly.
Known Issues
Currently there are a couple of issues with this strategy that you should be aware of. I may fix them at some point in the future but they don't really bug me so this is more for informational purposes than a promise that they may one day be fixed.
Does not test trailing take profit
Number of safety orders and Safety Order Step Scale are currently not user configurable (must edit source code)
Using the user configuration to generate deal start message assumes you are triggering a composite bot, not a simple bot.
