Cerca negli script per "情绪指数板块+约200只股票+选股规则"

50, 100, 200 EMAsA simple script that displays the 50, 100, and 200-period exponential moving averages. Reduce clutter by combining them into one indicator!

50, 100, 200 SMAsA simple script that displays the 50, 100, and 200-period simple moving averages. Reduce clutter by combining them into one indicator!

50,100,200 MA by CryptoLife71(FIXED)Updated the code by CryptoLife71 so that the 200ma shows correctly.

Dieyson daytrade EMA 9+20+200+VWAP and bar & line colorDieyson daytrade EMA 9 + EMA20 + EMA 200 + VWAP


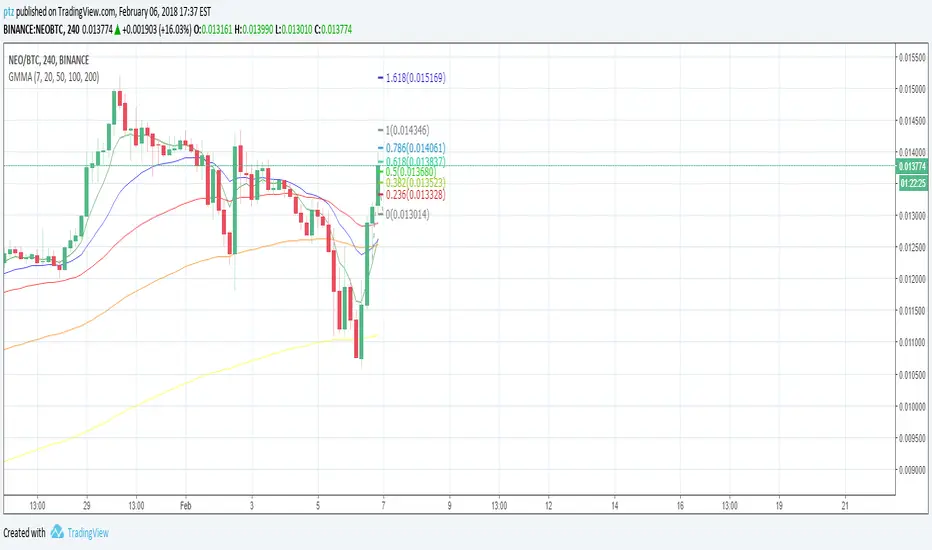
MA Cross 50/200 - Moving Averageindicates short-term 50-day moving average AND long-term 200-day moving average CROSS
@GateTicker


DECL: 3 X Moving Average (50, 100 and 200 day)Basic Moving Average with 3 different intervals. Default: 50 day (blue), 100 day (red) and 200 day (purple)


MACD + SMA 200 Strategy (by ChartArt)Here is a combination of the classic MACD (moving average convergence divergence indicator) with the classic slow moving average SMA with period 200 together as a strategy.
This strategy goes long if the MACD histogram and the MACD momentum are both above zero and the fast MACD moving average is above the slow MACD moving average. As additional long filter the recent price has to be above the SMA 200. If the inverse logic is true, the strategy goes short. For the worst case there is a max intraday equity loss of 50% filter.
Save another $999 bucks with my free strategy.
This strategy works in the backtest on the daily chart of Bitcoin, as well as on the S&P 500 and the Dow Jones Industrial Average daily charts. Current performance as of November 30, 2015 on the SPX500 CFD daily is percent profitable: 68% since the year 1970 with a profit factor of 6.4. Current performance as of November 30, 2015 on the DOWI index daily is percent profitable: 51% since the year 1915 with a profit factor of 10.8.
All trading involves high risk; past performance is not necessarily indicative of future results. Hypothetical or simulated performance results have certain inherent limitations. Unlike an actual performance record, simulated results do not represent actual trading. Also, since the trades have not actually been executed, the results may have under- or over-compensated for the impact, if any, of certain market factors, such as lack of liquidity. Simulated trading programs in general are also subject to the fact that they are designed with the benefit of hindsight. No representation is being made that any account will or is likely to achieve profits or losses similar to those shown.


LONG TERM INVESTMENT TECHNICAL STRATEGY SCRIPT200 - WEEKLY MOVING AVERAGE
GREEN LINE IS 200 WEEKS MOVING AVERAGE OF CLOSE
BLUE LINE IS 200 WEEKS MOVING AVERAGE OF LOW MULTIPLIED BY 0.90
RED LINE IS 100 WEEKS MOVING AVERAGE OF CLOSE
CONDITION: GREEN LINE SHOULD BE ABOVE RED LINE AND PRICE SHOULD BE ABOVE GREEN LINE
BUY ONCE THE PRICE IS ABOVE GREEN LINE AND FULFILLS THE CONDITION.
TARGET 1 FOR TIME FRAME 1 YEAR= 2 X GREEN LINE VALUE WHEN PRICE CROSSED IT
TARGET 2 FOR TIME FRAME 3 YEARS= 3 X GREEN LINE VALUE WHEN PRICE CROSSED IT
TARGET 3 FOR TIME FRAME 5 YEARS= 5 X GREEN LINE VALUE WHEN PRICE CROSSED IT
TARGET 4 FOR TIME FRAME 10 YEARS= 10 X GREEN LINE VALUE WHEN PRICE CROSSED IT
STOP LOSS IS TRAILING TO BLUE LINE

200 SMA (5%/-3% Buffer) for SPY & QQQ In my testing TQQQ is an absolute monster of an ETF that performs extremely well even from a buy and hold standpoint over long periods of time, its largest drawback is the massive drawdown exposure that it faces which can be easily sidestepped with this strategy.
This strategy is meant to basically abuse TQQQ's insane outperformance while augmenting the typical 200SMA strategy in a way that uses all of its strengths while avoiding getting whipsawed in sideways markets.
The strategy BUYS when price crosses 5% over the 200SMA and then SELLS when price drops 3% below the 200SMA. Between trades I'll be parking my entire account in SGOV.
So maximizing profit while minimizing risk.
You use the strategy based off of QQQ and then make the trades on TQQQ when it tells you to BUY/SELL.
Here are some reasons why I will be using this strategy:
Simple emotionless BUY and SELL signals where I don't care who the president is, what is happening in the world, who is bombing who, who the leadership team is, no attachment to individual companies and diversified across the NASDAQ.
~85% win percentage and when it does lose the loses are nothing compared to the wins and after a loss you're basically set up for a massive win in the next trade.
Max drawdown of around 53% when using TQQQ
You benefit massively when the market is doing well and when there is a recession you basically sit in SGOV for a year and then are set up for a monster recovery with a clear easy BUY signal. So as long as you're patient you win regardless of what happens.
The trades are often very long term resulting in you taking advantage of Long Term Capital Gains tax advantage which could mean saving up to 15-20% in taxes.
With only a few trades you can spend time doing other stuff and don't have to track or pay attention to anything that is happening.
Simple, easy, and massively profitable.

200 Week Moving Average HeatmapСolors part of the SMA depending on the change in % (delta %) to the previous value. From blue(none to low increase) through green(moderate increase) to red(high increase).

200/150
This a variation to my 120/60 Trend Model for the daily chart on Bitcoin, which has quite reliably been determining the over all trend as well as low risk entries within a longer term trend. It's a combination of 150 & 220 SMA, used on the 1D chart. Once price closes below both SMAs trend is an early bearish signal, while the SMAs flipping to red is later but more reliable bearish signal. For bullish trend it is the same thing just the opposite. Once the "cloud" switches red trend is bearish while once it switches green it's bullish.
Bitcoin tends to get rejected by the cloud during bullish and bearish trends. Once Bitcoin pushes through the cloud the trend will typically reverse.
Bitcoin trading within or close to the cloud is generally a good long or short entries, depending on the color of the cloud (red: short & green: long).
