RSI Overlay Table - 30 Tickers Sorted with ColorOverview
The RSI Overlay Table script provides traders with a powerful tool to monitor the Relative Strength Index (RSI) across multiple tickers in real-time. This script enables users to keep track of up to 30 different assets simultaneously, displaying their RSI values in an easy-to-read table format directly on the chart. It helps traders identify overbought and oversold conditions quickly, enhancing their ability to make informed trading decisions.
Key Features
Monitor Multiple Tickers: Track the RSI values of up to 30 different tickers at once. This allows users to have a broad view of market conditions across various assets without the need to switch between charts.
Dynamic RSI Calculations: The script calculates the RSI using the user-defined length, providing flexibility to adjust sensitivity based on the trading strategy. The default RSI length is set to 14, a commonly used period in technical analysis.
Customizable Overbought and Oversold Levels: Users can define their own overbought and oversold RSI levels, allowing them to tailor the script to their trading style. By default, the overbought level is set at 70, and the oversold level is set at 30.
Hide Neutral Rows Option: To help traders focus on the most critical signals, the script includes an option to hide rows where the RSI values are neither overbought nor oversold. This feature helps traders concentrate on assets that are more likely to experience a price reversal.
Color-Coded Alerts: The script highlights overbought and oversold conditions with distinct colors:
Red: Indicates that the asset is overbought (RSI above the user-defined overbought level).
Green: Indicates that the asset is oversold (RSI below the user-defined oversold level).
How to Use the RSI Overlay Table Script
Input Tickers: Enter up to 30 ticker symbols in the script settings. The script will automatically fetch the RSI values for each ticker and display them in the overlay table on the chart.
Adjust RSI Settings: Modify the RSI length and the overbought/oversold levels according to your trading strategy. These settings can be adjusted in the script input panel.
Use the Hide Neutral Rows Option: Toggle the “Hide Neutral Rows” option to focus only on tickers that are in overbought or oversold conditions. This feature is useful for traders who wish to filter out less significant signals and only act on strong RSI indicators.
Interpret the Table: The table will display each ticker symbol alongside its current RSI value. Tickers with RSI values above the overbought level will be highlighted in red, suggesting a potential sell signal. Tickers with RSI values below the oversold level will be highlighted in green, indicating a potential buy signal.
Application and Strategy
The RSI Overlay Table script is designed for traders who manage multiple assets and need to monitor their technical indicators efficiently. It is particularly useful for:
Swing Traders: Identifying overbought and oversold conditions to time entries and exits.
Portfolio Managers: Monitoring the relative strength of various assets in a portfolio.
Scalpers: Quickly spotting extreme price movements across multiple assets.
Notes
This script is intended to be used as a supplementary tool for technical analysis. Always use it in conjunction with other indicators and market analysis techniques.
The RSI values and signals provided by this script should not be taken as financial advice.
The RSI Overlay Table script provides a clear and efficient way to track RSI values across multiple assets, helping traders make more informed decisions. By offering customizable settings and a clean, color-coded interface, this tool aims to enhance the user's trading experience and streamline their analysis process.
Cerca negli script per "欧元汇率走势30天"

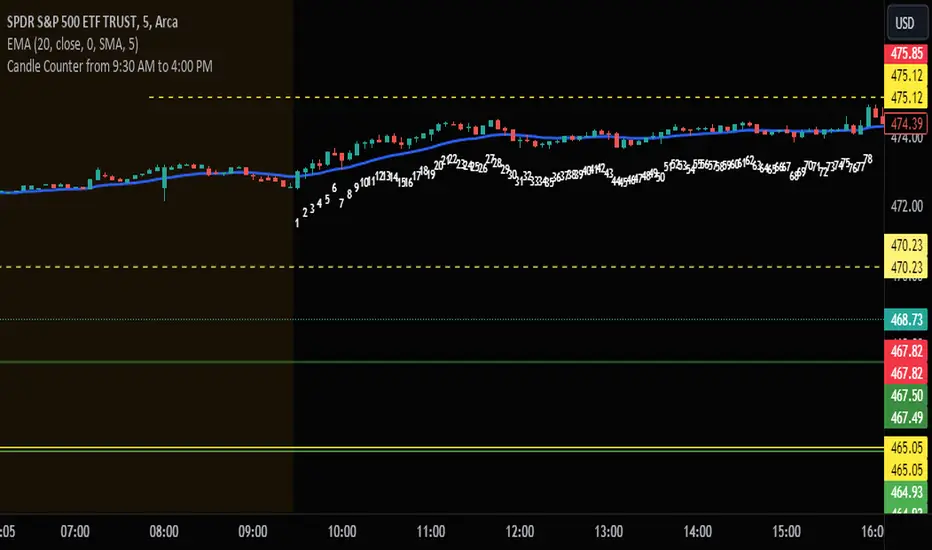
Candle Counter from 9:30 AM to 4:00 PMThis Pine Script, designed for TradingView, serves as a candle counter exclusively for a 5-minute chart. It operates within the specific market hours of 9:30 AM to 4:00 PM. Key features of the script include:
Market Hours Specification: The script is configured to track candles only during the trading hours from 9:30 AM to 4:00 PM.
Daily Reset: Each trading day, the candle counter resets, starting anew from the market opening at 9:30 AM.
Candle Counting: It increments a counter with each 5-minute candle during the specified market hours.
Label Display: The counter number for each candle is displayed as a label at the candle's low point. This label is in bright white color with large font size, ensuring clear visibility against various chart backgrounds.
5-Minute Chart Specificity: The script is tailored to function only when the chart is set to a 5-minute timeframe, making it ideal for traders focusing on intraday movements.
New Day Detection: Utilizes a function to identify the start of a new trading day, ensuring accurate daily counting.
This script is particularly useful for traders who focus on intraday trading within the standard stock market hours, providing a clear and easy-to-read candle count that resets daily.
Vertical Lines at 10:00 & 11:30Sales-Style Description
This script is a simple but powerful TradingView add-on that automatically marks your chart with clear, bold vertical lines at exactly 10:00 AM and 11:30 AM every day. No more manually drawing lines or setting reminders — it does the work for you.
Always on time: It tracks the market clock in real-time and drops a line the moment your chart hits those times.
Clean visibility : The lines are bright blue (#2962FF), solid, and drawn with thickness level 3, so they stand out against any background or chart theme.
Automatic housekeeping: It keeps your workspace clean by automatically deleting old lines once you reach a set limit, so your chart never gets cluttered.
Customizable : You can change the time zone, thickness, and the number of days’ worth of lines to keep.
Set it and forget it: Once added to your chart, it runs quietly in the background — you’ll always know when the 10:00 and 11:30 sessions hit without lifting a finger.

NY 14:30 High/Low - 1mThis indicator automatically draws horizontal lines for the High (green) and Low (red) of the 14:30 (Lisbon) candle on the 1-minute chart.
It is designed for traders who want to quickly identify the New York open levels (NY Open), allowing you to:
Visualize the NY market opening zone.
Use these levels as intraday support or resistance.
Plan entries and exits based on breakouts or pullbacks.
Features:
Works on any 1-minute chart.
Lines are drawn immediately after the 14:30 candle closes.
Lines extend automatically to the right.
Simple and lightweight, no complex variables or external dependencies.
Daily reset, always showing the current day’s levels.
Recommended Use:
Combine with support/resistance zones, order blocks, or fair value gaps.
Monitor price behavior during the NY open to identify breakout or rejection patterns.

M5 Session Rectangles (GMT+2) - Last 30 Sessions Rectangles on the M5 timeframe showing the MAX and MIN of the New York Session:
OPEN SESSION (15:30 - 16:20)
MID SESSION (16:20 - 19:00)
POWER HOUR (19:00 - 22:00)
The indicator tracks the last 30 days, and the rectangle for the current day is drawn only after the respective session closes.

Kassa 30 70 90 Eröffnung
Kassa 30 – Subtle Lines with Offset Labels
This indicator plots horizontal price levels at ±30, ±70, and ±90 points from the market’s opening price (default 09:00).
The lines are displayed in soft gray tones to avoid chart distraction, while the labels are positioned to the left of the lines for a clean, unobstructed view of price action.
Lines extend for 3 hours after market open, making this tool ideal for breakout strategies, scalping setups, and identifying key intraday price zones.

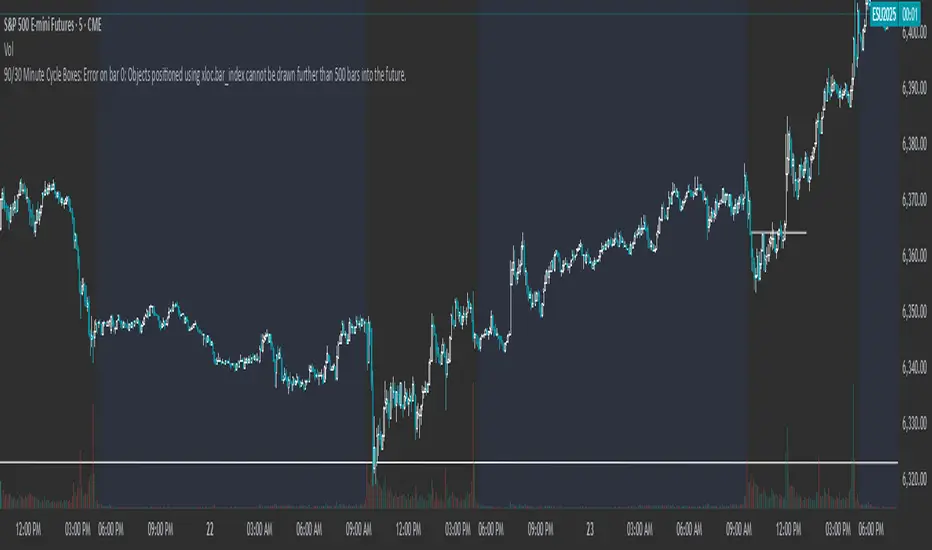
90/30 Minute Cycle BoxesThis indicator automatically draws time-based cycle boxes to help visualize market structure and cyclical behavior.
Features:
90-Minute Primary Cycles: Highlights each 90-minute interval with a colored box, showing the high and low of that period.
30-Minute Sub-Cycles: Each 90-minute box is divided into 3 sub-boxes representing 30-minute phases.
Multi-Timeframe Compatible: Works on all timeframes, adapting dynamically to your chart.
Visual Clarity: Alternating box colors make it easy to track price action within and across cycles.
This tool is ideal for traders who use time cycles in their analysis, especially those applying ICT, Smart Money Concepts, or time-based market theories.
3SMA +30 Stan Weinstein +200WMA +alert-crossingIndicator Description: Stan Weinstein Strategy + Key Moving Averages
🔹 Introduction
This indicator combines the Classic Stan Weinstein Strategy with a modern update based on the author’s latest recommendations. It includes key moving averages that help identify trends and potential entry or exit points in the market.
📊 Included Moving Averages (Fully Customizable)
All moving averages in this indicator have modifiable parameters, allowing users to adjust values in the input settings.
1️⃣ 30-Week SMA (Stan Weinstein): A long-term trend indicator defining the asset’s main trend.
2️⃣ 40-Week SMA (Weinstein Update): An adjusted version recommended by the author in his recent updates.
3️⃣ 10-Day SMA: Displays short-term price action and helps confirm trend changes.
4️⃣ 100-Day SMA: A medium-term trend measure used by traders to assess trend strength.
5️⃣ 200-Day WMA (Weighted Moving Average): A very long-term indicator that filters market noise and confirms solid trends.
🔍 How to Interpret It
✔️ 30/40-Week SMA in an uptrend → Confirms an accumulation phase or an upward price trend.
✔️ Price above the 200-WMA → Indicates a strong and healthy long-term trend.
✔️ 10-SMA crossing other moving averages → Can signal an early entry or exit opportunity.
✔️ 100-SMA vs. 200-WMA → A breakout of the 100-SMA above the 200-WMA may signal a new bullish phase.
🚨 Built-in Alerts (Key Crossovers)
The indicator includes automatic alerts to notify traders when key moving averages cross, allowing timely reactions:
🔔 10-SMA crossing the 40-SMA → Possible medium-term trend shift.
🔔 10-SMA crossing the 200-WMA → Confirmation of a stronger trend.
🔔 40-SMA crossing the 200-WMA → Long-term trend reversal signal.
💡 Customization: All moving average periods can be adjusted in the input settings, making the indicator flexible for different trading strategies.

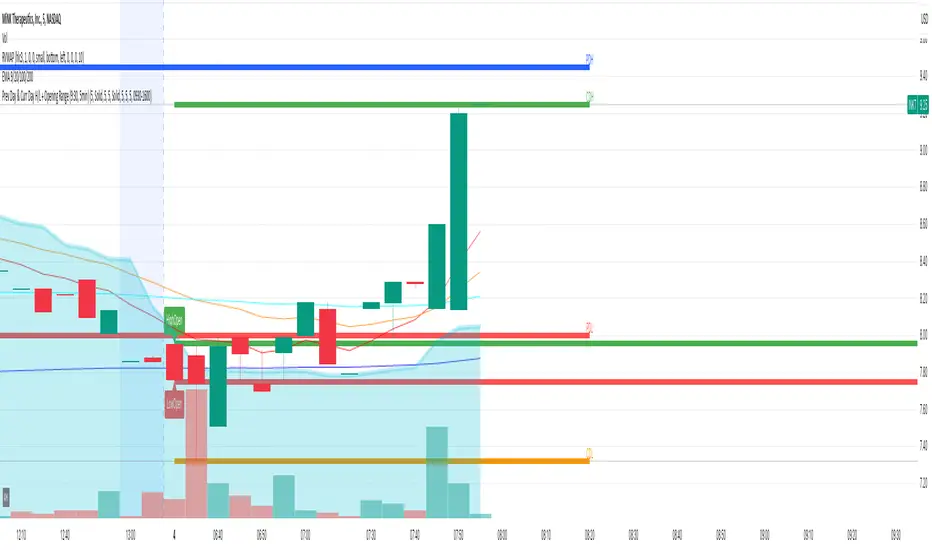
Prev Day & Curr Day H/L + Opening Range (9:30, 5min)Script Description:
This TradingView Pine Script is designed for use on a 5‑minute chart and plots key price levels for daily trading analysis. It automatically draws:
• Previous Day High/Low Lines:
These lines mark the previous day’s regular trading hours (RTH) high and low levels, with labels (“PDH” and “PDL”) for easy identification.
• Current Day High/Low Lines:
As the trading day progresses, the script updates and displays the current day’s RTH high and low levels, labeled as “CDH” and “CDL”.
• Opening Range for 9:30 AM:
The script specifically identifies the first 5‑minute candle at 9:30 AM (using the “America/New_York” time zone) and draws two additional lines at its high and low. These lines are labeled “HighOpen” and “LowOpen” to indicate the opening range.
All lines are drawn with a width of 5 and have configurable colors, styles, and extension lengths. The script automatically resets at the start of each new day, ensuring that the plotted levels are current and relevant for daily trading decisions.
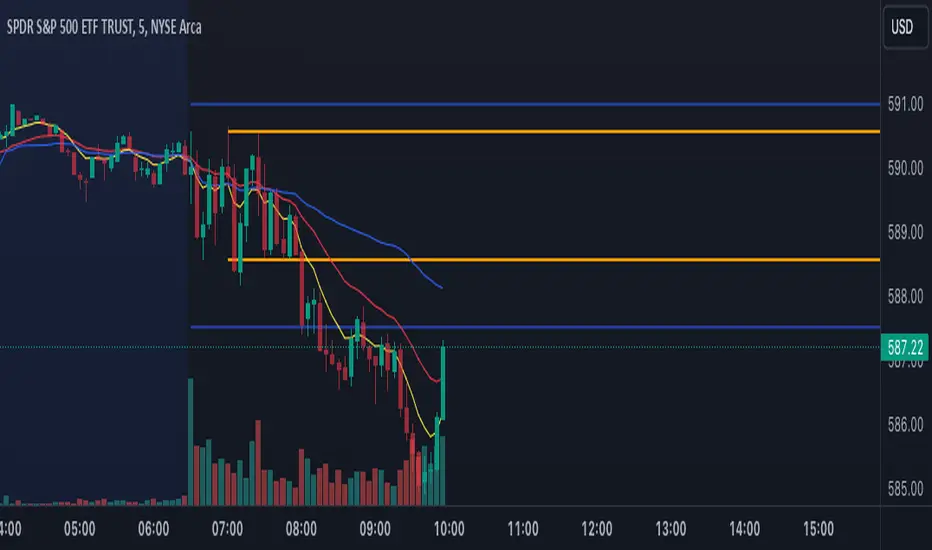
Premarket and Opening Range (First 30 minutes) LevelsThis indicator is for people who like to utilize the pre-market highs and pre-market Low's as well as the first 30 minutes high and low, or some people like to call the opening range. I hope you find value in this. Note, the levels will only appear after tracking. Premarket levels will happen after pre-market closes. Opening Range levels will show right after the first 30 minutes.
US 30 Daily Breakout Strategy The US 30 Daily Breakout Strategy (Single Trade Per Breakout/Breakdown) is a trading approach for the US 30 (Dow Jones Industrial Average) that aims to capture breakout or breakdown moves based on the previous day’s high and low levels. The strategy includes mechanisms to take only one trade per breakout (or breakdown) each day and ensures that each trade is executed only when no other trade is open.
Entry Conditions:
Long Trade (Breakout): The strategy initiates a long position if the current candle closes above the previous day's high, indicating an upward breakout. Only one breakout trade can occur per day, regardless of whether the price remains above the previous high.
Short Trade (Breakdown): The strategy initiates a short position if the current candle closes below the previous day's low, indicating a downward breakdown. Similarly, only one breakdown trade can occur per day.
Risk Management:
Take Profit and Stop Loss: Each trade has a take profit and stop loss of 50 points, aiming to cap profit and limit loss effectively for each position.
Daily Reset Mechanism:
At the start of each new day (based on New York time), the strategy resets its flags, allowing it to look for new breakout or breakdown trades. This reset ensures that only one trade can be taken per breakout or breakdown level each day.
Execution Logic
Flags for Trade Limitation: Flags (breakout_traded and breakdown_traded) are used to ensure only one breakout or breakdown trade is taken per day. These flags reset daily.
Dynamic Plotting: The previous day’s high and low are plotted on the chart, providing a visual reference for potential breakout or breakdown levels.
Overall Objective
This strategy is designed to capture single-directional daily moves by identifying significant breakouts or breakdowns beyond the previous day’s range. The fixed profit and loss limits ensure the trades are managed with controlled risk, while the daily reset feature prevents overtrading and limits each trade opportunity to one breakout and one breakdown attempt per day.

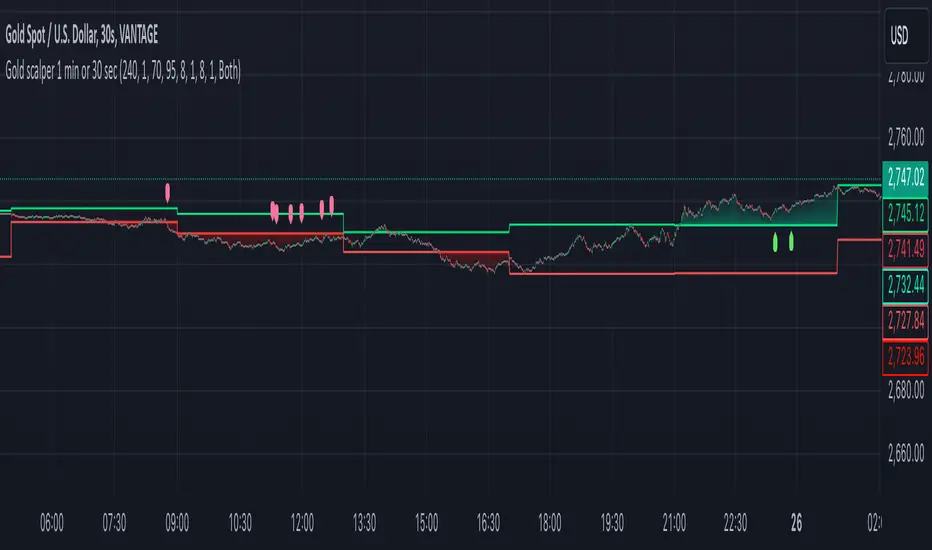
Gold scalper 1 min or 30 secThis Pine Script code for TradingView is designed to create a trading indicator titled "Gold scalper 1 min or 30 sec." The indicator is primarily used for scalping gold and is focused on short-term timeframes (1 minute or 30 seconds).
### Key Components of the Code:
1. **Inputs:**
- **Resolution:** Users can set the timeframe for analysis (default is 240 minutes).
- **SMA (Simple Moving Average):** Users can specify the period for the SMA used in the calculations.
2. **Daily Highs and Lows:**
- The script calculates the previous day’s high (`yesterdayHigh`) and low (`yesterdayLow`) prices using the `request.security` function.
3. **SMA Calculation:**
- An SMA is computed based on the closing prices of the selected timeframe.
4. **Breakout Conditions:**
- The script detects breakouts using the SMA in relation to yesterday's high and low:
- A breakout upwards occurs when the SMA crosses above the previous day's high.
- A breakout downwards occurs when the SMA crosses below the previous day's low.
5. **RSI (Relative Strength Index) Calculations:**
- Two RSI values are calculated to assess market momentum:
- **Banker RSI:** Used for buy conditions.
- **Hot Money RSI:** Used for sell conditions.
- These include adjustable sensitivity factors and periods to customize the indicator’s sensitivity.
6. **Trade Direction Selection:**
- Users can select whether to trade long, short, or both directions.
7. **Buy and Sell Signals:**
- Buy conditions are set when the Retail Moving Average crosses the Banker Moving Average under certain conditions.
- Sell conditions are marked when the Banker Moving Average crosses under the specified sell threshold.
- These signals are visually represented on the chart with specific shapes (up arrows for buys and down arrows for sells).
8. **Alerts:**
- Alerts are generated for buy and sell signals to notify users when certain conditions are met.
9. **Trend Visualization:**
- The script visually indicates uptrends and downtrends on the chart by plotting colors based on the relationship between the current price, yesterday's high, and low.
### General Purpose:
This indicator is designed to assist traders in identifying potential buying and selling opportunities in the gold market based on short-term price movements and momentum indicators, helping them capitalize on quick price fluctuations that are characteristic of scalping strategies.
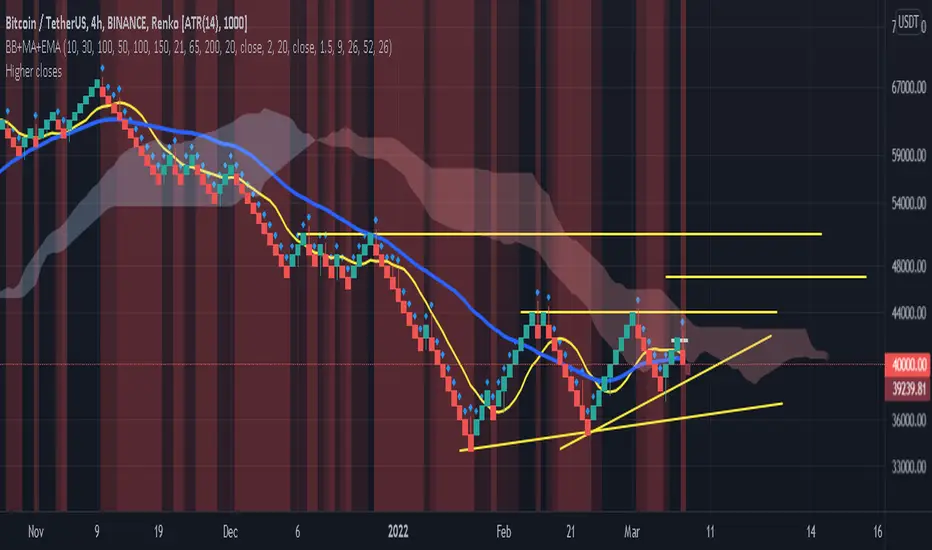
Higher closes + MA 30 (identifying short chances)Higher closes + MA 30 (identifying short chances)
this system will help to find the most recent closed prices (close 1 and 2 previous candles... then compare it to the moving average 30 which is very important moving average ... if it is below those critical point.. it will be in red color and those are the short chances... otherwise we will have the long chances..
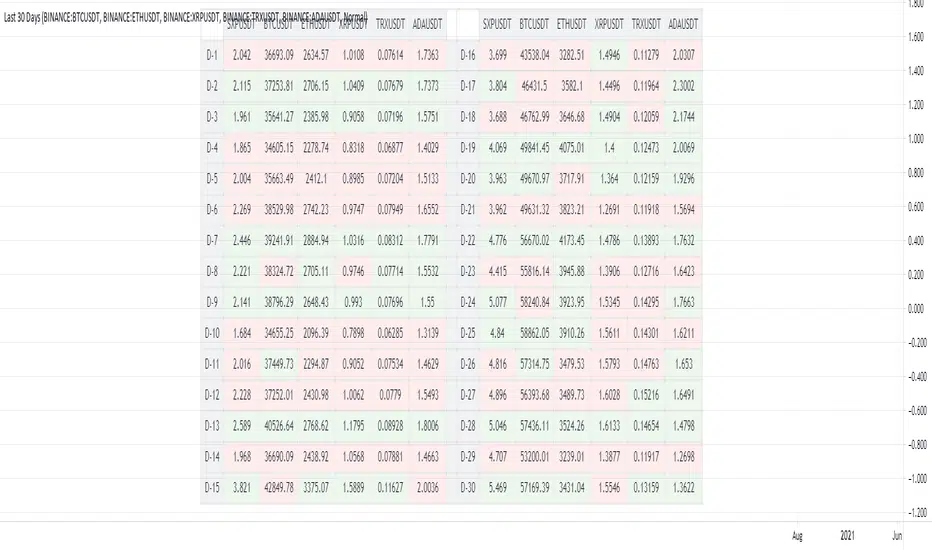
Last 30 DaysThis Script Shows Last 30 closed price for active ticker, Also provides last 30 daily closed price for an additional Ticker via input. For better use it is better to set the timeframe to daily chart.
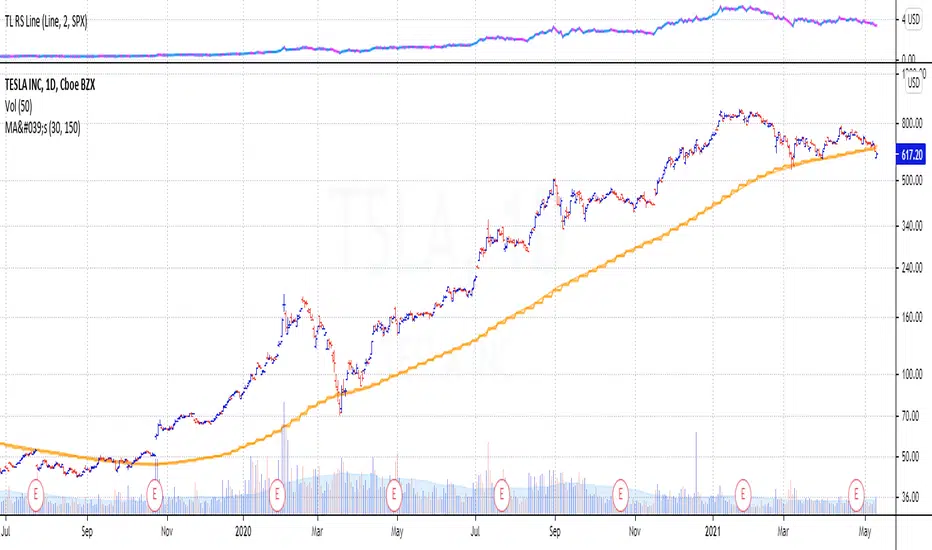
Stan Weinstein 30-week Moving AverageStan Weinstein's book 'Secrets for Profiting in Bull and Bear Markets' is without doubt one of the classics books traders read.
Weinstein said that at any one point in time, a stock (or an index) will be in one of four market "stages":
Stage 1 the Basing Area (also known as consolidation or accumulation phase)
Stage 2 the Advancing Stage
Stage 3 the Top Area (also known as the distribution phase), or
Stage 4 the Declining Stage
One of the concepts from the book that became classic is the definition of the four stages a stock can be in. These stages basically classify the different periods in the lifetime of a stock. An important thing to understand is that Weinstein uses weekly charts and identifies the current stage based on the direction on the 30 week moving average.
This script plots the 30 week moving average and the 150 day moving average.
Belkhayate Iceberg 3.0 - WMA 30 periodThis is a multicolore WMA 30 Period and not an iceberg orders detector as claimed by Mostafa Belkhayate.
The colors will change based on the candles position towards the 30 period WMA .
Its free and open source for all the african youth, we never charge and lie to our beloved people.
We look for buy opportunities when the plot is green.
We look for sell opportunities when the plot is red.

Multi-Exchange Volume (30 Tickers) by kurtsmock + BV + rVolauthor: kurtsmock
Fully Customizable ticker set. Up to 30 Tickers. Bitcoin set as default.
-- IMPORTANT NOTE: --
30 Exchanges are a lot. It can take a while to load. You can fully customize this indicator to your liking. Here's how:
1. Load indicator
2. Open Settings
3. Uncheck the switch box for exchanges you want unincluded
4. At the bottom of the settings menu click "Defaults" and hit "Save as Default"
5. To turn them all back on, hit "Reset Settings" in that same "Defaults" menu and click "Save as Default" again.
Also, you don't have to use this with Bitcoin. This works with any asset, just change the ticker in the settings.
There's a lot going on with this indicator so the following is descriptions and instructions to help you better understand what's going on here. Thanks!
Goal:
- To provide a mechanism for assets on multiple exchanges to have their volume evaluated together
Edge:
- Having better and more complete volume information
Notes:
- The Default Exchanges for this indicator are highest volume bitcoin exchanges, but may contain "fake volume"
- Indicator is set for Bitcoin by default. However, you can change the tickers to reflect any asset you want
////// rVol //////
Goal:
- To understand how much volume is being executed relative to the same candle on previous days/periods
Edge:
- Higher rVol implies higher volatility and market interest.
- High rVol = higher than average volume . Markets move on volume so higher than average volume indicates increased market activity/volatility
- rVol is an indirect measure of active or anticipated volatility
Definitions:
- rVol: The volume of a period compared to the Average Volume of that same period in past sessions
- Important to note it does NOT add up the last 10 (default) candles, but rather the last 10 candles at session intervals.
- Example:
-- On a Tuesday, 1h chart it will add up the last ten Tuesday, 9:00 am candles, not including the current, active candle.
-- It then averages those lookback candles.
-- It then plots the percentage relationship between the most recent candle and the average of the lookback candles
-- Avg Vol of Lookback candles = 5000,
-- Volume of most recent candle = 4000: Output = rVol = 80:
-- Volume of most recent candle was 80% of the average volume in the 9 am time period of the last ten Tuesdays in the 9 am, 1h period
Notes:
- rVol does not add current candle volume into lookback sum. So, you set lookback to be: (not including the current day)
- rVol is on a switch. So, if you want to see rVol instead of volume, hit the switch in the settings
- If you want to see both, load 2 instances of the indicator.
////// Better-er Volume //////
Goal:
To Identify:
- When a candle closes at the highest volume * range relative to the lookback period and close > open
- When a candle closes at the highest volume * range relative to the lookback period and close < open
- When a candle closes at the highest volume / price relative to the lookback period
Edge:
- Identifies beginnings of price expansion, climax of price expansion, breakouts, pivots, and take profit points on the volume chart
Notes:
- Based generally on Barry Taylor's "Better Volume" indicator and ideas from Pascal Willain's book "Value in Time."
- Better-er Volume rules are applied to both Total Volume or rVol.
-- When rVol is displayed Better-er Volume is applied to rVol
-- When Total Volume is displayed Better-er Volume is applied to Total Volume
// Plot Key: //
Green Triangle Up = Often marks the beginning and/or end of price expansion to the upside
Red Triangle Up = Often marks the beginning and/or end of price expansion to the downside
Yellow Square = High Volume but Tight Range. Implies a Battle of Bulls and Bears. High Liquidity area. Provided Liquidity is not enough to move price. Thick Limit Order Book.
Purple Triangle Up or Down = Implies high market participation. Typically at the end of expansion when very significant s/r is hit
category: volume Volatility
tags: Volume rVol relativevolume Bitcoin cryptocurrency bettervolume
Many More Volume Indicators Coming Out Soon!

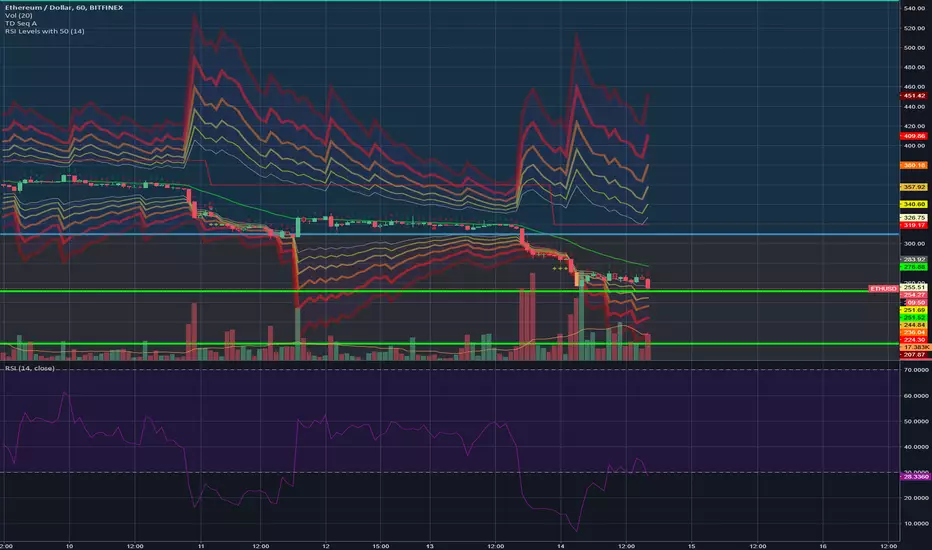
RSI Levels, 15-30 & 70-85 with 50New version of my RSI Levels, 20-30 & 70-80 considering extreme market conditions.
This version scales between 15-30 and 70-85 instead and also has RSI 50 as the middle line.
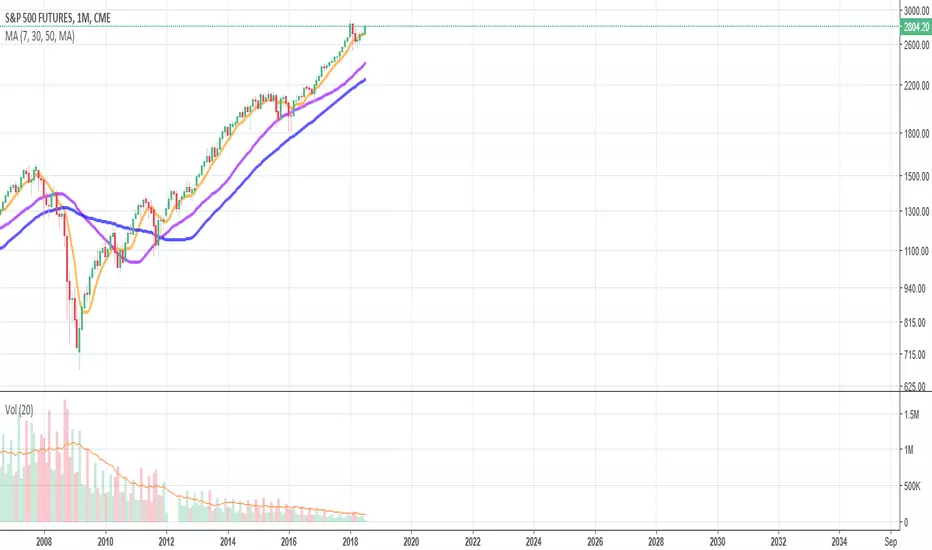
Triple Moving Average (7, 30, 50)Same as , because Trading View doesn't allow you to change the visibility settings after publishing.
[naoligo] 12x MA DT (5, 15, 30 & 60)This indicator is based on "Generic 8x MA Plotter", by @LazyBear.
It is also based on my own indicator "10x MA (H, D, W, M)", which is good for Swing Trading and/or Position.
This one is focused in daytrade and it will plot three Moving Averages based on current time interval (under 5 minutes) and nine based on chosen periods by 5, 15, 30 and 60 minutes. You will be able to see where is, for example, a 50 period's SMA of 15 minutes when using a 2 minutes time interval chart. I find it very useful to analyze, in a snap, possible price ranges and enter/exit points. All reference values are from setups known and used by daytraders.
you can choose between EMA or SMA (default: SMA) for each time interval, that are distributed in:
3x MA current time interval;
3x MA 5 minutes;
2x MA 15 minutes;
2x MA 30 minutes;
2x MA 60 minutes.
I've tried to keep the code as simple as possible, so you can increase the number of MA or modify the type for each time interval.
Cons: Use it wisely, because if you choose to plot all the 12 Moving Averages, it will may consume a lot of your navigator resources.
Enjoy!

BTC 30 m Long singal Asset: Bitcoin only
Timeframe: 30 minutes
Entry Conditions (Long):
MACD histogram turns from red to green (negative to positive)
Stochastic K line crosses above D line AND this crossover happens below the lower band (20)
RSI is above the middle band (50)

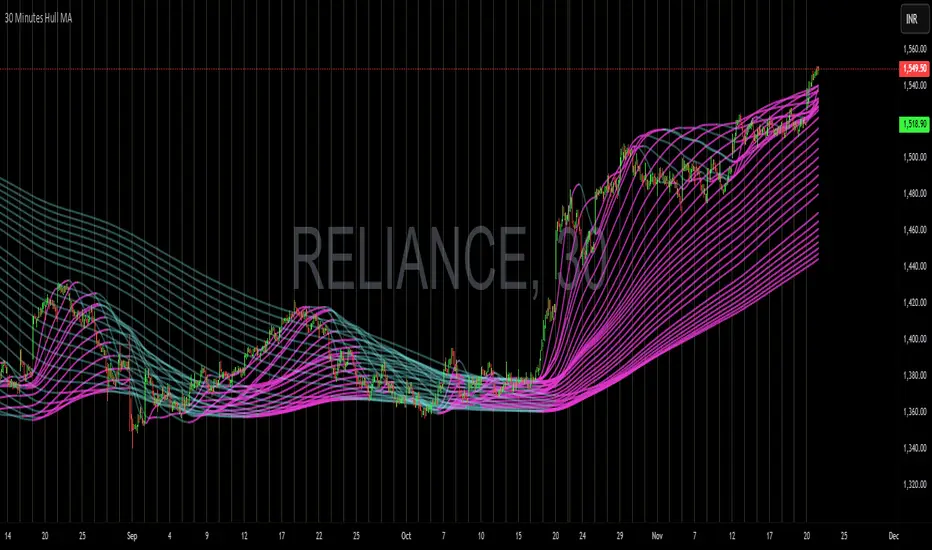
Hull MA Multi-Time Frame 30 minutesA Hull Moving Average (HMA) plotted on a fixed 30-minute timeframe gives a smooth, lag-free trend indication by filtering out noise.
When multiple HMAs of varying lengths converge near the lower side, it signals bullish accumulation, suggesting that sellers are exhausted and buyers are stepping in.
Conversely, when HMAs form a bouquet or cluster near the top, it indicates distribution or weakening momentum, signaling a potential bearish reversal.
In essence, HMA alignment and convergence act as a visual gauge of trend strength and turning points in market sentiment.
MA 5-10-30-60-90-120 by MMCThis indicator only plots 6 moving average lines:
MA 5, MA 10, MA 30, MA 60, MA 90, MA 120
No ribbon, no fill, no clouds, no arrows, no alerts — completely clean and minimal.
Lines are thin (linewidth = 2) but colors are very bright/neon so they pop even on dark charts.
Two inputs:
MA Type → EMA (default, faster) or SMA (smoother but lags more)
Color Theme → 3 preset themes:
Canlı Kontrast → brightest and most visible (red-orange-yellow-green-blue-purple)
Gökkuşağı → classic rainbow order
Kırmızı-Yeşil → red/orange tones for short-term, green tones for long-term
Change the theme and colors update instantly.
