Guppy EMA scriptGuppy method of EMA 3, 5, 8, 10, 12, 30, 35, 40, 45, 50.
I add on EMA 68 and 200.
Originally written by Omega.
This script is edited by Boon (me)
Cerca negli script per "沪深主板45度上升的股票"

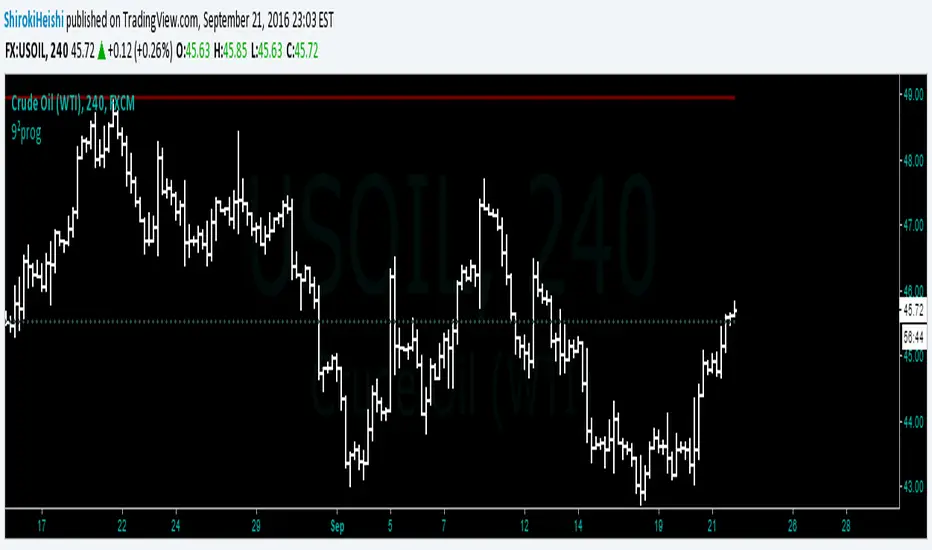
Gann ProgressionsThis is my attempt at progressions along the Gann wheel. Theoretically this script advances a numeral 45 degrees along the square of nine. The degree chosen (negative for bearish projections) can of course be customized and further subdivided as per your needs, but there is a slight flaw in the calculations that I am asking the community to take a look at, hopefully you all can give me a hand here. While the majority of the figures are correct, there seems to be some very slight discrepancies in the prices projected. If you are a Gann user, then you know how accurate they can be and as such, the discrepancies are not tolerable. Take a peek and let me know what you see that I am missing. Hope this script becomes helpful for all users.

Bollinger + RSI, Double Strategy (by ChartArt)Bollinger Bands + RSI, Double Strategy
This strategy uses a slower RSI with period 16 to sell when the RSI increases over the value of 55 (or to buy when the value falls below 45), with the classic Bollinger Bands strategy to sell when the price is above the upper Bollinger Band and falls below it (and to buy when the price is below the lower band and rises above it). This strategy only triggers when both the RSI and the Bollinger Bands indicators are at the same time in the described overbought or oversold condition. In addition there are color alerts which can be deactivated.
This basic strategy is based upon the "RSI Strategy" and "Bollinger Bands Strategy" which were created by Tradingview and uses no money management like a trailing stop loss and no scalping methods. Every win/loss trade is simply counted from the last overbought/oversold condition to the next one.
This strategy does not use close prices from higher-time frame and should not repaint after the current candle has closed. It might repaint like every Tradingview indicator while the current candle hasn't closed.
All trading involves high risk; past performance is not necessarily indicative of future results. Hypothetical or simulated performance results have certain inherent limitations. Unlike an actual performance record, simulated results do not represent actual trading. Also, since the trades have not actually been executed, the results may have under- or over-compensated for the impact, if any, of certain market factors, such as lack of liquidity. Simulated trading programs in general are also subject to the fact that they are designed with the benefit of hindsight. No representation is being made that any account will or is likely to achieve profits or losses similar to those shown.

GC Magic Overlay V2This script is based on Guppy method (www.guppytraders.com
) , it was introduced to me by fellow trader @nmike. I am using this script in conjunction to Clones ,Harmonic and other tools.
Script Function:
a. Script plots the fast and slow Exponential moving averages as ribbons.
EMA's used
EMA (close): 25,30,35,40,45,50,55 (Green)
EMA (close): 89,99,109,119,129,139,149 (Red)
b. It draws the Circle dots in Pink for Sell and Black for Buy.
Script Parameters:
a. EMA : 2 emas for cross
b. Signal Exponential moving average
c. which time frame to Plot the above Signal Exponential
d. Show Guppy Slow - Red - Toggle to show red emas on chart
e. Show Guppy Fast - Green- Toggle to show green emas on chart
How to Trade:
a. Wait for the Pink/Black Dot to appear on Chart
b. Do not take trade immediately after the dot appears. Wait for the price to retrace back and touch the ema ribbons.This will keep you away from fake breakouts.
c. Rentries : in examples below
Examples:

MACD, backtest 2015+ only, cut in half and doubledThis is only a slight modification to the existing "MACD Strategy" strategy plugin!
found the default MACD strategy to be lacking, although impressive for its simplicity. I added "year>2014" to the IF buy/sell conditions so it will only backtest from 2015 and beyond ** .
I also had a problem with the standard MACD trading late, per se. To that end I modified the inputs for fast/slow/signal to double. Example: my defaults are 10, 21, 10 so I put 20, 42, 20 in. This has the effect of making a 30min interval the same as 1 hour at 10,21,10. So if you want to backtest at 4hr, you would set your time interval to 2hr on the main chart. This is a handy way to make shorter time periods more useful even regardless of strategy/testing, since you can view 15min with alot less noise but a better response.
Used on BTCCNY OKcoin, with the chart set at 45 min (so really 90min in the strategy) this gave me a percent profitable of 42% and a profit factor of 1.998 on 189 trades.
Personally, I like to set the length/signals to 30,63,30. Meaning you need to triple the time, it allows for much better use of shorter time periods and the backtests are remarkably profitable. (i.e. 15min chart view = 45min on script, 30min= 1.5hr on script)
** If you want more specific time periods you need to try plugging in different bar values: replace "year" with "n" and "2014" with "5500". The bars are based on unix time I believe so you will need to play around with the number for n, with n being the numbers of bars.

CM Stochastic POP Method 1 - Jake Bernstein_V1A good friend ucsgears recently published a Stochastic Pop Indicator designed by Jake Bernstein with a modified version he found.
I spoke to Jake this morning and asked if he had any updates to his Stochastic POP Trading Method. Attached is a PDF Jake published a while back (Please read for basic rules, which also Includes a New Method). I will release the Additional Method Tomorrow.
Jake asked me to share that he has Updated this Method Recently. Now across all symbols he has found the Stochastic Values of 60 and 30 to be the most profitable. NOTE - This can be Significantly Optimized for certain Symbols/Markets.
Jake Bernstein will be a contributor on TradingView when Backtesting/Strategies are released. Jake is one of the Top Trading System Developers in the world with 45+ years experience and he is going to teach how to create Trading Systems and how to Optimize the correct way.
Below are a few Strategy Results....Soon You Will Be Able To Find Results Like This Yourself on TradingView.com
BackTesting Results Example: EUR-USD Daily Chart Since 01/01/2005
Strategy 1:
Go Long When Stochastic Crosses Above 60. Go Short When Stochastic Crosses Below 30. Exit Long/Short When Stochastic has a Reverse Cross of Entry Value.
Results:
Total Trades = 164
Profit = 50, 126 Pips
Win% = 38.4%
Profit Factor = 1.35
Avg Trade = 306 Pips Profit
***Most Consecutive Wins = 3 ... Most Consecutive Losses = 6
Strategy 2:
Rules - Proprietary Optimization Jake Will Teach. Only Added 1 Additional Exit Rule.
Results:
Total Trades = 164
Profit = 62, 876 Pips!!!
Win% = 38.4%
Profit Factor = 1.44
Avg Trade = 383 Pips Profit
***Most Consecutive Wins = 3 ... Most Consecutive Losses = 6
Strategy 3:
Rules - Proprietary Optimization Jake Will Teach. Only added 1 Additional Exit Rule.
Results:
Winning Percent Increases to 72.6%!!! , Same Amount of Trades.
***Most Consecutive Wins = 21 ...Most Consecutive Losses = 4
Indicator Includes:
-Ability to Color Candles (CheckBox In Inputs Tab)
Green = Long Trade
Blue = No Trade
Red = Short Trade
-Color Coded Stochastic Line based on being Above/Below or In Between Entry Lines.
Link To Jakes PDF with Rules
dl.dropboxusercontent.com

Ichimoku-Hausky_v2 Trading SystemMade a new version of my trading system. I have added a cloud that is made with 45 EMA and 104 MA. Now you can choose where to set trailing stop. As shown in the example you set trailing stop under the cloud.

Lazy Long Term SignalsThis little indicator displays the ratio between the series close and the (default 45) exponential moving average.
The idea is to consider buying when the signal is above 1 and sell, or short if aggressive, when the signal crosses below 1. It strikes me as useful when used in conjunction with the MACD and UCSgears' Linear Regression Slope indicator.
Using such a simple strategy as I outlined above is probably only useful (if it even works) and beneficial in long term or tax deferred accounts like 401Ks, IRAs, ROTH IRAs, etc. Otherwise the taxation would probably destroy the appreciation. Who wants that?

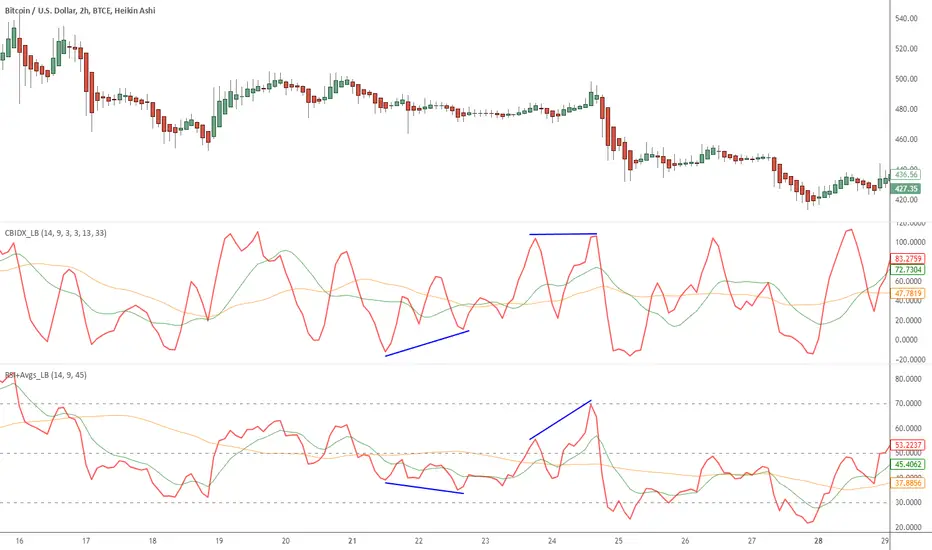
Indicators: Constance Brown Composite Index & RSI+AvgsI am a big fan of Constance Brown. Her book "Technical Analysis for Trading Professionals" is an absolute classic (get the 2nd edition).
I have included here 2 of the indicators she uses in all her charts.
Composite Index
----------------------------------------
This is a formula Ms Brown developed (Cardwell may not agree!) to identify divergence failures with in the RSI. This also highlights the horizontal support levels with in the indicator area.
This index removes the normalization range restrictions in RSI. This means it is not bound with in 0-100 range. Also, this has embedded momentum calculation in it.
The fine nuances of this indicator are not documented well enough, if you find some good documentation, do let me know. Always use this with RSI (like the next one).
RSI+Avgs
----------------------------------------
This is plain 14 period RSI with a 9-period EMA and 45-period SMA overlaid.