Universal Global SessionUniversal Global Session
This Script combines the world sessions of: Stocks, Forex, Bitcoin Kill Zones, strategic points, all configurable, in a single Script, to capitalize the opening and closing times of global exchanges as investment assets, becoming an Universal Global Session .
It is based on the great work of @oscarvs ( BITCOIN KILL ZONES v2 ) and the scripts of @ChrisMoody. Thank you Oscar and Chris for your excellent judgment and great work.
At the end of this writing you can find all the internet references of the extensive documentation that I present here. To maximize your benefits in the use of this Script, I recommend that you read the entire document to create an objective and practical criterion.
All the hours of the different exchanges are presented at GMT -6. In Market24hClock you can adjust it to your preferences.
After a deep investigation I have been able to show that the different world sessions reveal underlying investment cycles, where it is possible to find sustained changes in the nominal behavior of the trend before the passage from one session to another and in the natural overlaps between the sessions. These underlying movements generally occur 15 minutes before the start, close or overlap of the session, when the session properly starts and also 15 minutes after respectively. Therefore, this script is designed to highlight these particular trending behaviors. Try it, discover your own conclusions and let me know in the notes, thank you.
Foreign Exchange Market Hours
It is the schedule by which currency market participants can buy, sell, trade and speculate on currencies all over the world. It is open 24 hours a day during working days and closes on weekends, thanks to the fact that operations are carried out through a network of information systems, instead of physical exchanges that close at a certain time. It opens Monday morning at 8 am local time in Sydney —Australia— (which is equivalent to Sunday night at 7 pm, in New York City —United States—, according to Eastern Standard Time), and It closes at 5pm local time in New York City (which is equivalent to 6am Saturday morning in Sydney).
The Forex market is decentralized and driven by local sessions, where the hours of Forex trading are based on the opening range of each active country, becoming an efficient transfer mechanism for all participants. Four territories in particular stand out: Sydney, Tokyo, London and New York, where the highest volume of operations occurs when the sessions in London and New York overlap. Furthermore, Europe is complemented by major financial centers such as Paris, Frankfurt and Zurich. Each day of forex trading begins with the opening of Australia, then Asia, followed by Europe, and finally North America. As markets in one region close, another opens - or has already opened - and continues to trade in the currency market. The seven most traded currencies in the world are: the US dollar, the euro, the Japanese yen, the British pound, the Australian dollar, the Canadian dollar, and the New Zealand dollar.
Currencies are needed around the world for international trade, this means that operations are not dominated by a single exchange market, but rather involve a global network of brokers from around the world, such as banks, commercial companies, central banks, companies investment management, hedge funds, as well as retail forex brokers and global investors. Because this market operates in multiple time zones, it can be accessed at any time except during the weekend, therefore, there is continuously at least one open market and there are some hours of overlap between the closing of the market of one region and the opening of another. The international scope of currency trading means that there are always traders around the world making and satisfying demands for a particular currency.
The market involves a global network of exchanges and brokers from around the world, although time zones overlap, the generally accepted time zone for each region is as follows:
Sydney 5pm to 2am EST (10pm to 7am UTC)
London 3am to 12 noon EST (8pm to 5pm UTC)
New York 8am to 5pm EST (1pm to 10pm UTC)
Tokyo 7pm to 4am EST (12am to 9am UTC)
Trading Session
A financial asset trading session refers to a period of time that coincides with the daytime trading hours for a given location, it is a business day in the local financial market. This may vary according to the asset class and the country, therefore operators must know the hours of trading sessions for the securities and derivatives in which they are interested in trading. If investors can understand market hours and set proper targets, they will have a much greater chance of making a profit within a workable schedule.
Kill Zones
Kill zones are highly liquid events. Many different market participants often come together and perform around these events. The activity itself can be event-driven (margin calls or option exercise-related activity), portfolio management-driven (asset allocation rebalancing orders and closing buy-in), or institutionally driven (larger players needing liquidity to complete the size) or a combination of any of the three. This intense cross-current of activity at a very specific point in time often occurs near significant technical levels and the established trends emerging from these events often persist until the next Death Zone approaches or enters.
Kill Zones are evolving with time and the course of world history. Since the end of World War II, New York has slowly invaded London's place as the world center for commercial banking. So much so that during the latter part of the 20th century, New York was considered the new center of the financial universe. With the end of the cold war, that leadership appears to have shifted towards Europe and away from the United States. Furthermore, Japan has slowly lost its former dominance in the global economic landscape, while Beijing's has increased dramatically. Only time will tell how these death zones will evolve given the ever-changing political, economic, and socioeconomic influences of each region.
Financial Markets
New York
New York (NYSE Chicago, NASDAQ)
7:30 am - 2:00 pm
It is the second largest currency platform in the world, followed largely by foreign investors as it participates in 90% of all operations, where movements on the New York Stock Exchange (NYSE) can have an immediate effect (powerful) on the dollar, for example, when companies merge and acquisitions are finalized, the dollar can instantly gain or lose value.
A. Complementary Stock Exchanges
Brazil (BOVESPA - Brazilian Stock Exchange)
07:00 am - 02:55 pm
Canada (TSX - Toronto Stock Exchange)
07:30 am - 02:00 pm
New York (NYSE - New York Stock Exchange)
08:30 am - 03:00 pm
B. North American Trading Session
07:00 am - 03:00 pm
(from the beginning of the business day on NYSE and NASDAQ, until the end of the New York session)
New York, Chicago and Toronto (Canada) open the North American session. Characterized by the most aggressive trading within the markets, currency pairs show high volatility. As the US markets open, trading is still active in Europe, however trading volume generally decreases with the end of the European session and the overlap between the US and Europe.
C. Strategic Points
US main session starts in 1 hour
07:30 am
The euro tends to drop before the US session. The NYSE, CHX and TSX (Canada) trading sessions begin 1 hour after this strategic point. The North American session begins trading Forex at 07:00 am.
This constitutes the beginning of the overlap of the United States and the European market that spans from 07:00 am to 10:35 am, often called the best time to trade EUR / USD, it is the period of greatest liquidity for the main European currencies since it is where they have their widest daily ranges.
When New York opens at 07:00 am the most intense trading begins in both the US and European markets. The overlap of European and American trading sessions has 80% of the total average trading range for all currency pairs during US business hours and 70% of the total average trading range for all currency pairs during European business hours. The intersection of the US and European sessions are the most volatile overlapping hours of all.
Influential news and data for the USD are released between 07:30 am and 09:00 am and play the biggest role in the North American Session. These are the strategically most important moments of this activity period: 07:00 am, 08:00 am and 08:30 am.
The main session of operations in the United States and Canada begins
08:30 am
Start of main trading sessions in New York, Chicago and Toronto. The European session still overlaps the North American session and this is the time for large-scale unpredictable trading. The United States leads the market. It is difficult to interpret the news due to speculation. Trends develop very quickly and it is difficult to identify them, however trends (especially for the euro), which have developed during the overlap, often turn the other way when Europe exits the market.
Second hour of the US session and last hour of the European session
09:30 am
End of the European session
10:35 am
The trend of the euro will change rapidly after the end of the European session.
Last hour of the United States session
02:00 pm
Institutional clients and very large funds are very active during the first and last working hours of almost all stock exchanges, knowing this allows to better predict price movements in the opening and closing of large markets. Within the last trading hours of the secondary market session, a pullback can often be seen in the EUR / USD that continues until the opening of the Tokyo session. Generally it happens if there was an upward price movement before 04:00 pm - 05:00 pm.
End of the trade session in the United States
03:00 pm
D. Kill Zones
11:30 am - 1:30 pm
New York Kill Zone. The United States is still the world's largest economy, so by default, the New York opening carries a lot of weight and often comes with a huge injection of liquidity. In fact, most of the world's marketable assets are priced in US dollars, making political and economic activity within this region even more important. Because it is relatively late in the world's trading day, this Death Zone often sees violent price swings within its first hour, leading to the proven adage "never trust the first hour of trading in America. North.
---------------
London
London (LSE - London Stock Exchange)
02:00 am - 10:35 am
Britain dominates the currency markets around the world, and London is its main component. London, a central trading capital of the world, accounts for about 43% of world trade, many Forex trends often originate from London.
A. Complementary Stock Exchange
Dubai (DFM - Dubai Financial Market)
12:00 am - 03:50 am
Moscow (MOEX - Moscow Exchange)
12:30 am - 10:00 am
Germany (FWB - Frankfurt Stock Exchange)
01:00 am - 10:30 am
Afríca (JSE - Johannesburg Stock Exchange)
01:00 am - 09:00 am
Saudi Arabia (TADAWUL - Saudi Stock Exchange)
01:00 am - 06:00 am
Switzerland (SIX - Swiss Stock Exchange)
02:00 am - 10:30 am
B. European Trading Session
02:00 am - 11:00 am
(from the opening of the Frankfurt session to the close of the Order Book on the London Stock Exchange / Euronext)
It is a very liquid trading session, where trends are set that start during the first trading hours in Europe and generally continue until the beginning of the US session.
C. Middle East Trading Session
12:00 am - 06:00 am
(from the opening of the Dubai session to the end of the Riyadh session)
D. Strategic Points
European session begins
02:00 am
London, Frankfurt and Zurich Stock Exchange enter the market, overlap between Europe and Asia begins.
End of the Singapore and Asia sessions
03:00 am
The euro rises almost immediately or an hour after Singapore exits the market.
Middle East Oil Markets Completion Process
05:00 am
Operations are ending in the European-Asian market, at which time Dubai, Qatar and in another hour in Riyadh, which constitute the Middle East oil markets, are closing. Because oil trading is done in US dollars, and the region with the trading day coming to an end no longer needs the dollar, consequently, the euro tends to grow more frequently.
End of the Middle East trading session
06:00 am
E. Kill Zones
5:00 am - 7:00 am
London Kill Zone. Considered the center of the financial universe for more than 500 years, Europe still has a lot of influence in the banking world. Many older players use the European session to establish their positions. As such, the London Open often sees the most significant trend-setting activity on any trading day. In fact, it has been suggested that 80% of all weekly trends are set through the London Kill Zone on Tuesday.
F. Kill Zones (close)
2:00 pm - 4:00 pm
London Kill Zone (close).
---------------
Tokyo
Tokyo (JPX - Tokyo Stock Exchange)
06:00 pm - 12:00 am
It is the first Asian market to open, receiving most of the Asian trade, just ahead of Hong Kong and Singapore.
A. Complementary Stock Exchange
Singapore (SGX - Singapore Exchange)
07:00 pm - 03:00 am
Hong Kong (HKEx - Hong Kong Stock Exchange)
07:30 pm - 02:00 am
Shanghai (SSE - Shanghai Stock Exchange)
07:30 pm - 01:00 am
India (NSE - India National Stock Exchange)
09:45 pm - 04:00 am
B. Asian Trading Session
06:00 pm - 03:00 am
From the opening of the Tokyo session to the end of the Singapore session
The first major Asian market to open is Tokyo which has the largest market share and is the third largest Forex trading center in the world. Singapore opens in an hour, and then the Chinese markets: Shanghai and Hong Kong open 30 minutes later. With them, the trading volume increases and begins a large-scale operation in the Asia-Pacific region, offering more liquidity for the Asian-Pacific currencies and their crosses. When European countries open their doors, more liquidity will be offered to Asian and European crossings.
C. Strategic Points
Second hour of the Tokyo session
07:00 pm
This session also opens the Singapore market. The commercial dynamics grows in anticipation of the opening of the two largest Chinese markets in 30 minutes: Shanghai and Hong Kong, within these 30 minutes or just before the China session begins, the euro usually falls until the same moment of the opening of Shanghai and Hong Kong.
Second hour of the China session
08:30 pm
Hong Kong and Shanghai start trading and the euro usually grows for more than an hour. The EUR / USD pair mixes up as Asian exporters convert part of their earnings into both US dollars and euros.
Last hour of the Tokyo session
11:00 pm
End of the Tokyo session
12:00 am
If the euro has been actively declining up to this time, China will raise the euro after the Tokyo shutdown. Hong Kong, Shanghai and Singapore remain open and take matters into their own hands causing the growth of the euro. Asia is a huge commercial and industrial region with a large number of high-quality economic products and gigantic financial turnover, making the number of transactions on the stock exchanges huge during the Asian session. That is why traders, who entered the trade at the opening of the London session, should pay attention to their terminals when Asia exits the market.
End of the Shanghai session
01:00 am
The trade ends in Shanghai. This is the last trading hour of the Hong Kong session, during which market activity peaks.
D. Kill Zones
10:00 pm - 2:00 am
Asian Kill Zone. Considered the "Institutional" Zone, this zone represents both the launch pad for new trends as well as a recharge area for the post-American session. It is the beginning of a new day (or week) for the world and as such it makes sense that this zone often sets the tone for the remainder of the global business day. It is ideal to pay attention to the opening of Tokyo, Beijing and Sydney.
--------------
Sidney
Sydney (ASX - Australia Stock Exchange)
06:00 pm - 12:00 am
A. Complementary Stock Exchange
New Zealand (NZX - New Zealand Stock Exchange)
04:00 pm - 10:45 pm
It's where the global trading day officially begins. While it is the smallest of the megamarkets, it sees a lot of initial action when markets reopen Sunday afternoon as individual traders and financial institutions are trying to regroup after the long hiatus since Friday afternoon. On weekdays it constitutes the end of the current trading day where the change in the settlement date occurs.
B. Pacific Trading Session
04:00 pm - 12:00 am
(from the opening of the Wellington session to the end of the Sydney session)
Forex begins its business hours when Wellington (New Zealand Exchange) opens local time on Monday. Sydney (Australian Stock Exchange) opens in 2 hours. It is a session with a fairly low volatility, configuring itself as the calmest session of all. Strong movements appear when influential news is published and when the Pacific session overlaps the Asian Session.
C. Strategic Points
End of the Sydney session
12:00 am
---------------
Conclusions
The best time to trade is during overlaps in trading times between open markets. Overlaps equate to higher price ranges, creating greater opportunities.
Regarding press releases (news), it should be noted that these in the currency markets have the power to improve a normally slow trading period. When a major announcement is made regarding economic data, especially when it goes against the predicted forecast, the coin can lose or gain value in a matter of seconds. In general, the more economic growth a country produces, the more positive the economy is for international investors. Investment capital tends to flow to countries that are believed to have good growth prospects and subsequently good investment opportunities, leading to the strengthening of the country's exchange rate. Also, a country that has higher interest rates through its government bonds tends to attract investment capital as foreign investors seek high-yield opportunities. However, stable economic growth and attractive yields or interest rates are inextricably intertwined. It's important to take advantage of market overlaps and keep an eye out for press releases when setting up a trading schedule.
References:
www.investopedia.com
www.investopedia.com
www.investopedia.com
www.investopedia.com
market24hclock.com
market24hclock.com
Cerca negli script per "沪深主板45度上升的股票"

Price Action Trading System v0.3 by JustUncleL with modifcationsThe base of this script is the Price Action Trading System from JustUncle .
I have first combined it with script ADX and DI by BeikabuOyaji to indicate when the +DI is above the -DI and the ADX is above 20. This is represented by crosses at the top of the page: green indicating that the +DI is above the -DI and ADX above 20, and red if -DI is above the +DI and ADX above 20. If the ADX is increasing in slope while the +DI is above the -DI, an up green arrow is shown at the bottom of the page, indicating an increase in this trend, and the slope of the ADX is increasing and the -DI is above the +DI, a down arrow is shown at the bottom. One could think to a green cross with a green up arrow as a potential buy opportunity, and a red cross with a red down arrow as a potential sell opportunity.
Next, I have combined this script with the Indicator: WaveTrend Oscillator from Lazybear . If the oscillator has readings below -45 and the slope of the line is increasing, a green diamond appears above the chart. This indicates a potential buy opportunity. If the oscillator has readings above 50 and the slope of the line is decreasing, a red diamond appears above the chart. This indicates a potential sell opportunity. Now if the slope of the oscillator is rising significantly but does not hit the -45 threshold to start its increase, but is negative in value, a green flag appears at the top of the page. This represents a potential buy opportunity. If the slope of the oscillator is significantly decreasing and is positive in value, a red flag appears at the bottom of the page. This represents a potential sell opportunity.
The base of this script, the Price Action Trading System v0.3 by JustUncle , has many of its own features that I have kept. If the MACD is positive, the background colour is green. If it is negative, the colour is red. If the CCI and RSI indicate an oversold opportunity and the MACD is positive, you get an up olive arrow below the chart. If they indicate an overbought opportunity and the MACD is negative, you get a red down arrow above the chart. If the CCI value stays oversold after a green arrow, the candle chart turns turquoise, and if overbought, turns black after a red arrow.
You can use these indicators in combination to help you with your trading strategy.

RVC-Daily_PivotsPurpose: Fibonacci Pivot levels + Gann levels calculation and display on Chart automatically.
Mainly expected to use these for intraday trading on NIFTY and BankNifty
Display R1/R2/R3 - Pivot - S1/S2/S3 levels
Also display GANN Levels of
720- / 540- / 360- / 270-/ 180- / 90- / 45-
45+ / 90+ / 180+ / 270+ / 360+ /540+ /720 +
Same pivot levels are useful for any equity - support and resistance levels.
Levels indicated are only for reference and not meant for trading purpose.

RSI MTF by PeterOThis is my take on reaching Higher TimeFrame charts, what is usually helpful when determining the trend. On the example of RSI.
So imagine you want to check RSI from higher timeframe. 15x higher for example. There are 3 ways to do it.
1. security(tickerid,"15",rsi(close,14))
DON'T!!! I strongly advise against this method. Security() function is buggy in PineScript, leads to so-called "repainting" issues. Repainting is caused by creating leak from future data and leads to abnormally fantastic strategy backtest results like the one in Open Close Cross Strategy. Theoretically speaking if security() used correctly - with Pine version3 and barmerge.lookahead_off - you should encounter no repainting, but I could swear I saw scripts repaint even with security() implemented properly.
Even assuming security() implemented correctly will not repaint - it will create delay in your script. I'm using "15" multiplier in my example, and this means, I have to wait for 15 candles to close to produce indicators value. If a strong move happens in the meantime, I'm blind, because I have to wait anyway.
So for your own security, stay away from security() at all times.
2. rsi(close,14*15)
This will produce RSI plot with no delay, but a very flattened one. RSI will move between 45 and 45, never even reaching 30 or 70 levels. So pretty useless.
3. Dig-in-the-formula way.
Doing a bit more math produces RSI line, which is not delayed, not repainting and moving in full 0-100 RSI range. Actually - looking almost identical to the one from the higher timeframe. Which was the goal of this script.

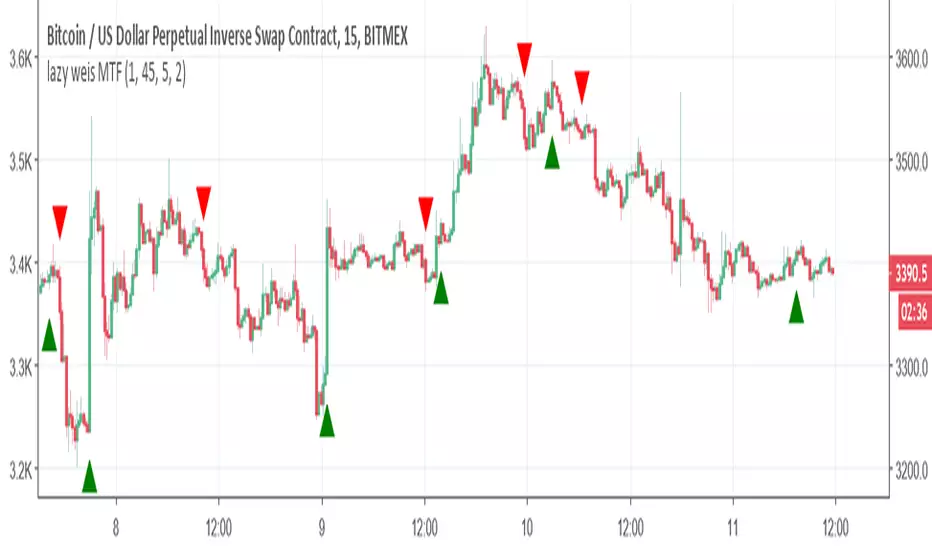
lazy weis MTFSo here was my problem and the way we fix it . We all know lazy bear weis model of volume . if we make it to MTF then we use security and it will repaint all over . since its hard to convert it to version 3 in order to fix the problem ,then it was impossible so far to make it a good MTF model.
By changing the length to time function we do not need to use the security and by this we can create an MTF model with no repaint ( i hope).
Now in setting you see int2 (now its on 60 min) , this you can change to any min value that you want. TV will consider it as length and not as time and by this way you can manipulate it to be an MTF model of your choosing . The int1 is minimum min always need to be smaller then int2
lets say you want 5 min chart and on 10 min time frame. so set it as int1=1 and int=15. if you want 45 min frame on the 5 min so set int 2 to 45
if you want it to be daily just set it to 1440 ,
I hope you like this solution
The Scale Of Sacred SoundsBased on the Sacred Sound Scale
How to use it:
This indicator is designed to capture the inferred behavior of traders and investors by using two groups of averages.
Meant for longer trades and trend indicator.
Used on any timescale as needed.
Can trade on long or short where the slow MA crosses fast Ma or where the Slow MA compresses and flips open again.
Follow the trend to the end - pot of gold at the end of the rainbow :-)
References:
Based on Daryl Guppy GMMA and
www.guppytraders.com
Read more at:
whatmusicreallyis.com
There is one tuning in which the frequencies 432, 528, 424 and 440 Hz can peacefully coexist. The scale has 32+1 pure harmonic tones and the reference frequency of 256 Hz. It comes from the Natural Ascending Series of Harmonics 32 to 64 of the 8 Hz Fundamental Tone, and represents its 6th double. I call this tuning The Scale of Sacred Sounds.
Representation using ancient Sumerian/Babylonian/Vedic math:
32; 33; 34; 35; 36; 37; 38; 39; 40; 41; 42; 43; 44; 45; 46; 47; 48; 49; 50; 51; 52; 53; 54; 55; 56; 57; 58; 59; 60; 61; 62; 63; 64
Representation using musical ratios:
1/1; 33/32; 17/16; 35/32; 9/8; 37/32; 19/16; 39/32; 5/4; 41/32; 21/16; 43/32; 11/8; 45/32; 23/16; 47/32; 3/2; 49/32; 25/16; 51/32; 13/8; 53/32; 27/16; 55/32; 7/4; 57/32; 29/16; 59/32; 15/8; 61/32; 31/16; 63/32; 2/1
The math for deriving one of the above series from the other is simple. Divide all numbers from the ancient series by the first, then simplify the fractions. Conversely, the series of ratios can be turned into the series of integers by calculating their least common denominator (the smallest whole number that is a multiple of all numbers under the fraction bar) and discarding it.
Logarithmic representation using musical constants (definition given further down):
0,000; 30,772; 60,625; 89,612; 117,783; 145,182; 171,850; 197,826; 223,144; 247,836; 271,934; 295,464; 318,454; 340,927; 362,905; 384,412; 405,465; 426,084; 446,287; 466,090; 485,508; 504,556; 523,248; 541,597; 559,616; 577,315; 594,707; 611,802; 628,609; 645,138; 661,398; 677,399; 693,147

Fib,Guppy Multiple MA(FGMMA)(A/D & Volume Weight,SMA,EMA)[cI8DH]Features:
- 3 + 12 MAs (12 is chosen because Guppy has 12 MAs)
- MA types can be set to Simple, Exponential, Weighted, and Smoothed
- Volume weight can be applied to all available MAs (the built-in VWMA uses Simple MA)
- It is possible to count in only effective portions of the volume in the equation by using Accum/Dist Volume Weight
- Secondary smoothing (useful when volume weight is enabled)
- Predefined MA sets based on Fibonacci sequence (2,3,5,8,.., 377), Guppy (3,5,8,10,12,15 &30,35,40,45,50,60), and cI8DH (2,3,5,8,12,17 & 30,34,39,45,52,60)
Recommended settings:
- hlc3 as input source captures all the essential information encapsulated in a candle. I'd use hlc3 as the default option. In uptrend, "low" and in downtrend, "high" might give more relevant results when using MAs for structural analysis of a market. For commonly used MAs (EMA20, SMA50,100,200), "close" should be used due to their self-fulfilling prophecy effect.
- When you have volume weight above 0, you may want to use secondary smoothing.
- Try not to use Simple MA for smaller lengths (below 20). Sharp changes in the past (right before the period specified by the length) will affect the current value of MA dramatically leading to confusion.
- I am using the first 3 MAs for SMA 50,100,200. You can disable them from the MA type selector all at once when using Fib or Guppy ribbons.
MA-based analysis:
There are different ways of structuring a market. Geometrical (trend lines, channels, fans, patterns, etc) and Fib retracement-based structuring is very common among traders. MAs give an alternative way of analyzing markets. MA ribbons such as Guppy (6 slow and 6 fast-moving MAs) are popular for analyzing market flow. IMO default Guppy sets are a bit random as the numbers do not have an elegant sequence. So I proposed my sets based on increasing sequene spacing (+1). These two MA ribbons are good for market flow analysis but the spacing of the MAs are not ideal for structuring a market. Ribbons based on the Fib sequence is a better choice for structuring a market. This is the equivalent of Fib channels but in a more dynamic form. Among other things, MA Fib ribbon can be used to assess market momentum and to compare different stages of a market. Here are two "educational-only" examples:
Notes:
- Smoothed MA with length L = Exponential MA with length 2*L-1
- Read the background section in my ADP indicator to understand how A/D Volume is calculated

Trend + RSI + Volume//@version=5
strategy("SPY Trend RSI Volume Strategy", overlay=true, default_qty_type=strategy.percent_of_equity, default_qty_value=10)
// === Inputs ===
emaFastLen = input.int(20, title="Fast EMA")
emaSlowLen = input.int(50, title="Slow EMA")
rsiLen = input.int(14, title="RSI Period")
rsiLongThresh = input.int(55, title="RSI Threshold for Long")
rsiShortThresh = input.int(45, title="RSI Threshold for Short")
volumeMultiplier = input.float(1.5, title="Volume Multiplier")
atrLen = input.int(14, title="ATR Length")
riskReward = input.float(2.0, title="Risk-Reward Ratio")
atrMult = input.float(1.5, title="ATR Multiplier")
// === Indicators ===
emaFast = ta.ema(close, emaFastLen)
emaSlow = ta.ema(close, emaSlowLen)
rsi = ta.rsi(close, rsiLen)
avgVolume = ta.sma(volume, 20)
atr = ta.atr(atrLen)
// === Conditions ===
// Trend
isBullish = emaFast > emaSlow
isBearish = emaFast < emaSlow
// Volume
volSpike = volume > avgVolume * volumeMultiplier
// Entry conditions
longCondition = isBullish and rsi > rsiLongThresh and volSpike and close > emaFast
shortCondition = isBearish and rsi < rsiShortThresh and volSpike and close < emaFast
// === Entries ===
if (longCondition)
stopLoss = close - atr * atrMult
takeProfit = close + (close - stopLoss) * riskReward
strategy.entry("Long", strategy.long)
strategy.exit("TP/SL Long", from_entry="Long", stop=stopLoss, limit=takeProfit)
if (shortCondition)
stopLoss = close + atr * atrMult
takeProfit = close - (stopLoss - close) * riskReward
strategy.entry("Short", strategy.short)
strategy.exit("TP/SL Short", from_entry="Short", stop=stopLoss, limit=takeProfit)
// === Plotting ===
plot(emaFast, title="EMA 20", color=color.orange)
plot(emaSlow, title="EMA 50", color=color.blue)

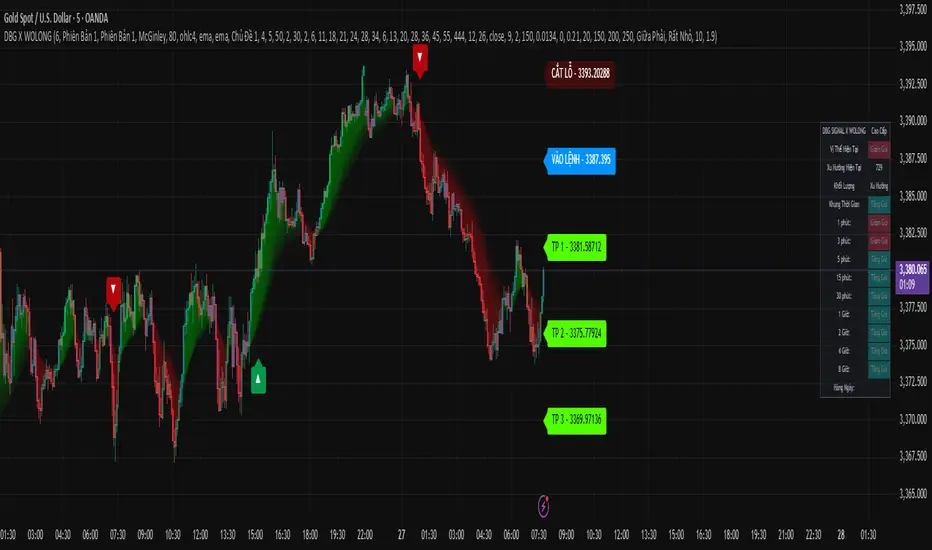
DBG X WOLONG📊 USER GUIDE – DBG X WOLONG ALGORITHM
🎯 OVERVIEW
The DBG X WOLONG Future Algorithm is a Pine Script v5 that integrates multiple advanced technical indicators, enabling traders to analyze markets and make precise trading decisions.
⚙️ MAIN SETTINGS
🔹 Sensitivity
Value: 1–20 (Default: 6)
Function: Adjusts the sensitivity of the SuperTrend signal
Guidelines:
Low value (1–5): Fewer signals, higher accuracy
High value (15–20): More signals, but with possible noise
🎨 DISPLAY SETTINGS
🔹 Candle Colors
Version 1: Based on MACD histogram
Version 2: Based on SuperTrend
🔹 Color Themes
Theme 1: Traditional Green/Red
Theme 2: Gold/Purple
Theme 3: Blue/Orange
No Fill: No background color displayed
📊 TRADING SIGNALS
🔹 Buy/Sell Signals
BUY 🚀 appears when:
SuperTrend shifts from bearish to bullish
Closing price > SMA 13
Braid Filter confirms
SELL appears when:
SuperTrend shifts from bullish to bearish
Closing price < SMA 13
Braid Filter confirms
🔹 Reversal Signals
▲ (Up Arrow): Buy signal when RSI crosses above 30
▼ (Down Arrow): Sell signal when RSI crosses below 70
🔹 Pullback Signals
▲ Purple: Pullback in bullish trend
▼ Purple: Pullback in bearish trend
🎯 TAKE PROFIT & STOP LOSS
🔹 TP Modes
Version 1: TP based on pivot points
Version 2: TP based on regression line
Close Price: TP at candle close
🔹 TP/SL Settings
TP Ratio: 2.0 (Default)
TP Length: 150 (Default)
ATR SL Length: 10
ATR SL Risk: 1.9
🔹 Labels Displayed
ENTRY: Entry point
STOP LOSS: Stop loss point
TP 1/2/3: 3 take profit levels
☁️ MOVING AVERAGE CLOUD
🔹 Supported MA Types
SMA – Simple Moving Average
EMA – Exponential Moving Average
WMA – Weighted Moving Average
HMA – Hull Moving Average
ALMA – Arnaud Legoux Moving Average
McGinley – McGinley Dynamic
FRAMA – Fractal Adaptive Moving Average
🔹 Cloud Cycles
Default: 2, 6, 11, 18, 21, 24, 28, 34
Customizable: All 8 cycles
🔹 Ribbon Cycles
Default: 6, 13, 20, 28, 36, 45, 55, 444
Customizable: All 8 cycles
🔧 BRAID FILTER
🔹 Function
Filters out noise signals
Confirms strong trends
🔹 Settings
MA Filter: McGinley (Recommended)
Filter Strength: 80% (Default)
📈 TRENDS & INDICATORS
🔹 SuperTrend
Main trend indicator
Generates primary buy/sell signals
🔹 Advanced Ichimoku
Tenkan-Sen: Blue line
Kijun-Sen: Orange line
Senkou Span A/B: Ichimoku cloud
🔹 Trend Tracking
Based on EMA 10 vs EMA 20
Candle colors follow trend direction
🔹 Trend Catcher
Range Filter with multiple options
Adjustable sensitivity
📊 MULTI-TIMEFRAME TREND PANEL
🔹 Displayed Timeframes
1m, 3m, 5m
15m, 30m, 1H
2H, 4H, 8H, Daily
🔹 Displayed Info
Current Position: Bullish/Bearish
Trend: Per timeframe
Volume: Current trading volume
🔹 Panel Positioning
9 selectable positions
Sizes: Large, Normal, Small, Extra Small
🚀 TRADE EXECUTION
📈 LONG ENTRY
✅ Entry Conditions
BUY 🚀 signal appears
SuperTrend turns from red to green
Price > SMA 13
Braid Filter confirms (green)
Trend Panel shows "Bullish" across multiple TFs
📊 Additional Confirmations
MACD Histogram > 0 and rising
RSI crosses above 30 (if reversal signal)
EMA Pullback shows ▲ purple
🎯 Trade Management
Entry: According to ENTRY label
Stop Loss: According to STOP LOSS label
Take Profit: TP1 → TP2 → TP3
📉 SHORT ENTRY
✅ Entry Conditions
SELL signal appears
SuperTrend turns from green to red
Price < SMA 13
Braid Filter confirms (red)
Trend Panel shows "Bearish" across multiple TFs
📊 Additional Confirmations
MACD Histogram < 0 and declining
RSI crosses below 70 (if reversal signal)
EMA Pullback shows ▼ purple
🎯 Trade Management
Entry: According to ENTRY label
Stop Loss: According to STOP LOSS label
Take Profit: TP1 → TP2 → TP3
🎛️ RECOMMENDED SETTINGS
👥 For Beginners
Sensitivity: 6
Candle Colors: Version 1
Buy/Sell Signals: ON
Reversal Signals: OFF
Trend Panel: ON
🏆 For Experienced Traders
Sensitivity: 4–8 (depending on market)
Reversal Signals: ON
Pullback: ON
All indicators: ON
ATR SL Risk: 1.5–2.0
⚡ For Scalping
Sensitivity: 8–12
Timeframes: 1m, 3m, 5m
Use only: SuperTrend + Braid Filter
Quick TP: Only TP1
📊 For Swing Trading
Sensitivity: 4–6
Timeframes: 1H, 4H, 1D
Use all: Full signals
TP: All 3 levels (TP1, TP2, TP3)
⚠️ IMPORTANT NOTES
🔴 Avoid Trading When
Signals conflict across timeframes
Market is strongly ranging/sideways
Abnormally low volume
Price is at major support/resistance zones
🟢 Prefer Trading When
At least 2–3 confirmations align
Clear trend across multiple timeframes
Strong volume surge
Breakout from consolidation zone
💡 Usage Tips
Always wait for confirmation: Never enter with just 1 signal
Risk management: Place SL according to STOP LOSS label
Follow trend panel: Prioritize overall trend
Use multiple timeframes: Analyze top-down
Backtest first: Test strategy on historical data
🛠️ TROUBLESHOOTING
❓ No signals appear
Check if inputs are enabled
Adjust sensitivity
Try switching timeframe
❓ Too many false signals
Lower sensitivity
Increase Braid Filter strength
Trade only with main trend
❓ Trend panel not showing
Enable "Display Dashboard"
Select proper panel position
Adjust panel size
📞 SUPPORT
If you encounter issues using this script, please:
Carefully read this guide
Practice on a demo account
Backtest thoroughly before live trading
📈 Wishing you successful trading! 🚀
Alt Season vs USDT Flow DashboardWhat the script tells you (the signals)
It builds four “alt vs stables” lenses and colors the background when they agree.
ALT ex-ETH / STABLES (TOTAL3 / (USDT+USDC+DAI))
Think: “How much alt cap per $1 of dry-powder stables?”
Bullish when price is above its 200-day SMA and rising → risk appetite expanding toward smaller alts.
ALT Share of Risk-On ((TOTAL − STABLES − BTC − ETH) / (TOTAL − STABLES))
Of the non-stable crypto pie, how much is flowing to ex-BTC/ETH alts?
Uptrend = broadening alt participation (late-early to mid alt-season behavior).
Dominance Spread ((TOTAL3 / TOTAL) − (STABLES / TOTAL))
Alts’ share minus stables’ share.
Widening spread means stables are being converted into alts (not just into BTC).
Flow Ratio ROC(TOTAL3, N) / ROC(STABLES, N) (default N=30 days)
Compares alts’ growth rate to stable supply growth.
> 1 and sustained → alts expanding faster than new “dry powder” is appearing.
The background color (“regime”)
Green (ALT-on) when all three conditions align:
ALT/Stable > its SMA
Dominance Spread > its SMA
Flow Ratio > 1
Red (ALT-off) when the opposite holds.
No color = mixed/chop.
How to read it (quick playbook)
Early alt-season tell:
BTC.D starts to slip, total market cap (TOTAL) rising.
ALT/Stable breaks above its 200-SMA and stays there.
Dominance Spread climbs (alts gaining share, stables losing share).
Flow Ratio > 1 for a few weeks.
Maturing phase: ALT Share of Risk-On rises (money broadens from ETH/L1s → mid/small caps).
Exhaustion/false start: Flow Ratio dips < 1 or ALT/Stable loses the 200-SMA while BTC.D stabilizes or rises.
Practical tips
Timeframes: Make calls on 1D. Use 1W to avoid whipsaw; use 4H only for entries once the 1D regime is green.
Smoothing: If you see noisy spikes from market-cap revisions, add a light smoother (e.g., 7D SMA on the plotted lines).
Parameters:
Try ROC length 21–45 days.
Try SMA 150–250 days (200 is a good middle).
Confluence: Keep BTC.D and ETH.D in another pane. Best alt windows: BTC.D trending down, ETH.D flat-to-up initially, then ETH.D flattens as TOTAL3 momentum spreads to mid/small caps.
Risk checks: If USDT.D/USDC.D (stable dominance) spike up while your signals are green, that’s a caution flag (capital retreating to stables).

EMA 20–55 + SMMA50 (20↔55 Band, Alerts, Color Controls)This script plots a customizable EMA ribbon and a smoothed moving average (SMMA).
Key features:
EMA 20 (blue) and EMA 55 (yellow) highlighted with a green/red background ribbon depending on trend.
Optional middle EMAs (25, 30, 35, 40, 45, 50) can be shown or hidden.
SMMA (50) plotted in white as a trend smoother.
Customizable line colors, band colors, and transparency.
Alerts for EMA20/EMA55 bullish or bearish crossovers.
Optional candle bar coloring based on trend.
This is useful for quickly spotting medium-term trend shifts when EMA20 crosses EMA55, while still tracking the broader EMA ribbon context.

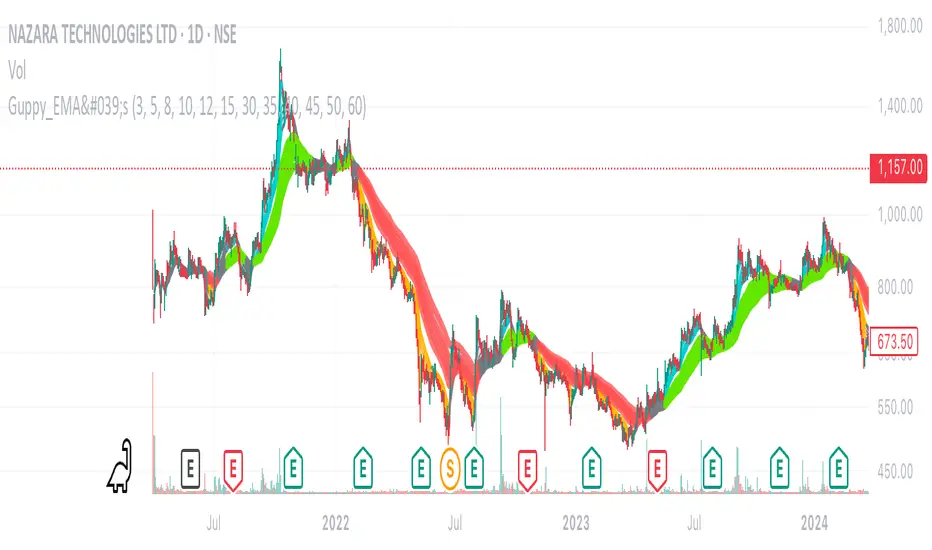
Daryl Guppy's Multiple Moving Averages - GMMAThe Guppy EMAs indicator (Daryl Guppy’s method) displays two groups of exponential moving averages (EMAs) on the chart:
Fast EMA group: 3, 5, 8, 10, 12, 15 periods (thinner, more responsive lines)
Slow EMA group: 30, 35, 40, 45, 50, 60 periods (thicker, smoother lines)
Color Logic:
Fast EMAs turn AQUA if all fast EMAs are in bullish alignment and slow EMAs are in bullish alignment.
Fast EMAs turn ORANGE if all fast EMAs are in bearish alignment and slow EMAs are in bearish alignment.
Otherwise, fast EMAs appear GRAY.
Slow EMAs turn LIME when in bullish order, RED when bearish, and remain GRAY otherwise.
The area between the outermost fast EMAs and slow EMAs is filled with a semi-transparent silver color for visual emphasis.
Aura Trail Bitcoin H1 StrategyAuraTrail Bitcoin H1 Strategy is a meticulously crafted trend-following system designed for the Bitcoin H1 timeframe. It leverages powerful candlestick patterns and robust trailing stop logic to identify and capitalize on sustained market movements, while actively managing risk.
Strategy Logic
Signal Identification: The strategy's core is based on classic reversal candlestick patterns: the Hammer for bullish entry signals and the Shooting Star for bearish signals. It waits for the confirmation of these patterns on the previous bar.
Long Entry: A long trade is initiated when a confirmed Hammer pattern appears. The entry is placed as a pending order at the high of the previous day, aiming to enter the trade only if the bullish momentum continues.
Short Entry: A short trade is triggered upon a confirmed Shooting Star pattern. The entry is a pending order at the low of the previous day, designed to capture further downside movement.
Risk Management: The initial stop-loss is calculated based on the previous day's open and bar range. The strategy then uses a dynamic Trailing Stop based on a combination of short-term (45-period) and long-term (95-period) Average True Range (ATR) to lock in profits as the trade moves favorably.
Money Management: Position size is dynamically adjusted based on a configurable multiplier, which can be tailored to manage pyramiding or scaling into a position, ensuring controlled risk exposure.
Parameters
Initial Lots: Defines the starting position size for the first trade.
Lot Multiplier: Adjusts position size for subsequent entries in a pyramiding sequence.
Trailing Stop Coefficient: A multiplier for ATR to set the trailing stop distance.
Trailing Activation Coefficient: A multiplier for ATR to determine when the trailing stop becomes active.
Profit Target %: Defines a percentage gain for profit-taking.
Setup
Timeframe: 1-Hour (H1)
Asset: Bitcoin, also suitable for other volatile assets with clear candlestick patterns and trending behavior.

Multi-TF Trend Table (Configurable)1) What this tool does (in one minute)
A compact, multi‑timeframe dashboard that stacks eight timeframes and tells you:
Trend (fast MA vs slow MA)
Where price sits relative to those MAs
How far price is from the fast MA in ATR terms
MA slope (rising, falling, flat)
Stochastic %K (with overbought/oversold heat)
MACD momentum (up or down)
A single score (0%–100%) per timeframe
Alignment tick when trend, structure, slope and momentum all agree
Use it to:
Frame bias top‑down (M→W→D→…→15m)
Time entries on your execution timeframe when the higher‑TF stack is aligned
Avoid counter‑trend traps when the table is mixed
2) Table anatomy (each column explained)
The table renders 9 columns × 8 rows (one row per timeframe label you define).
TF — The label you chose for that row (e.g., Month, Week, 4H). Cosmetic; helps you read the stack.
Trend — Arrow from fast MA vs slow MA: ↑ if fastMA > slowMA (up‑trend), ↓ otherwise (down‑trend). Cell is green for up, red for down.
Price Pos — One‑character structure cue:
🔼 if price is above both fast and slow MAs (bullish structure)
🔽 if price is below both (bearish structure)
– otherwise (between MAs / mixed)
MA Dist — Distance of price from the fast MA measured in ATR multiples:
XS < S < M < L < XL according to your thresholds (see §3.3). Useful for judging stretch/mean‑reversion risk and stop sizing.
MA Slope — The fast MA one‑bar slope:
↑ if fastMA - fastMA > 0
↓ if < 0
→ if = 0
Stoch %K — Rounded %K value (default 14‑1‑3). Background highlights when it aligns with the trend:
Green heat when trend up and %K ≤ oversold
Red heat when trend down and %K ≥ overbought Tooltip shows K and D values precisely.
Trend % — Composite score (0–100%), the dashboard’s confidence for that timeframe:
+20 if trendUp (fast>slow)
+20 if fast MA slope > 0
+20 if MACD up (signal definition in §2.8)
+20 if price above fast MA
+20 if price above slow MA
Background colours:
≥80 lime (strong alignment)
≥60 green (good)
≥40 orange (mixed)
<40 grey (weak/contrary)
MACD — 🟢 if EMA(12)−EMA(26) > its EMA(9), else 🔴. It’s a simple “momentum up/down” proxy.
Align — ✔ when everything is in gear for that trend direction:
For up: trendUp and price above both MAs and slope>0 and MACD up
For down: trendDown and price below both MAs and slope<0 and MACD down Tooltip spells this out.
3) Settings & how to tune them
3.1 Timeframes (TF1–TF8)
Inputs: TF1..TF8 hold the resolution strings used by request.security().
Defaults: M, W, D, 720, 480, 240, 60, 15 with display labels Month, Week, Day, 12H, 8H, 4H, 1H, 15m.
Tips
Keep a top‑down funnel (e.g., Month→Week→Day→H4→H1→M15) so you can cascade bias into entries.
If you scalp, consider D, 240, 120, 60, 30, 15, 5, 1.
Crypto weekends: consider 2D in place of W to reflect continuous trading.
3.2 Moving Average (MA) group
Type: EMA, SMA, WMA, RMA, HMA. Changes both fast & slow MA computations everywhere.
Fast Length: default 20. Shorten for snappier trend/slope & tighter “price above fast” signals.
Slow Length: default 200. Controls the structural trend and part of the score.
When to change
Swing FX/equities: EMA 20/200 is a solid baseline.
Mean‑reversion style: consider SMA 20/100 so trend flips slower.
Crypto/indices momentum: HMA 21 / EMA 200 will read slope more responsively.
3.3 ATR / Distance group
ATR Length: default 14; longer makes distance less jumpy.
XS/S/M/L thresholds: define the labels in column MA Dist. They are compared to |close − fastMA| / ATR.
Defaults: XS 0.25×, S 0.75×, M 1.5×, L 2.5×; anything ≥L is XL.
Usage
Entries late in a move often occur at L/XL; consider waiting for a pullback unless you are trading breakouts.
For stops, an initial SL around 0.75–1.5 ATR from fast MA often sits behind nearby noise; use your plan.
3.4 Stochastic group
%K Length / Smoothing / %D Smoothing: defaults 14 / 1 / 3.
Overbought / Oversold: defaults 70 / 30 (adjust to 80/20 for trendier assets).
Heat logic (column Stoch %K): highlights when a pullback aligns with the dominant trend (oversold in an uptrend, overbought in a downtrend).
3.5 View
Full Screen Table Mode: centers and enlarges the table (position.middle_center). Great for clean screenshots or multi‑monitor setups.
4) Signal logic (how each datapoint is computed)
Per‑TF data (via a single request.security()):
fastMA, slowMA → based on your MA Type and lengths
%K, %D → Stoch(High,Low,Close,kLen) smoothed by kSmooth, then %D smoothed by dSmooth
close, ATR(atrLen) → for structure and distance
MACD up → (EMA12−EMA26) > EMA9(EMA12−EMA26)
fastMA_prev → yesterday/previous‑bar fast MA for slope
TrendUp → fastMA > slowMA
Price Position → compares close to both MAs
MA Distance Label → thresholds on abs(close − fastMA)/ATR
Slope → fastMA − fastMA
Score (0–100) → sum of the five 20‑point checks listed in §2.7
Align tick → conjunction of trend, price vs both MAs, slope and MACD (see §2.9)
Important behaviour
HTF values are sampled at the execution chart’s bar close using Pine v6 defaults (no lookahead). So the daily row updates only when a daily bar actually closes.
5) How to trade with it (playbooks)
The table is a framework. Entries/exits still follow your plan (e.g., S/D zones, price action, risk rules). Use the table to know when to be aggressive vs patient.
Playbook A — Trend continuation (pullback entry)
Look for Align ✔ on your anchor TFs (e.g., Week+Day both ≥80 and green, Trend ↑, MACD 🟢).
On your execution TF (e.g., H1/H4), wait for Stoch heat with the trend (oversold in uptrend or overbought in downtrend), and MA Dist not at XL.
Enter on your trigger (break of pullback high/low, engulfing, retest of fast MA, or S/D first touch per your plan).
Risk: consider ATR‑based SL beyond structure; size so 0.25–0.5% account risk fits your rules.
Trail or scale at M/L distances or when score deteriorates (<60).
Playbook B — Breakout with confirmation
Mixed stack turns into broad green: Trend % jumps to ≥80 on Day and H4; MACD flips 🟢.
Price Pos shows 🔼 across H4/H1 (above both MAs). Slope arrows ↑.
Enter on the first clean base‑break with volume/impulse; avoid if MA Dist already XL.
Playbook C — Mean‑reversion fade (advanced)
Use only when higher TFs are not aligned and the row you trade shows XL distance against the higher‑TF context. Take quick targets back to fast MA. Lower win‑rate, faster management.
Playbook D — Top‑down filter for Supply/Demand strategy
Trade first retests only in the direction where anchor TFs (Week/Day) have Align ✔ and Trend % ≥60. Skip counter‑trend zones when the stack is red/green against you.
6) Reading examples
Strong bullish stack
Week: ↑, 🔼, S/M, slope ↑, %K=32 (green heat), Trend 100%, MACD 🟢, Align ✔
Day: ↑, 🔼, XS/S, slope ↑, %K=45, Trend 80%, MACD 🟢, Align ✔
Action: Look for H4/H1 pullback into demand or fast MA; buy continuation.
Late‑stage thrust
H1: ↑, 🔼, XL, slope ↑, %K=88
Day/H4: only 60–80%
Action: Likely overextended on H1; wait for mean reversion or multi‑TF alignment before chasing.
Bearish transition
Day flips from 60%→40%, Trend ↓, MACD turns 🔴, Price Pos “–” (between MAs)
Action: Stand aside for longs; watch for lower‑high + Align ✔ on H4/H1 to join shorts.
7) Practical tips & pitfalls
HTF closure: Don’t assume a daily row changed mid‑day; it won’t settle until the daily bar closes. For intraday anticipation, watch H4/H1 rows.
MA Type consistency: Changing MA Type changes slope/structure everywhere. If you compare screenshots, keep the same type.
ATR thresholds: Calibrate per asset class. FX may suit defaults; indices/crypto might need wider S/M/L.
Score ≠ signal: 100% does not mean “must buy now.” It means the environment is favourable. Still execute your trigger.
Mixed stacks: When rows disagree, reduce size or skip. The tool is telling you the market lacks consensus.
8) Customisation ideas
Timeframe presets: Save layouts (e.g., Swing, Intraday, Scalper) as indicator templates in TradingView.
Alternative momentum: Replace the MACD condition with RSI(>50/<50) if desired (would require code edit).
Alerts: You can add alert conditions for (a) Align ✔ changes, (b) Trend % crossing 60/80, (c) Stoch heat events. (Not shipped in this script, but easy to add.)
9) FAQ
Q: Why do I sometimes see a dash in Price Pos? A: Price is between fast and slow MAs. Structure is mixed; seek clarity before acting.
Q: Does it repaint? A: No, higher‑TF values update on the close of their own bars (standard request.security behaviour without lookahead). Intra‑bar they can fluctuate; decisions should be made at your bar close per your plan.
Q: Which columns matter most? A: For trend‑following: Trend, Price Pos, Slope, MACD, then Stoch heat for entries. The Score summarises, and Align enforces discipline.
Q: How do I integrate with ATR‑based risk? A: Use the MA Dist label to avoid chasing at extremes and to size stops in ATR terms (e.g., SL behind structure at ~1–1.5 ATR).

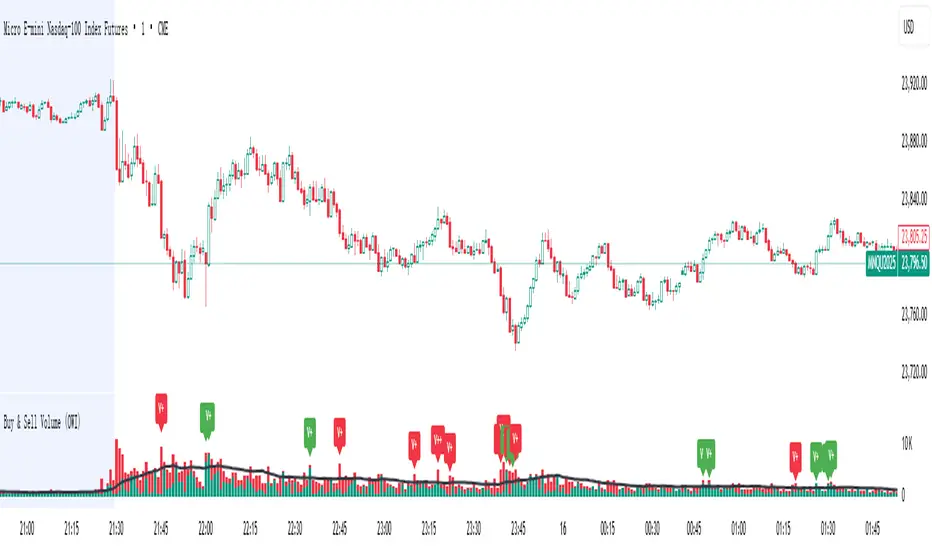
Buy & Sell Volume (OWI)📊 Buy & Sell Volume (OWI) Indicator Guide
The Buy & Sell Volume (OWI) indicator is designed to provide a visual breakdown of buying and selling pressure in each candle, helping traders identify volume surges and potential market moves. It also includes a time filter to focus analysis during key trading hours.
⚙️ Setup & Inputs
When adding the indicator to your chart, you'll see several configurable inputs:
SMA Length : Sets the period for the Simple Moving Average (SMA) of total volume.
Enable Time Filter : Toggles whether to restrict analysis to US market hours (Eastern Time). |
Start Hour/Minute : Defines the beginning of the time filter window (default: 9:45 ET). |
End Hour/Minute : Defines the end of the time filter window (default: 16:15 ET). |
📈 How It Works
🔍 Volume Breakdown
Buy Volume: Estimated volume attributed to buyers, calculated based on candle position.
Sell Volume: Estimated volume attributed to sellers.
Total Volume SMA: A moving average of total volume to benchmark current activity.
⏰ Time Filter (Optional)
When enabled, the indicator only highlights volume spikes during the specified US market hours. This helps filter out noise from pre-market or after-hours trading.
🚨 Highlight Conditions
The indicator flags significant volume spikes with labels above the volume bars:
| Label | Condition |
| V+ | Volume is between 1.5× and 2× the SMA, during market hours (if enabled). |
| V++ | Volume exceeds 2× the SMA, during market hours (if enabled). |
💡 Tips
- Use shorter SMA lengths for more reactive volume analysis.
- Change the time filter if you're trading outside US market hours.
- Combine with candlestick patttern to confirm breakout or reversal signals.
ABS NR — Fail-Safe Confirm (v4.2.2)
# ABS NR — Fail-Safe Confirm (v4.2.2)
## What it is (quick take)
**ABS NR FS** is a **non-repainting “arm → confirm” entry framework** for intraday and swing execution. It blends:
* **Regime** (EMA stack + 60-min slope),
* **Location** (Keltner basis/edges),
* **Stretch** (session-anchored **VWAP Z-score**),
* **Momentum gating** (TSI cross/slope),
* **Guards** (session window, minimum ATR%, gap filter, optional market alignment).
You’ll see a **small dot** when a setup is **armed** (candidate) and a **triangle** when that setup **confirms** within a user-defined number of bars. A **gray “X”** marks a timeout (candidate canceled).
> Tip: This entry tool works best when paired with a trend context filter and a dedicated exit tool.
---
## How to use it (operational workflow)
1. **Read the regime**
* **Bull trend**: fast > slow > long EMA **and** 60-min slope up.
* **Bear trend**: fast < slow < long EMA **and** 60-min slope down.
* **Range**: neither bull nor bear.
2. **Wait for a candidate (dot)**
Two families:
* **Reclaim (trend-following):** price crosses the **KC basis** with acceptable |Z| (not overstretched) and passes the TSI gate.
* **Fade (range-revert):** price **pokes a KC band**, prints a **reversal wick**, |Z| is stretched, and TSI gate agrees.
3. **Trade the confirmation (triangle)**
The confirm must occur **within N bars** and follow your chosen **Confirm mode** logic (see Inputs). If confirmation doesn’t arrive in time, an **X** cancels the candidate.
4. **Use guards to avoid junk**
Session windows (US focus), minimum ATR%, gap guard, and optional **market alignment** (e.g., SPY above EMA20 for longs).
5. **Manage the position**
* Entries: take **triangles** in the direction of your playbook (reclaims with trend; fades in clean ranges).
* Filters and exits: use your own process or pair with a trend/exit companion.
---
## Visual semantics & alerts
* **Candidate L / S (dot)** → a setup armed on this bar.
* **CONFIRM L / S (triangle)** → actionable signal that met confirm rules within your time window.
* **Cancel L / S (X)** → candidate expired without confirmation; ignore the dot.
**Alerts (stable names for automation):**
* **ABS FS — Confirmed** → fires on confirmed long or short.
* **ABS FS — Candidate Armed** → fires as a candidate arms.
---
## Non-repainting behavior (why signals don’t repaint)
* All HTF requests use **lookahead\_off**.
* With **Strict NR = true**, the 60-min slope uses the **prior completed** 60-min bar and arming/confirming only occurs on confirmed bars.
* Confirmation triangles finalize on bar close.
* If you disable strictness, signals may appear slightly earlier but with more intrabar sensitivity.
---
## Inputs reference (what each control does and the trade-offs)
### A) Behavior / Modes
**Mode** (`Turbo / Aggressive / Balanced / Conservative`)
Changes multiple internal thresholds:
* **Turbo** → most signals; relaxes prior-bar break & VWAP-side checks and time/vol/gap guards. Highest frequency, highest noise.
* **Aggressive** → more signals than Balanced, fewer than Turbo.
* **Balanced** → default; steady trade-off of frequency vs. quality.
* **Conservative** → tightens |Z| and other checks; fewest but cleanest signals.
**Strict NR (bar close + prior HTF 60m)**
* **true** = safer: uses prior 60-min slope; arms/confirms on confirmed bars → **fewer/cleaner** signals.
* **false** = earlier and more reactive; slightly noisier.
---
### B) Keltner Channel (location engine)
* **KC EMA Length (`kcLen`)**
Higher → smoother basis (fewer basis crosses). Lower → snappier basis (more crosses).
* **ATR Length (`atrLen`)**
Higher → steadier band width; Lower → more reactive band width.
* **KC ATR Mult (`kcMult`)**
Higher → wider bands (fewer edge pokes → fewer fades). Lower → narrower (more fades).
---
### C) Trend & HTF slope
* **Trend EMA Fast/Slow/Long (`emaFastLen / emaSlowLen / emaLongLen`)**
Larger = slower regime flips (fewer reclaims); smaller = faster flips (more reclaims).
* **HTF EMA Len (60m) (`htfLen`)**
Larger = steadier HTF slope (fewer signals); smaller = more sensitive (more signals).
---
### D) VWAP Z-Score (stretch / mean-revert logic)
* **VWAP Z-Length (`zLen`)**
Window for Z over session-anchored VWAP distance. Larger = smoother |Z| (fewer fades/re-entries). Smaller = more reactive (more).
* **Range Fade |Z| (base) (`zFadeBase`)**
Minimum |Z| to allow **fades** in ranges. Raise to demand more stretch (fewer fades). Lower to take more fades.
* **Max |Z| Trend Re-entry (base) (`maxZTrendBase`)**
Caps how stretched price can be and still permit **reclaims** with trend. Lower = stricter (avoid chases). Higher = will chase further.
---
### E) TSI Momentum Gate
* **TSI Long/Short/Signal (`tsiLong / tsiShort / tsiSig`)**
Larger = smoother/laggier momentum; smaller = snappier.
* **TSI gate (`CrossOnly / CrossOrSlope / Off`)**
* **CrossOnly**: require TSI cross of its signal (strict).
* **CrossOrSlope**: cross *or* favorable slope (balanced default).
* **Off**: no momentum gate (most signals, most noise).
---
### F) Guards (filters to avoid low-quality tape)
* **US focus 09:35–10:30 & 14:00–15:45 (base) (`useTimeBase`)**
`true` limits to high-quality windows. `false` trades all session.
* **Skip N bars after 09:30 ET (`skipFirst`)**
Skips the open scramble. Larger = skip longer.
* **Min volatility ATR% (base)** = `useVolMinBase` + `atrPctMinBase`
Requires `ATR(10)/Close*100 ≥ atrPctMinBase`. Raise threshold to avoid dead tape; lower to accept quieter sessions.
* **Gap guard (base)** = `gapGuardBase` + `gapMul`
Blocks signals when the opening gap exceeds `gapMul * ATR`. Increase `gapMul` to allow more gapped opens; decrease to be stricter.
---
### G) Visuals & Sides
* **Plot Keltner (`plotKC`)** → show/hide basis & bands.
* **Show Longs / Show Shorts** → enable/disable each side.
---
### H) Fail-Safe Confirmation
* **Confirm mode (`BreakHighOnly / BreakHigh+Hold / TwoBarImpulse`)**
* **BreakHighOnly**: confirm by taking out the armed bar’s extreme. Fastest, most frequent.
* **BreakHigh+Hold**: must **break**, have **body ≥ X·ATR**, **and** hold above/below the basis → higher quality, fewer signals.
* **TwoBarImpulse**: decisive follow-through vs. prior bar with **body ≥ X·ATR** → momentum-biased confirmations.
* **Confirm within N bars (`confirmBars`)**
Confirmation window size. Smaller = faster validation; larger = more patience (can be later).
* **Impulse body ≥ X·ATR (`impulseBodyATR`)**
Raise for stronger confirmations (fewer weak triangles). Lower to accept lighter pushes.
* **Require market alignment (`needMarket`) + `marketTicker`**
When enabled: Longs require **market > EMA20 (5m)**; Shorts require **market < EMA20 (5m)**.
* **Diagnostics: Show debug letters (`debug`)**
Tiny “B/C” audit marks for base/confirm while tuning.
---
## Tuning recipes (quick, practical)
* **If you’re getting chopped:**
* Set **Mode = Conservative**
* **Confirm mode = BreakHigh+Hold**
* Raise **impulseBodyATR** (e.g., 0.45)
* Keep **needMarket = true**
* Keep **Strict NR = true**
* **If you need more signals:**
* **Mode = Aggressive** (or Turbo if you accept more noise)
* **Confirm mode = BreakHighOnly**
* Lower **impulseBodyATR** (0.25–0.30)
* Increase **confirmBars** to 3
* **Range-day focus (fades):**
* Keep session guard on
* Raise **zFadeBase** to demand real stretch
* Keep **maxZTrendBase** moderate (don’t chase)
* **Trend-day focus (reclaims):**
* Slightly **lower `maxZTrendBase`** (avoid chasing excessive stretch)
* Use **CrossOrSlope** TSI gating
* Consider turning **needMarket** on
---
## Best practices & notes
* **Instrument specificity:** Tune Z, TSI, and guards per symbol and timeframe.
* **Session awareness:** Session filter uses **exchange-local** time; adjust for non-US markets.
* **Automation:** Use the two provided alert names; they’re stable.
* **Risk management:** Confirmation improves quality but doesn’t remove risk. Always pre-define stop/size logic.
---
## Suggested starting point (balanced profile)
* **Mode = balanced**
* **Strict NR = true**
* **Confirm mode = BreakHigh+Hold**
* **confirmBars = 2**
* **impulseBodyATR ≈ 0.35**
* **needMarket = off** (turn on for extra confluence)
* Leave Keltner/TSI defaults; then nudge `zFadeBase` and `maxZTrendBase` to match your symbol.
---
*This tool is a signal generator, not a broker or strategy. Validate on your markets/timeframes and integrate with your risk plan.*

OPR — DAX or USEnglish
This indicator automatically plots the Opening Price Range (OPR) for different indices, with customizable start and end times for each instrument.
For the DAX, it draws the high (green), low (red), and midline (grey dotted) for the specified range, defaulting to 09:00–09:15, and extends the lines until the selected end time (default 11:00).
For US indices (Dow Jones, Nasdaq, S&P500), it applies the same logic for the default 15:30–15:45 range, with two vertical black bars marking the start and end of the time window.
Each symbol only displays its own relevant lines (e.g., viewing DAX will only show DAX markers).
Parameters allow adjusting times and visibility for each market.
Key Session Levels (KUUUMZ)
📜 Summary
Tired of manually drawing the same key levels every single trading day? The KUUMZ-Key Session Levels indicator automates this entire process, plotting the most critical intraday and previous day levels directly on your chart. This tool provides a clean, dynamic framework of potential support and resistance zones, allowing you to focus on your trading strategy, not on chart setup.
Built for day traders and scalpers of US equities, this indicator helps you instantly visualize the market's structure from the moment the session begins.
🎯 Key Levels Plotted
This indicator automatically identifies and draws horizontal lines for the following session levels:
Previous Day High (PDH) & Low (PDL): The highest and lowest points of the prior trading day, which often act as major psychological support and resistance magnets.
Pre-Market High & Low (PMH/PML): The range established during the pre-market session (4:00 - 9:30 AM ET). A breakout from this range can often signal the initial directional bias.
5-Minute Opening Range High & Low (OR5): The high and low of the first 5 minutes of the regular session (9:30 - 9:35 AM ET). A crucial level for opening range breakout (ORB) strategies.
15-Minute Opening Range High & Low (OR15): The high and low of the first 15 minutes (9:30 - 9:45 AM ET), providing a slightly broader view of the initial balance area.
📈 How to Use This Indicator
These levels are fundamental to many intraday trading strategies:
Support & Resistance: Watch how price reacts as it approaches these levels. A bounce or rejection can signal a potential reversal, while a clean break can indicate continuation.
Breakout Trading: A strong, high-volume move through one of these levels (e.g., breaking above the Pre-Market High) can be an entry signal for a breakout trade.
Market Context: Quickly gauge market sentiment. Is the price trading above or below the previous day's range? Is it trapped within the opening range? These levels provide immediate context to the current price action.
Setting Targets & Stops: Use these levels to set logical profit targets or place stop-loss orders. For example, if you go long on a breakout of the 5-min OR, the Pre-Market High or Previous Day High could be your first target.
⚙️ Features & Customization
The script is designed to be flexible and clean, allowing you to tailor it to your specific charting style.
Toggle Any Level: Enable or disable any set of levels (Previous Day, Pre-Market, etc.) to reduce clutter.
Full Style Control: Customize the Color, Width, and Style (Solid, Dotted, Dashed) for each pair of high/low lines independently.
Optional Labels: A master switch allows you to show or hide all price labels (like "PDH", "PM Low", etc.) with a single click.
Automatic & Dynamic: Levels are calculated and drawn in real-time as each session concludes and are automatically cleared and reset for the next trading day.

TCP | Market Session | Session Analyzer📌 TCP | Market Session Indicator | Crypto Version
A powerful, real-time market session visualization tool tailored for crypto traders. Track the heartbeat of Asia, Europe, and US trading hours directly on your chart with live session boxes, behavioral analysis, liquidity grab detection, and countdown timers. Know when the action starts, how the market behaves, and where the traps lie.
🔰 Introduction:
Trade the Right Hours with the Right Tools
Time matters in trading. Most significant moves happen during key sessions—and knowing when and how each session unfolds can give you a sharp edge. The TCP Market Session Indicator, developed by Trade City Pro (TCP), puts professional session tracking and behavioral insights at your fingertips.
Whether you're a scalper or swing trader, this indicator gives you the timing context to enter and exit trades with greater confidence and clarity.
🕒 Core Features
• Live Session Boxes :
Highlight active ranges during Asia, Europe, and US sessions with dynamic high/low updates.
• Session Start/End Labels :
Know exactly when each session begins and ends plotted clearly on your chart with context.
• Session Behavior Analysis :
At the end of each session, the indicator classifies the price action as:
- Trend Up
- Trend Down
- Consolidation
- Manipulation
• Liquidity Grab Detection: Automatically detects possible stop hunts (fake breakouts) and marks them on the chart with precision filters (volume, ATR, reversal).
• Session Countdown Table: A live dashboard showing:
- Current active session
- Time left in session
- Upcoming session and how many minutes until it starts
- Utility time converter (e.g. 90 min = 01:30)
• Vertical Session Lines: Visualize past and upcoming session boundaries with customizable history and future range.
• Multi-Day Support: Draw session ranges for previous, current, and future days for better backtesting and forecasting.
⚙️ Settings Panel
Customize everything to fit your trading style and schedule:
• Session Time Settings:
Set the opening and closing time for each session manually using UTC-based minute inputs.
→ For example, enter Asia Start: 0, Asia End: 480 for 00:00–08:00 UTC.
This gives full flexibility to adjust session hours to match your preferred market behavior.
• Enable or Disable Elements:
Toggle the visibility of each session (Asia, Europe, US), as well as:
- Session Boxes
- Countdown Table
- Session Lines
- Liquidity Grab Labels
• Timezone Selection:
Choose between using UTC or your chart’s local timezone for session calculations.
• Customization Options:
Select number of past and future days to draw session data
Adjust vertical line transparency
Fine-tune label offset and spacing for clean layout
📊 Smart Session Boxes
Each session box tracks high, low, open, and close in real time, providing visual clarity on market structure. Once a session ends, the box closes, and the behavior type is saved and labeled ideal for spotting patterns across sessions.
• Asia: Green Box
• Europe: Orange Box
• US: Blue Box
💡 Why Use This Tool?
• Perfect Timing: Don’t get chopped in low-liquidity hours. Focus on sessions where volume and volatility align.
• Pattern Recognition: Study how price behaves session-to-session to build better strategies.
• Trap Detection: Spot manipulation moves (liquidity grabs) early and avoid common retail pitfalls.
• Macro Session Mapping: Use as a foundational layer to align trades with market structure and news cycles.
🔍 Example Use Case
You're watching BTC at 12:45 UTC. The indicator tells you:
The Asia session just ended (label shows “Asia Session End: Trend Up”)
Europe session starts in 15 minutes
A liquidity grab just triggered at the previous high—label confirmed
Now you know who’s active, what the market just did, and what’s about to start—all in one glance.
✅ Why Traders Trust It
• Visual & Intuitive: Fully chart-based, no clutter, no guessing
• Crypto-Focused: Designed specifically for 24/7 crypto markets (not outdated forex models)
• Non-Repainting: All labels and boxes stay as printed—no tricks
• Reliable: Tested across multiple exchanges, pairs, and timeframes
🧩 Built by Trade City Pro (TCP)
The TCP Market Session Indicator is part of a suite of professional tools used by over 150,000 traders. It’s coded in Pine Script v6 for full compatibility with TradingView’s latest capabilities.
🔗 Resources
• Tutorial: Learn how to analyze sessions like a pro in our TradingView guide:
"TradeCityPro Academy: Session Mapping & Liquidity Traps"
• More Tools: Explore our full library of indicators on

Gold Killzone Bias Suite🟡 Gold Killzone Bias Suite
The Gold Killzone Bias Suite is an advanced institutional-grade tool designed to generate high-confidence directional bias for XAU/USD (Gold) during the London and New York killzones.
Built for traders using a structured, confluence-driven approach, this tool blends price action, smart money principles, momentum, and volume into a real-time bias engine with a clean, easy-to-read dashboard.
🔧 Key Features
🕰️ Session-Based Bias (London / New York)
Independent bias calculation per session
Killzone times customizable with timezone support
Background highlighting (blue/red) for each session
📊 VWAP Engine
Reclaim & rejection detection
VWAP deviation alerts
Daily HTF VWAP integration
Score impact based on VWAP behaviour
📉 Market Structure (CHoCH / BOS)
Detects swing highs/lows
Labels bullish/bearish CHoCHs
Structure score contributes to session bias
💧 Liquidity Grabs
Detects stop hunts above highs / below lows
Confirms with candle rejection (body % filter)
Plots labels and adds to bias scoring
⚡ Momentum Filters
RSI: Bullish >55, Bearish <45
MACD: Histogram + Signal Line crossovers
Combined momentum score used in bias
🧠 Smart Money Proximity
Optional FVG/OB score toggle (placeholder for custom logic)
Adds static confluence for proximity-based setups
⏫ Higher Time Frame Context
Daily VWAP comparison
4H high/low structure breaks
Adds trend score to current session bias
🧠 How Bias Works
The suite uses a scoring model. Each confluence adds or subtracts points:
VWAP reclaim/reject: ±30
CHoCH/BOS: ±30
Liquidity grab: ±20
RSI/MACD: ±10
FVG/OB Proximity: +10
Daily VWAP trend: ±10
H4 Trend Break: ±10
Final Bias:
Bullish if score ≥ +20
Bearish if score ≤ -20
Neutral if between -19 and +19
A confidence % (capped at 100) is also shown, along with the contributing confluences (VWAP, Structure, Liquidity, etc.).
📋 Dashboard
A real-time dashboard shows for each session:
Session name and time
Bias (Bullish / Bearish / Neutral)
Confidence (%)
Confluences used
Position can be moved (Top Left, Top Right, etc.). Designed to be unobtrusive yet informative.
🧪 Best Practices
Use on 15m / 5m charts for intraday setups
Confirm with D1 or H4 structure for directional context
Combine with OB/FVG zones or SMT for entries
Use Trading View alerts for bias flips or liquidity grabs (custom logic can be added)
Bar Replay compatible for back testing and journaling bias shifts
🔐 Notes
Does not generate trade signals or alerts by default
Focused on bias generation and confluence stacking
Compatible with funded account trading models
📈 Built for traders who want a systematic, score-based approach to identifying directional edge in high-volume gold sessions.

Options Strategy V2.0📈 Options Strategy V2.0 – Intraday Reversal-Resilient Momentum System
Overview:
This strategy is designed specifically for intraday SPY, TSLA, MSFT, etc. options trading (0DTE or 1DTE), using high-probability signals derived from a confluence of technical indicators: EMA crossovers, RSI thresholds, ATR-based risk control, and volume spikes. The strategy aims to capture strong directional moves while avoiding overtrading, thanks to a built-in cooldown logic and optional time/session filters.
⚙️ Core Concept
The strategy executes trades only in the direction of the prevailing trend, determined by short- and long-term Exponential Moving Averages (EMA). Entry signals are generated when the Relative Strength Index (RSI) confirms momentum in the direction of the trend, and volume spikes suggest institutional activity.
To increase adaptability and user control, it includes a highly customizable parameter set for both long and short entries independently.
📌 Key Features
✅ Trend-Following Logic
Long entries are only allowed when EMA(short) > EMA(long)
Short entries are only allowed when EMA(short) < EMA(long)
✅ RSI Confirmation
Long: Requires RSI crossover above a configurable threshold
Short: Requires RSI crossunder below a configurable threshold
Optional rejection filters: Entry blocked above/below specific RSI extremes
✅ Volume Spike Filter
Confirms institutional participation by comparing current volume to an average multiplied by a user-defined factor.
✅ ATR-Based Risk Management
Both Stop Loss (SL) and Take Profit (TP) are dynamically calculated using ATR × a multiplier.
TP/SL ratio is fully configurable.
✅ Cooldown Control
After every trade, the system waits for a set number of bars before allowing new entries.
This prevents overtrading and increases signal quality.
Optionally, cooldown is ignored for reversal trades, ensuring the system can react immediately to a confirmed trend change.
✅ Candle Body Filter (Noise Control)
Avoids trades on candles with too small bodies relative to wicks (often noise or indecision candles).
✅ VWAP Confirmation (Optional)
Ensures price is trading above VWAP for long entries, or below for short entries.
✅ Time & Session Filters
Trades only during regular market hours (09:30–16:00 EST).
No-trade zone (e.g., 14:15–15:45 EST) to avoid low-liquidity traps or late-day whipsaws.
✅ End-of-Day Auto Close
All open positions are force-closed at 15:55 EST, protecting against overnight risk (especially relevant for 0DTE options).
📊 Visual Aids
EMA plots show trend direction
VWAP line provides real-time mean-reversion context
Stop Loss and Take Profit lines appear dynamically with each trade
Alerts notify of entry signals and exit triggers
🔧 Customization Panel
Nearly every element of the strategy can be tailored:
EMA lengths (short and long, for both sides)
RSI thresholds and length
ATR length, SL multiplier, and TP/SL ratio
Volume spike sensitivity
Minimum EMA distance filter
Candle body ratio filter
Session restrictions
Cooldown logic (duration + reversal exception)
This makes the strategy extremely versatile, allowing both conservative and aggressive configurations depending on the trader’s profile and the market context.
📌 Example Use Case: SPY Options (0DTE or 1DTE)
This system was designed and tested specifically for SPY and other intraday options trading, where:
Delta is around 0.50 or higher
Trades are short-lived (often 1–5 candles)
You aim to trade 1–3 signals per day, filtering out weak entries
🚫 Important Notes
It is not a scalping strategy; it relies on confirmed breakouts with trend support
No pyramiding or re-entries without cooldown to preserve risk integrity
Should be used with real-time alerts and manual broker execution
📈 Alerts Included
📈 Long Entry Signal
📉 Short Entry Signal
⚠️ Auto-closed all positions at 15:55 EST
✅ Proven Settings – Real Trades + Backtest Results
The current version of the strategy includes the optimal settings I’ve arrived at through extensive backtesting, as well as 3 months of real trading with consistent profitability. These results reflect real-world execution under live market conditions using 0DTE SPY options, with disciplined trade management and risk control.
🧠 Final Thoughts
Options Strategy V2.0 is a robust, highly tunable intraday strategy that blends momentum, trend-following, and volume confirmation. It is ideal for disciplined traders focused on SPY or other 0DTE/1DTE options, and it includes guardrails to reduce false signals and improve execution timing.
Perfect for those who seek precision, flexibility, and risk-defined setups—not blind automation.

1EMA + 1MACD + 1RSI Crypto Strategy AB 092Title: EMA + MACD + RSI Crypto Strategy
Overview:
This is a trend-following and momentum-based crypto trading strategy built for 1H, 4H, and 1D timeframes, combining three proven indicators:
EMA 50 & EMA 200 Crossover – identifies long-term trend direction.
MACD Crossover (12, 26, 9) – confirms momentum shift.
RSI Filter (14) – avoids overbought/oversold traps and refines entries.
Buy Entry Conditions:
EMA 50 > EMA 200 (Golden Cross)
MACD line crosses above signal line
RSI is between 45 and 70
Sell Entry Conditions:
EMA 50 < EMA 200 (Death Cross)
MACD line crosses below signal line
RSI is between 30 and 55
Risk Management:
Configurable Take Profit and Stop Loss percentages via inputs.
Default: 3% TP, 1.5% SL (adjustable based on timeframe and asset volatility).
Best For:
Intraday trades on 1H (BTC, ETH, SOL)
Swing trades on 4H
Position entries on 1D (top 50 altcoins)
This script includes visual Buy/Sell signals, alert conditions, and customizable SL/TP logic — making it a clean, actionable, and reliable strategy for crypto traders.

RSI Divergence(CompactFX)This is the standard "RSI" with "divergence" displayed. Additionally, it has the following features:
- The line color shifts above and below the RSI 50 threshold.
- The MA can be displayed on the RSI.
- Signs of an expected reversal are displayed.
**Examples of Use**
*For Swing Traders
In addition to using the standard RSI, the divergence display can serve as a trigger for further consideration.
*For Scalpers
For athletic traders who prefer intuition over logic and calculation, we recommend customizing the RSI color to your liking for bulls and bears. Consider extending the price until the RSI color changes. Below is my example.
-One-Minute Scalping
When prices are moving above the long-term and short-term MAs, you can hold a position as long as the RSI is above 55 (below 45 for bears). In this case, pivot signs can also be used as a guide for closing positions. Of course, this is best done during periods of high momentum. Five- and 15-minute scalping also works well. However, these only work if you adhere to my logic. Don't forget to adhere to your own logic and framework.
The above is just an example. Feel free to use it as you like.
