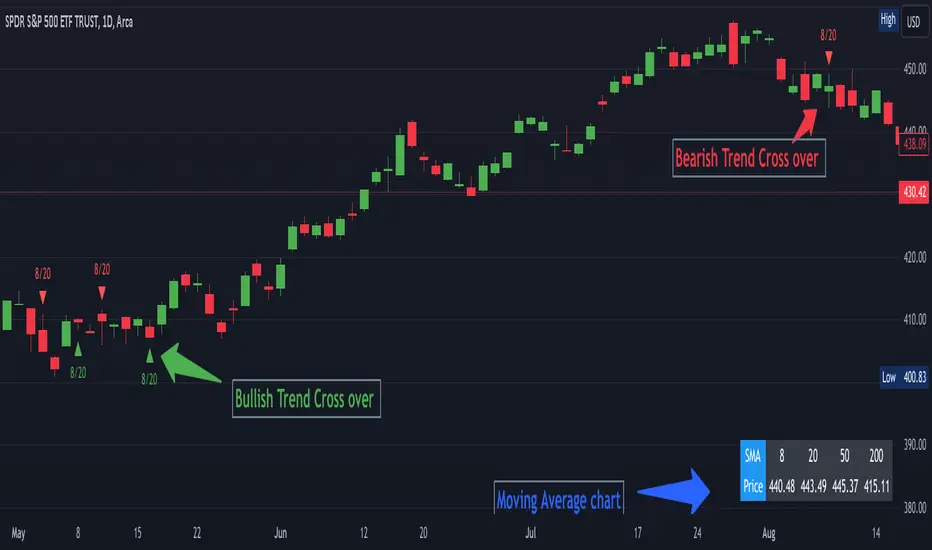
EMA20/50/200 + RSI Swing (Trend Filter)Using three different MA to identify the trend and enter when RSI under 70 or over 30
Cerca negli script per "流通市值在50亿至200亿之间的股票中,成交量持续放大的个股有哪些?"

SMA compression goal is to identify when the 20/50/200 SMA are with in a certain % of each other. ideally finding consolidation

Nifty50 Swing Trading Super Indicator# 🚀 Nifty50 Swing Trading Super Indicator - Complete Guide
**Created by:** Gaurav
**Date:** August 8, 2025
**Version:** 1.0 - Optimized for Indian Markets
---
## 📋 Table of Contents
1. (#quick-start-guide)
2. (#indicator-overview)
3. (#installation-instructions)
4. (#parameter-settings)
5. (#signal-interpretation)
6. (#trading-strategy)
7. (#risk-management)
8. (#optimization-tips)
9. (#troubleshooting)
---
## 🎯 Quick Start Guide
### What You Get
✅ **2 Complete Pine Script Indicators:**
- `swing_trading_super_indicator.pine` - Universal version for all markets
- `nifty_optimized_super_indicator.pine` - Specifically optimized for Nifty50 & Indian stocks
✅ **Key Features:**
- Multi-component signal confirmation system
- Optimized for daily and 3-hour timeframes
- Built-in risk management with dynamic stops and targets
- Real-time signal strength monitoring
- Gap analysis for Indian market characteristics
### Immediate Setup
1. Copy the Pine Script code from `nifty_optimized_super_indicator.pine`
2. Paste into TradingView Pine Editor
3. Add to chart on daily or 3-hour timeframe
4. Look for 🚀BUY and 🔻SELL signals
5. Use the information table for signal confirmation
---
## 🔍 Indicator Overview
### Core Components Integration
**🎯 Range Filter (35% Weight)**
- Primary trend identification using adaptive volatility filtering
- Optimized sampling period: 21 bars for Indian market volatility
- Enhanced range multiplier: 3.0 to handle market gaps
- Provides trend direction and strength measurement
**⚡ PMAX (30% Weight)**
- Volatility-adjusted trend confirmation using ATR-based calculations
- Dynamic multiplier adjustment based on market volatility
- 14-period ATR with 2.5 multiplier for swing trading sensitivity
- Offers trailing stop functionality
**🏗️ Support/Resistance (20% Weight)**
- Dynamic level identification using pivot point analysis
- Tighter channel width (3%) for precise Indian market levels
- Enhanced strength calculation with historical interaction weighting
- Provides entry/exit timing and breakout signals
**📊 EMA Alignment (15% Weight)**
- Multi-timeframe moving average confirmation
- Key EMAs: 9, 21, 50, 200 (popular in Indian markets)
- Hierarchical alignment scoring for trend strength
- Additional trend validation layer
### Advanced Features
**🌅 Gap Analysis**
- Automatic detection of significant price gaps (>2%)
- Gap strength measurement and impact on signals
- Specific optimization for Indian market overnight gaps
- Visual gap markers on chart
**⏰ Multi-Timeframe Integration**
- Higher timeframe bias from daily/weekly data
- Configurable daily bias weight (default 70%)
- 3-hour confirmation for precise entry timing
- Prevents counter-trend trades against major timeframe
**🛡️ Risk Management**
- Dynamic stop-loss calculation using multiple methods
- Automatic profit target identification
- Position sizing guidance based on signal strength
- Anti-whipsaw logic to prevent false signals
---
## 📥 Installation Instructions
### Step 1: Access TradingView
1. Open TradingView.com
2. Navigate to Pine Editor (bottom panel)
3. Create a new indicator
### Step 2: Copy the Code
**For Nifty50 & Indian Stocks (Recommended):**
```pinescript
// Copy entire content from nifty_optimized_super_indicator.pine
```
**For Universal Use:**
```pinescript
// Copy entire content from swing_trading_super_indicator.pine
```
### Step 3: Configure and Apply
1. Click "Add to Chart"
2. Select daily or 3-hour timeframe
3. Adjust parameters if needed (defaults are optimized)
4. Enable alerts for signal notifications
### Step 4: Verify Installation
- Check that all components are visible
- Confirm information table appears in top-right
- Test with known trending stocks for signal validation
---
## ⚙️ Parameter Settings
### 🎯 Range Filter Settings
```
Sampling Period: 21 (optimized for Indian market volatility)
Range Multiplier: 3.0 (handles overnight gaps effectively)
Source: Close (most reliable for swing trading)
```
### ⚡ PMAX Settings
```
ATR Length: 14 (standard for daily/3H timeframes)
ATR Multiplier: 2.5 (balanced for swing trading sensitivity)
Moving Average Type: EMA (responsive to price changes)
MA Length: 14 (matches ATR period for consistency)
```
### 🏗️ Support/Resistance Settings
```
Pivot Period: 8 (shorter for Indian market dynamics)
Channel Width: 3% (tighter for precise levels)
Minimum Strength: 3 (higher quality levels only)
Maximum Levels: 4 (focus on strongest levels)
Lookback Period: 150 (sufficient historical data)
```
### 🚀 Super Indicator Settings
```
Signal Sensitivity: 0.65 (balanced for swing trading)
Trend Strength Requirement: 0.75 (high quality signals)
Gap Threshold: 2.0% (significant gap detection)
Daily Bias Weight: 0.7 (strong higher timeframe influence)
```
### 🎨 Display Options
```
Show Range Filter: ✅ (trend visualization)
Show PMAX: ✅ (trailing stops)
Show S/R Levels: ✅ (key price levels)
Show Key EMAs: ✅ (trend confirmation)
Show Signals: ✅ (buy/sell alerts)
Show Trend Background: ✅ (visual trend state)
Show Gap Markers: ✅ (gap identification)
```
---
## 📊 Signal Interpretation
### 🚀 BUY Signals
**Requirements for BUY Signal:**
- Price above Range Filter with upward trend
- PMAX showing bullish direction (MA > PMAX line)
- Support/resistance breakout or favorable positioning
- EMA alignment supporting upward movement
- Higher timeframe bias confirmation
- Overall signal strength > 75%
**Signal Strength Indicators:**
- **90-100%:** Extremely strong - Maximum position size
- **80-89%:** Very strong - Large position size
- **75-79%:** Strong - Standard position size
- **65-74%:** Moderate - Reduced position size
- **<65%:** Weak - Wait for better opportunity
### 🔻 SELL Signals
**Requirements for SELL Signal:**
- Price below Range Filter with downward trend
- PMAX showing bearish direction (MA < PMAX line)
- Resistance breakdown or unfavorable positioning
- EMA alignment supporting downward movement
- Higher timeframe bias confirmation
- Overall signal strength > 75%
### ⚖️ NEUTRAL Signals
**Characteristics:**
- Conflicting signals between components
- Low overall signal strength (<65%)
- Range-bound market conditions
- Wait for clearer directional bias
### 📈 Information Table Guide
**Component Status:**
- **BULL/BEAR:** Current signal direction
- **Strength %:** Component contribution strength
- **Status:** Additional context (STRONG/WEAK/ACTIVE/etc.)
**Overall Signal:**
- **🚀 STRONG BUY:** All systems aligned bullish
- **🔻 STRONG SELL:** All systems aligned bearish
- **⚖️ NEUTRAL:** Mixed or weak signals
---
## 💼 Trading Strategy
### Daily Timeframe Strategy
**Setup:**
1. Apply indicator to daily chart of Nifty50 or Indian stocks
2. Wait for 🚀BUY or 🔻SELL signal with >75% strength
3. Confirm higher timeframe bias alignment
4. Check for significant support/resistance levels
**Entry:**
- Enter on signal bar close or next bar open
- Use 3-hour chart for precise entry timing
- Avoid entries during major news events
- Consider gap analysis for overnight positions
**Position Sizing:**
- **>90% Strength:** 3-4% of portfolio
- **80-89% Strength:** 2-3% of portfolio
- **75-79% Strength:** 1-2% of portfolio
- **<75% Strength:** Avoid or minimal size
### 3-Hour Timeframe Strategy
**Setup:**
1. Confirm daily timeframe bias first
2. Apply indicator to 3-hour chart
3. Look for signals aligned with daily trend
4. Use for entry/exit timing optimization
**Entry Refinement:**
- Wait for 3H signal confirmation
- Enter on pullbacks to key levels
- Use tighter stops for better risk/reward
- Monitor intraday support/resistance
### Risk Management Rules
**Stop Loss Placement:**
1. **Primary:** Use indicator's dynamic stop level
2. **Secondary:** Below/above nearest support/resistance
3. **Maximum:** 2-3% of portfolio per trade
4. **Trailing:** Move stops with PMAX line
**Profit Taking:**
1. **Target 1:** First resistance/support level (50% position)
2. **Target 2:** Second resistance/support level (30% position)
3. **Runner:** Trail remaining 20% with PMAX
**Position Management:**
- Review positions at daily close
- Adjust stops based on new signals
- Exit if trend changes to opposite direction
- Reduce size during high volatility periods
---
## 🎯 Optimization Tips
### For Nifty50 Trading
- Use daily timeframe for primary signals
- Monitor sector rotation impact
- Consider index futures for better liquidity
- Watch for RBI policy and global cues impact
### For Individual Stocks
- Verify stock follows Nifty correlation
- Check sector-specific news and events
- Ensure adequate liquidity for position size
- Monitor earnings calendar for volatility
### Market Condition Adaptations
**Trending Markets:**
- Increase position sizes for strong signals
- Use wider stops to avoid whipsaws
- Focus on trend continuation signals
- Reduce counter-trend trading
**Range-Bound Markets:**
- Reduce position sizes
- Use tighter stops and quicker profits
- Focus on support/resistance bounces
- Increase signal strength requirements
**High Volatility Periods:**
- Reduce overall exposure
- Use smaller position sizes
- Increase stop-loss distances
- Wait for clearer signals
### Performance Monitoring
- Track win rate and average profit/loss
- Monitor signal quality over time
- Adjust parameters based on market changes
- Keep trading journal for pattern recognition
---
## 🔧 Troubleshooting
### Common Issues
**Q: Signals appear too frequently**
A: Increase "Trend Strength Requirement" to 0.8-0.9
**Q: Missing obvious trends**
A: Decrease "Signal Sensitivity" to 0.5-0.6
**Q: Too many false signals**
A: Enable "3H Confirmation" and increase strength requirements
**Q: Indicator not loading**
A: Check Pine Script version compatibility (requires v5)
### Parameter Adjustments
**For More Sensitive Signals:**
- Decrease Signal Sensitivity to 0.5-0.6
- Decrease Trend Strength Requirement to 0.6-0.7
- Increase Range Filter multiplier to 3.5-4.0
**For More Conservative Signals:**
- Increase Signal Sensitivity to 0.7-0.8
- Increase Trend Strength Requirement to 0.8-0.9
- Enable all confirmation features
### Performance Issues
- Reduce lookback periods if chart loads slowly
- Disable some visual elements for better performance
- Use on liquid stocks/indices for best results
---
## 📞 Support & Updates
This super indicator combines the best of Range Filter, PMAX, and Support/Resistance analysis specifically optimized for Indian market swing trading. The multi-component approach significantly improves signal quality while the built-in risk management features help protect capital.
**Remember:** No indicator is 100% accurate. Always combine with proper risk management, market analysis, and your trading experience for best results.
**Happy Trading! 🚀**

Razor Precision — Buy/SellRazor Precision Stock Action Indicator
The Razor Precision indicator is an advanced, multi-layered market analysis tool designed for traders who demand accuracy and alignment across multiple timeframes. It combines price action, moving average crossovers, volume confirmation, swing structure mapping, and indicator confluence (RSI, MACD, ATR, OBV) to generate actionable buy/sell strength ratings.
Key Features:
Price Action Detection: Identifies higher highs/lows (uptrend) and lower highs/lows (downtrend).
MA Crossover Momentum: Monitors 50/200 moving average crossovers to detect trend shifts.
Volume Surge Analysis: Confirms breakouts or pullbacks with significant volume spikes.
Swing Structure Tracking: Maps internal/external breaks to align with Smart Money Concepts.
Indicator Confluence: Aggregates signals from RSI, MACD, ATR, and OBV for precision confirmation.
Multi-Timeframe Alignment: Compares trends across 15m, 1H, 4H, and Daily charts for stacked or conflicting signals.
Strength Levels: Signals range from SELL, STRONG SELL, ULTRA STRONG SELL to BUY, STRONG BUY, ULTRA STRONG BUY.
Dynamic Table Display: Updates every 5 minutes or when overall action changes, showing per-timeframe analysis and the aggregated decision.
Ideal for swing traders, scalpers, and intraday momentum players who want high-confidence trade direction filtered through multiple technical layers.

Ayman Entry Signal – Ultimate PRO (Scalping Gold Settings)1. Overview
This indicator is a professional gold scalping tool built for TradingView using Pine Script v6.
It combines multiple price action and technical filters to generate high-probability Buy/Sell signals with built-in trade management features (TP1, TP2, SL, Break Even, Partial Close, Stats tracking).
It is optimized for XAUUSD but can be applied to other assets with proper setting adjustments.
2. Key Features
Multi-Condition Trade Signals – EMA trend, Break of Structure, Order Blocks, FVG, Liquidity Sweeps, Pin Bars, Higher Timeframe confirmation, Trend Cloud, SMA Cross, and ADX.
Full Trade Management – Auto-calculates lot size, SL, TP1, TP2, Break Even, Partial Close.
Dynamic Chart Drawing – Entry lines, SL/TP lines, trade boxes, and real-time PnL.
Statistics Panel – Tracks wins, losses, breakeven trades, and total PnL over selected dates.
Customizable Filters – All filters can be turned ON/OFF to match your strategy.
3. Main Inputs & Settings
Account Settings
Capital ($) – Total trading capital.
Risk Percentage (%) – Risk per trade.
TP to SL Ratio – Risk-to-reward ratio.
Value Per Point ($) – Value per pip/point for lot size calculation.
SL Buffer – Extra points added to SL to avoid stop hunts.
Take Profit Settings
TP1 % of Full Target – Fraction of TP1 compared to TP2.
Move SL to Entry after TP1? – Activates Break Even after TP1.
Break Even Buffer – Extra points when moving SL to BE.
Take Partial Close at TP1 – Option to close half at TP1.
Signal Filters
ATR Period – For SL/TP calculation buffer.
EMA Trend – Uses EMA 9/21 crossover for trend.
Break of Structure (BoS) – Requires structure break confirmation.
Order Block (OB) – Validates trades within OB zones.
Fair Value Gap (FVG) – Confirms trades inside FVGs.
Liquidity Sweep – Checks if liquidity zones are swept.
Pin Bar Confirmation – Uses candlestick patterns for extra confirmation.
Pin Bar Body Ratio – Controls strictness of Pin Bar filter.
Higher Timeframe Filters (HTF)
HTF EMA Confirmation – Confirms lower timeframe trades with higher timeframe trend.
HTF BoS – Confirms with higher timeframe structure break.
HTF Timeframe – Selects higher timeframe.
Advanced Filters
SuperTrend Filter – Confirms trades based on SuperTrend.
ADX Filter – Filters out low volatility periods.
SMA Cross Filter – Uses SMA 8/9 cross as filter.
Trend Cloud Filter – Uses EMA 50/200 as a cloud trend filter.
4. How It Works
Buy Signal Conditions
EMA 9 > EMA 21 (trend bullish)
Optional filters (BoS, OB, FVG, Liquidity Sweep, Pin Bar, HTF confirmations, ADX, SMA Cross, Trend Cloud) must pass if enabled.
When all active filters pass → Buy signal triggers.
Sell Signal Conditions
EMA 9 < EMA 21 (trend bearish)
Same filtering process but for bearish conditions.
When all active filters pass → Sell signal triggers.
5. Trade Execution & Management
When a signal triggers:
Lot size is auto-calculated based on risk % and SL distance.
SL is placed beyond recent swing high/low + ATR buffer.
TP1 and TP2 are calculated from the SL using the reward-to-risk ratio.
Break Even: If enabled, SL moves to entry price after TP1 is hit.
Partial Close: If enabled, half of the position closes at TP1.
Trade Exit: Full exit at TP2, SL hit, or partial close at TP1.
6. Chart Display
Entry Line – Shows entry price.
SL Line – Red dashed line at stop loss level.
TP1 Line – Lime dashed line for TP1.
TP2 Line – Green dashed line for TP2.
PnL Labels – Displays real-time profit/loss in $.
Trade Box – Visual area showing trade range.
Pin Bar Shapes – Optional, marks Pin Bars.
7. Statistics Panel
Stats Header – Shows “Stats”.
Total Trades
Wins
Losses
Breakeven Trades
Total PnL
Can be reset or filtered by date.
8. How to Use
Load the Indicator in TradingView.
Select Gold (XAUUSD) on your preferred scalping timeframe (1m, 5m, 15m).
Adjust settings:
Use default gold scalping settings for quick start.
Enable/disable filters according to your style.
Wait for a Buy/Sell alert.
Confirm visually that all desired conditions align.
Place trade with calculated lot size, SL, and TP levels shown on chart.
Let trade run – the indicator manages Break Even & Partial Close if enabled.
9. Recommended Timeframes
Scalping: 1m, 5m, 15m
Day Trading: 15m, 30m, 1H
Swing: 4H, Daily (adjust settings accordingly)

Confluence Indicator: Fib, MACD, SMA 50/200This is a scalping indicator best used on the 1hour and 15min charts

Liquidity Zones, EMAs, Market Cipher BAll In One, market cipher b, divergences, ema 12/21/50/200, and liquidity zones

Neuracap Gap AnalysisThe Neuracap Gap Analysis indicator is a comprehensive tool designed to identify and track price gaps, special candlestick patterns, and high-volume breakout signals. It combines multiple trading strategies into one powerful indicator for gap trading, pattern recognition, and momentum analysis.
🎯 What This Indicator Does
1. Gap Detection & Tracking
Automatically identifies price gaps (up and down)
Tracks gap fills with visual boxes that extend until closed
Manages gap history with customizable limits
Color-coded visualization (Green = Gap Up, Red = Gap Down)
2. Upside Tasuki Gap Pattern
Identifies the bullish continuation pattern
Colors candles yellow when pattern is detected
Confirms trend continuation signals
3. Episodic Pivot Detection
High-volume breakout identification
EMA filter ensures signals only in uptrends
Strong momentum confirmation
Fuchsia-colored candles with arrow markers
🔍 How to Use for Trading
📈 Gap Trading Strategy
Gap Up Trading:
Wait for gap up (green box appears)
Check volume - Higher volume = stronger signal
Entry options:
Aggressive: Enter at market open
Conservative: Wait for pullback to gap level
Stop loss: Below the gap fill level
Target: Previous resistance or 2:1 risk/reward
Gap Down Trading:
Identify gap down (red box appears)
Look for bounce opportunities
Entry: When price shows reversal signs
Stop: Below recent lows
Target: Gap fill level
💫 Tasuki Gap Strategy
Yellow candle indicates bullish continuation
Confirms uptrend is likely to continue
Entry: On next candle after pattern
Stop: Below the gap low
Target: Next resistance level
🚀 Episodic Pivot Strategy
Fuchsia candle + arrow = High probability breakout
All conditions met:
Price above EMA 20, 50, 200
High volume (2x+ average)
Strong price move (4%+)
Entry: At close or next open
Stop: Below EMA 20 or recent swing low
Target: Measured move or next resistance
📊 Reading the Visual Signals
Gap Boxes
🟢 Green Box: Gap up - potential bullish continuation
🔴 Red Box: Gap down - potential bounce or bearish continuation
Box extends until gap is filled
Box disappears when gap closes
Candle Colors
🟡 Yellow: Tasuki gap pattern (bullish continuation)
🟪 Fuchsia: Episodic pivot (high-volume breakout)
⬜ Normal: No special pattern detected
Arrows & Markers
⬆️ Triangle Arrow: Episodic pivot confirmation
💡 Trading Tips & Best Practices
✅ Do's
Combine with trend analysis - Trade gaps in direction of trend
Check volume - Higher volume = more reliable signals
Use multiple timeframes - Confirm on higher timeframes
Risk management - Always set stop losses
Wait for confirmation - Don't chase, let signals develop
❌ Don'ts
Don't trade all gaps - Focus on high-quality setups
Avoid low volume - Weak volume = unreliable signals
Don't ignore trend - Counter-trend trading is risky
Don't overtrade - Quality over quantity
Don't ignore context - Consider market conditions
⚠️ Risk Management
Position sizing: Risk 1-2% per trade
Stop losses: Always define before entry
Target levels: Set realistic profit targets
Market conditions: Avoid trading in choppy markets
📈 Performance Optimization
For Conservative Traders:
Increase minimum gap size to 1%
Set volume multiplier to 3.0x
Only trade episodic pivots in strong uptrends
Wait for gap fill confirmation
For Aggressive Traders:
Decrease minimum gap size to 0.3%
Set volume multiplier to 1.5x
Trade both gap types
Enter on pattern confirmation
🚨 Alert Setup
The indicator provides alerts for:
Gap Up Detected
Gap Down Detected
Upside Tasuki Gap
Episodic Pivot
Recommended: Enable all alerts and filter manually based on your strategy.
📝 Summary
This indicator excels at identifying high-probability trading opportunities through gap analysis, pattern recognition, and momentum confirmation. Use it as part of a complete trading system with proper risk management for best results.

Volume Spike Analyzer(SMA10-Based)📊 **Volume Spike Analyzer (SMA10-Based)**
This indicator highlights abnormal volume activity by comparing current volume to the 10-period Simple Moving Average (SMA) of volume. It helps traders visually identify unusual activity that may precede breakouts, reversals, or news-driven moves.
---
🔧 **Features:**
• ✅ Colors volume bars:
• Green = Volume > SMA(10)
• Red = Volume ≤ SMA(10)
• ✅ Detects and labels spike levels:
• 🔶2x — Volume > 2x SMA(10)
• 🟢3x — Volume > 3x SMA(10)
• 🔴4x — Volume > 4x SMA(10)
• ✅ Built-in alerts for all 3 spike levels
---
📈 **Best Use Cases:**
• Confirm breakouts with strong volume
• Detect accumulation/distribution
• Filter low-volume setups
• Combine with VWAP/EMA for directional confirmation
---
⏱️ **Recommended Timeframes:**
• Intraday: 5m, 15m, 1h
• Also works on daily for swing trades
---
🧠 **Pro Tips:**
• Use with VWAP or EMA(20/50/200) for confluence
• Add SMA(Volume, 10) to your price chart for quick correlation
• Combine with candle pattern detection for signal validation
---

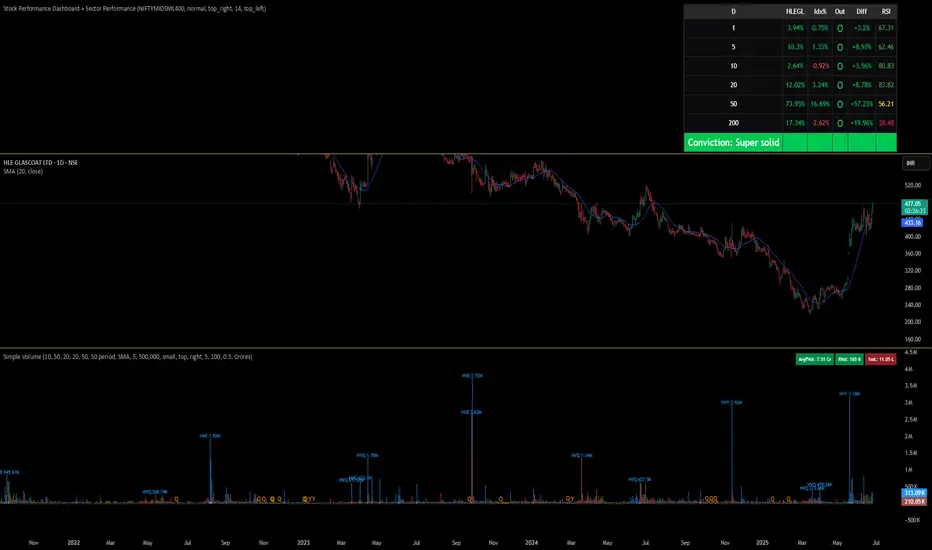
Stock Performance Dashboard + Sector PerformanceThis indicator, Stock Performance Dashboard + Sector Performance, provides a comprehensive visual analysis of both individual stock performance and sectoral trends directly on your TradingView chart.
Key Features:
Performance Dashboard Table:
Displays the stock’s returns over multiple timeframes (1, 5, 10, 20, 50, 200 days) and compares them to a selected benchmark index (default: NIFTYMIDSML400).
Highlights whether the stock is outperforming the index for each period, shows the difference in performance, and includes an RSI (Relative Strength Index) column for additional momentum insight.
Calculates and displays a “conviction” score and level based on how often the stock outperforms the index across periods.
Sector Performance Table:
Ranks and displays the top-performing sectors from a predefined list of major NSE sector indices over four key periods (1D, 5D, 30D, 50D).
For each period, the top 5 sectors are shown, with color-coded performance for quick visual assessment.
Customization:
Includes options for dark/light mode, table size, position, and which columns to display.
Supports a compact “mini mode” for simplified visualization.
Usage:
This tool is ideal for traders and investors who want a quick, at-a-glance comparison of a stock’s short- and long-term momentum versus its benchmark, as well as a live snapshot of sector rotation and leadership in the Indian market. All data is presented in clear, color-coded tables for actionable decision-making.
SPX Weekly Expected Moves# SPX Weekly Expected Moves Indicator
A professional Pine Script indicator for TradingView that displays weekly expected move levels for SPX based on real options data, with integrated Fibonacci retracement analysis and intelligent alerting system.
## Overview
This indicator helps options and equity traders visualize weekly expected move ranges for the S&P 500 Index (SPX) by plotting historical and current week expected move boundaries derived from weekly options pricing. Unlike theoretical volatility calculations, this indicator uses actual market-based expected move data that you provide from options platforms.
## Key Features
### 📈 **Expected Move Visualization**
- **Historical Lines**: Display past weeks' expected moves with configurable history (10, 26, or 52 weeks)
- **Current Week Focus**: Highlighted current week with extended lines to present time
- **Friday Close Reference**: Orange baseline showing the previous Friday's close price
- **Timeframe Independent**: Works consistently across all chart timeframes (1m to 1D)
### 🎯 **Fibonacci Integration**
- **Five Fibonacci Levels**: 23.6%, 38.2%, 50%, 61.8%, 76.4% between Friday close and expected move boundaries
- **Color-Coded Levels**:
- Red: 23.6% & 76.4% (outer levels)
- Blue: 38.2% & 61.8% (golden ratio levels)
- Black: 50% (midpoint - most critical level)
- **Current Week Only**: Fibonacci levels shown only for active trading week to reduce clutter
### 📊 **Real-Time Information Table**
- **Current SPX Price**: Live market price
- **Expected Move**: ±EM value for current week
- **Previous Close**: Friday close price (baseline for calculations)
- **100% EM Levels**: Exact upper and lower boundary prices
- **Current Location**: Real-time position within the EM structure (e.g., "Above 38.2% Fib (upper zone)")
### 🚨 **Intelligent Alert System**
- **Zone-Aware Alerts**: Separate alerts for upper and lower zones
- **Key Level Breaches**: Alerts for 23.6% and 76.4% Fibonacci level crossings
- **Bar Close Based**: Alerts trigger on confirmed bar closes, not tick-by-tick
- **Customizable**: Enable/disable alerts through settings
## How It Works
### Data Input Method
The indicator uses a **manual data entry approach** where you input actual expected move values obtained from options platforms:
```pinescript
// Add entries using the options expiration Friday date
map.put(expected_moves, 20250613, 91.244) // Week ending June 13, 2025
map.put(expected_moves, 20250620, 95.150) // Week ending June 20, 2025
```
### Weekly Structure
- **Monday 9:30 AM ET**: Week begins
- **Friday 4:00 PM ET**: Week ends
- **Lines Extend**: From Monday open to Friday close (historical) or current time + 5 bars (current week)
- **Timezone Handling**: Uses "America/New_York" for proper DST handling
### Calculation Logic
1. **Base Price**: Previous Friday's SPX close price
2. **Expected Move**: Market-derived ±EM value from weekly options
3. **Upper Boundary**: Friday Close + Expected Move
4. **Lower Boundary**: Friday Close - Expected Move
5. **Fibonacci Levels**: Proportional levels between Friday close and EM boundaries
## Setup Instructions
### 1. Data Collection
Obtain weekly expected move values from options platforms such as:
- **ThinkOrSwim**: Use thinkBack feature to look up weekly expected moves
- **Tastyworks**: Check weekly options expected move data
- **CBOE**: Reference SPX weekly options data
- **Manual Calculation**: (ATM Call Premium + ATM Put Premium) × 0.85
### 2. Data Entry
After each Friday close, update the indicator with the next week's expected move:
```pinescript
// Example: On Friday June 7, 2025, add data for week ending June 13
map.put(expected_moves, 20250613, 91.244) // Actual EM value from your platform
```
### 3. Configuration
Customize the indicator through the settings panel:
#### Visual Settings
- **Show Current Week EM**: Toggle current week display
- **Show Past Weeks**: Toggle historical weeks display
- **Max Weeks History**: Choose 10, 26, or 52 weeks of history
- **Show Fibonacci Levels**: Toggle Fibonacci retracement levels
- **Label Controls**: Customize which labels to display
#### Colors
- **Current Week EM**: Default yellow for active week
- **Past Weeks EM**: Default gray for historical weeks
- **Friday Close**: Default orange for baseline
- **Fibonacci Levels**: Customizable colors for each level type
#### Alerts
- **Enable EM Breach Alerts**: Master toggle for all alerts
- **Specific Alerts**: Four alert types for Fibonacci level breaches
## Trading Applications
### Options Trading
- **Straddle/Strangle Positioning**: Visualize breakeven levels for neutral strategies
- **Directional Plays**: Assess probability of reaching target levels
- **Earnings Plays**: Compare actual vs. expected move outcomes
### Equity Trading
- **Support/Resistance**: Use EM boundaries and Fibonacci levels as key levels
- **Breakout Trading**: Monitor for moves beyond expected ranges
- **Mean Reversion**: Look for reversals at extreme Fibonacci levels
### Risk Management
- **Position Sizing**: Gauge likely price ranges for the week
- **Stop Placement**: Use Fibonacci levels for logical stop locations
- **Profit Targets**: Set targets based on EM structure probabilities
## Technical Implementation
### Performance Features
- **Memory Managed**: Configurable history limits prevent memory issues
- **Timeframe Independent**: Uses timestamp-based calculations for consistency
- **Object Management**: Automatic cleanup of drawing objects prevents duplicates
- **Error Handling**: Robust bounds checking and NA value handling
### Pine Script Best Practices
- **v6 Compliance**: Uses latest Pine Script version features
- **User Defined Types**: Structured data management with WeeklyEM type
- **Efficient Drawing**: Smart line/label creation and deletion
- **Professional Standards**: Clean code organization and comprehensive documentation
## Customization Guide
### Adding New Weeks
```pinescript
// Add after market close each Friday
map.put(expected_moves, YYYYMMDD, EM_VALUE)
```
### Color Schemes
Customize colors for different trading styles:
- **Dark Theme**: Use bright colors for visibility
- **Light Theme**: Use contrasting dark colors
- **Minimalist**: Use single color with transparency
### Label Management
Control label density:
- **Show Current Week Labels Only**: Reduce clutter for active trading
- **Show All Labels**: Full information for analysis
- **Selective Display**: Choose specific label types
## Troubleshooting
### Common Issues
1. **No Lines Appearing**: Check that expected move data is entered for current/recent weeks
2. **Wrong Time Display**: Ensure "America/New_York" timezone is properly handled
3. **Duplicate Lines**: Restart indicator if drawing objects appear duplicated
4. **Missing Fibonacci Levels**: Verify "Show Fibonacci Levels" is enabled
### Data Validation
- **Expected Move Format**: Use positive numbers (e.g., 91.244, not ±91.244)
- **Date Format**: Use YYYYMMDD format (e.g., 20250613)
- **Reasonable Values**: Verify EM values are realistic (typically 50-200 for SPX)
## Version History
### Current Version
- **Pine Script v6**: Latest version compatibility
- **Fibonacci Integration**: Five-level retracement analysis
- **Zone-Aware Alerts**: Upper/lower zone differentiation
- **Dynamic Line Management**: Smart current week extension
- **Professional UI**: Comprehensive information table
### Future Enhancements
- **Multiple Symbols**: Extend beyond SPX to other indices
- **Automated Data**: Integration with options data APIs
- **Statistical Analysis**: Success rate tracking for EM predictions
- **Additional Levels**: Custom percentage levels beyond Fibonacci
## License & Usage
This indicator is designed for educational and trading purposes. Users are responsible for:
- **Data Accuracy**: Ensuring correct expected move values
- **Risk Management**: Proper position sizing and risk controls
- **Market Understanding**: Comprehending options-based expected move concepts
## Support
For questions, issues, or feature requests related to this indicator, please refer to the code comments and documentation within the Pine Script file.
---
**Disclaimer**: This indicator is for informational purposes only. Trading involves substantial risk of loss and is not suitable for all investors. Past performance does not guarantee future results.

Ashpi CVD + MACD AlertMACD Crossing + CVD Support
Red arrows signal short entries above the MACD zero line.
Green arrows signal long entries below the zero line.
Blue arrows indicate a re-entry into an existing long trend (crossing above the zero line), typically on pull-backs.
Yellow arrows indicate a re-entry into an existing short trend (crossing below the zero line).
Time-Frame Setup
- Entry on the 15-second chart
- Confirmation on the 30-second chart
- Trade management on the 1-minute chart (or higher)
Always follow the primary trend: RED = Short, GREEN = Long.
Sequence
1. RED signal appears → enter short
2. During the trade, if a GREEN arrow appears on the pull-back → exit trade, or add to position on a YELLOW arrow if the trend continues
The same applies to long trades and BLUE arrows.
Using EMAs (20, 50, 200) can help you spot structural breaks more clearly.
Signal Strength (Delta Distance to Zero Line)
The strength of each signal is enhanced by displaying the distance (delta) to the zero line in the chart:
- Green numbers mean the delta is already above its 10-period moving average (MA10).
- Red numbers mean the delta is below its MA10.
Identifying Sideways Markets
Use a standard MACD as an additional filter to spot ranging phases.
If YELLOW and BLUE arrows occur frequently in succession, it indicates the two MACD lines are moving very close together—trading such conditions should generally be avoided.

MA Dispersion+MA Dispersion+ — read the “breathing space” between your moving-averages
Get instant feedback on trend strength, volatility expansion and mean-reversion — across any timeframe.
MA Dispersion+ turns the humble moving-average stack into a single, easy-to-read oscillator that tells you at a glance whether price is coiling or fanning out.
🧩 What it does
Plugs into your favourite MA setup
• Pick the classic 5 / 20 / 50 / 200 lengths or disable any combination with one click.
• Choose the MA engine you trust — SMA, EMA, RMA, VWMA or WMA.
• Works on any timeframe thanks to TradingView’s security() engine.
Measures “spread”
For every bar it calculates the absolute distance of each selected MA from their average.
The tighter the stack, the lower the value; the wider the fan, the higher the value.
Adds professional-grade controls
• Weighting — let short-term MAs dominate (Inverse Length), keep everything equal, or dial in your own custom weights.
• Normalisation — convert the raw distance into a percentage of price, ATR multiples, or scale by the MAs’ own mean so you can compare symbols of any price or volatility.
🔍 How traders use it
Trend confirmation – rising dispersion while price breaks out = momentum is genuine.
Volatility squeeze – dispersion parking near zero warns that a big move is loading.
Multi-TF outlook – drop one pane per timeframe (e.g. 5 m, 1 h, 1 D) and see which layer of the market is driving.
Mean-reversion plays – spikes that fade quickly often coincide with exhaustion and snap-backs.
⚙️ Quick-start
Add MA Dispersion+ to your chart.
Set the pane’s timeframe in the first input.
Tick the MA lengths you actually use.
(Optional) Pick a weighting scheme and a normaliser.
Repeat the indicator for as many timeframes as you like — each instance keeps its own settings.
✨ Why you’ll love it
Zero clutter – one orange line tells you what four separate MAs whisper.
Configurable yet bullet-proof – all lengths are hard-coded constants, so Pine never complains.
Context aware – normalisation lets you compare BTC’s $60 000 chaos with EURUSD’s four--decimals calm.
Lightweight – no labels, no drawings, no background processing — perfect for mobile and multi-pane layouts.
Give MA Dispersion+ a try and let your charts breathe — you’ll never look at moving-average ribbons the same way again.
Happy trading!
Fibonacci Levels with MACD ConfirmationHow to Understand and Use the Fibonacci Levels with MACD Confirmation Script
This custom Pine Script is designed to give traders a clear visual framework by combining dynamic Fibonacci retracement levels, MACD histogram confirmation, and volatility-based swing zones. It aims to simplify trend analysis, improve entry timing, and adapt to various market conditions.
How to Interpret the 23.6% & 61.8% Labels
These Fibonacci levels represent key retracement zones where price often reacts during trend pullbacks or reversals.
The 23.6% level indicates a shallow retracement, useful in strong trends where price resumes early.
The 61.8% level is a deeper retracement, often a "last line of defense" before trend invalidation.
The script labels these zones with "CC 23.6" and "CC 61.8" when the price crosses them with MACD histogram confirmation:
Green label (CC) = bullish confirmation
Red label (CC) = bearish confirmation
How to Modify Inputs (Manual Adjustments)
Input Purpose Default How to Use
ATR Period Measures volatility 14 Increase for smoother, slower reactions; reduce for faster swings
Min Lookback Minimum bars for swing zone 20 Avoids short-term noise
Max Lookback Cap for swing zone scan 100 Avoids excessively wide retracement levels
Inverse Candle Chart Flips high/low logic false Enable for inverted analysis or backtesting "opposite logic"
How to Use the Inverse Candle Chart Option
Activating inverse mode flips candle logic:
Highs become negative lows, and vice versa.
Useful for:
Contrarian analysis
Inverse ETFs or short-biased views
Backtesting reverse-pattern behavior
How to Adjust the Style
You can manually personalize the script’s visual appearance:
Change line width in plot(..., linewidth=2) for bolder or thinner Fib levels.
Change colors from color.green, color.red, etc., to suit your theme.
Modify label.size, label.style, and label.color for different labeling visuals.
Customize MACD histogram style from plot.style_columns to other styles like style_histogram.
How the MACD is Set and Displayed
The MACD uses non-standard values:
Fast Length = 24
Slow Length = 52
Signal Smoothing = 18
These values slow down the indicator, reducing noise and aligning better with medium- to long-term trends.
MACD histogram is plotted directly on the main chart for faster, on-screen decision making.
Color-coded histogram:
Green/Lime = Bullish momentum increasing or steady
Red/Maroon = Bearish momentum increasing or steady
How to Use the Indicator in Real-World Trading
This indicator is most effective when used to:
✅ 1. Spot High-Probability Trend Continuation Zones
In a strong trend, price will often retrace to 23.6% or 61.8%, then resume.
Wait for:
Price to cross 23.6 or 61.8
MACD histogram rising (bullish) or falling (bearish)
"CC 23.6" or "CC 61.8" label to appear
🟢 Entry Example: Price retraces to Fib 61.8%, crosses up with green MACD histogram → take long position
✅ 2. Validate Reversal or Breakout Zones
These Fib levels also act as support/resistance.
If price crosses a Fib level but MACD fails to confirm, it may be a fake breakout.
Use confirmation labels only when MACD aligns.
✅ 3. Add Volatility Context (ATR) for Risk Management
The ATR label shows both value and %.
Use ATR to:
Set dynamic stop-losses (e.g., 1.5x ATR below entry)
Decide trade size based on volatility
How to Combine the Indicator With Other Tools
You can combine this script with other technical tools for a powerful trading framework:
🔁 With Moving Averages
Use 50/200 MA for overall trend direction
Take signals only in the direction of MA slope
🔄 With Price Action Patterns
Use the Fib/MACD signals at confluence points:
Support/resistance zones
Breakout retests
Candlestick patterns (pin bars, engulfing)
🔺 With Volume or Order Flow
Combine with volume spikes or order book signals
Confirm that Fib/MACD signals align with strong volume for conviction
✅ Trade Setup Summary
Criteria Long Setup Short Setup
Price at Fib Level At or crossing Fib 23.6 / 61.8 Same
MACD Histogram Rising and above previous bar Falling and below previous bar
Label Appears Green "CC 23.6" or "CC 61.8" Red "CC 23.6" or "CC 61.8"
Optional Filters Trend direction, ATR range, volume, price pattern Same

ADR Nivele Horizontale dhe EMAThe user provided a Pine Script code for an indicator called "ADR Nivele Horizontale dhe EMA". The task is to explain how this code works. Hmm, first, I need to understand what this indicator does. The title mentions ADR levels and EMA, so it's probably combining horizontal lines based on Average Daily Range and some Exponential Moving Averages.
Looking at the code, the first part is the indicator declaration with version 6. The settings include an ADR period, levels above and below the mid, and line style. Then there's a section for calculations. They request daily high and low to compute the daily range. The ADR is the SMA of the daily range over the specified period. The mid is the average of daily high and low. The adr_val is half of ADR, maybe to create symmetrical levels around the mid.
Next, they create arrays for lines and labels above and below the mid. The loops go from 1 to levels_above/below, calculate each level, draw lines and labels. The mid line is also drawn with a different color. Then, there are several EMAs plotted: 13, 50, 200, 400, 600, 800, each with different colorsWait, but in Pine Script, when you use arrays to store lines and labels, you have to manage them properly to avoid repainting or memory issues. The code uses array.concat to add new lines and labels each bar. However, since this code is running on each bar, the for loops might be creating multiple lines each time, leading to too many objects. Oh right, but they use var to initialize the arrays, so they are only initialized once. Wait, no. The var keyword initializes the variable once, but in each iteration, they are concatenating new lines. Wait, no: the for loops are inside the main script, which runs on each bar. So every time a new bar is processed, the loops will run again, adding new lines and labels. That's a problem because each bar would create new lines, leading to an ever-increasing number of lines, which could hit the maximum limit (max_lines_count is set to 20, but maybe they have more bars). Oh, the indicator has max_lines_count=20, but the code might be creating multiple lines per bar. So maybe the code isn't handling the line management correctly. For example, if levels_above is 2, then each bar would create 2 new lines above and 2 below, plus the mid line. Over 20 bars, that's way over 20 lines. So this could cause the indicator to stop drawing after 20 lines. The user might not have realized that the lines are being recreated every bar, leading to a buildup. But perhaps the original code intended to have the lines update each bar, extending to the current bar. Let's see: in line.new, they use bar_index as the starting x1 and bar_index as x2. So each line is drawn from the previous bar's index to the current one. But since this is done on every bar, each line is only one bar long. Wait, no. Because on each new bar, the code creates a new line from the previous bar's index (bar_index , which is now the bar before the current one) to the current bar_index. So each line is just a segment from the previous bar to the current bar. But when the next bar comes, a new line is created again. So the result is that each level line is a series of one-bar-length segments, which might not be intended. The user probably wants continuous lines that extend from the left to the right, not just per bar. So this approach is incorrect. The correct way would be to have a line that starts at the first bar of the calculation and extends to the right, updating each bar. But the current code creates a new line each bar, leading to multiple short lines instead of one continuous line. That's a mistake.
So the main issue here is that the code is generating a new line segment for each bar, which is not efficient and would quickly hit the line limit. To fix this, instead of creating a new line every bar, they should create the line once and then update its position each bar. But in Pine Script, you can't directly update a line after it's created; instead, you need to track the line ID and use line.set_xy() to extend it. However, the current code uses array.concat to add new lines each bar, which isn't the right approach.
Therefore, the code as written will create multiple short lines instead of continuous horizontal lines. The correct approach for horizontal levels that extend to the right is to create the line once, starting at a certain bar and extending indefinitely, or to update the line's end point each new bar. But in Pine Script, you can't extend lines infinitely; you have to manage them each bar. Alternatively, using the 'line.extend' style might help, but I think the original code's logic is flawed here.
Additionally, the EMA part is straightforward: plotting multiple EMAs with different periods. That part should work as expected.
So the explanation should mention that the ADR levels are calculated based on the daily high and low, then the code attempts to draw horizontal lines above and below the mid-point. However, the way the lines are drawn may lead to multiple short segments instead of continuous lines, potentially causing performance issues or hitting the maximum line count. The EMAs are plotted correctly with various periods..

Stacked EMA Candle Colors - Enhanced📊 Stacked EMA Candle Colors – Trend Strength Visualizer
Description:
🚀 Overview:
The Stacked EMA Candle Colors – Trend Strength Visualizer is a simple yet powerful indicator that helps traders identify market trends using Exponential Moving Averages (EMAs). By dynamically coloring candles based on the strength and alignment of multiple EMAs, this tool makes it easier to spot bullish and bearish trends at a glance, without cluttering your chart with multiple EMA lines.
🔹 Key Features:
✅ Four Customizable EMA lengths (adjust in settings)
✅ Candles change color based on EMA stacking (adjustable)
✅ Four-part gradient-based strength visualization for momentum confirmation (adjustable)
✅ Works on all timeframes and asset classes
🎨 How It Works:
When shorter EMAs (e.g., 9, 21) are above longer EMAs (e.g., 50, 200), the trend is bullish, and candles turn green/lime based on momentum strength.
When shorter EMAs are below longer EMAs, the trend is bearish, and candles turn red/pink depending on trend intensity.
If no clear trend is detected, candles remain gray for neutrality.
📈 Ideal for:
✔️ Trend traders who want a clear visual representation of momentum
✔️ Scalpers, day traders, and swing traders looking for quick trend confirmation
✔️ Anyone who wants to enhance their chart readability
🔧 Customization:
Easily adjust the EMA periods in the settings menu to fit your preferred trading strategy!
🚀 Add this indicator to your TradingView chart and spot trends with confidence!

ALMA 20, 50, 200The ALMA (Arnaud Legoux Moving Average) crossover strategy uses two ALMA lines (fast and slow) to generate buy/sell signals, aiming to reduce lag and noise compared to traditional moving averages, and is often combined with volume filters for improved accuracy.
Here's a more detailed explanation:
What it is:
The ALMA indicator is a moving average (MA) variant designed to reduce lag and improve responsiveness while maintaining a smooth curve, using a Gaussian filter.
How it works:
ALMA calculates two moving averages, one from left to right and one from right to left, and then processes the output through a customizable formula for increased smoothness or responsiveness.
Crossover Strategy:
A common ALMA strategy involves using two ALMA lines with different lengths (fast and slow). A buy signal is generated when the fast ALMA crosses above the slow ALMA, and a sell signal when the fast ALMA crosses below the slow ALMA.
Benefits:
ALMA offers advantages like reduced lag, smoothness, and filtering capabilities, making it useful for identifying trends and potential reversals.
Potential Risks:
Like any indicator, ALMA can produce false signals, so it's crucial to combine it with other indicators and analyze price action.
Parameters:
ALMA has parameters like "Length" (number of periods), "Sigma" (filter's range, affecting responsiveness), and "Offset" (for accessing data of different candles).
Other uses:
ALMA can also be used for trend identification, dynamic support and resistance, and combined with other indicators to enhance trading strategies.

FTB Smart Trader System — Market Maker Levels, EMAs & VectorsThe FTB Trade Engine is an indicator suite I built for myself as a crypto trader. It's designed specifically for trading Institution levels, EMAs, PVSRA Volume Candles, and Session Timings. It helps me spot high probability trade setups without overcomplicating things.
🔑 Features of this Indicator
📌 🔥 Key Session Levels (extend lines in settings as needed)
✅ Weekly High & Low (HOW/LOW) — Automatically plots the previous week's high and low
✅ Daily High & Low (HOD/LOD) — Marks the prior day's range
✅ Asia Session High & Low — Plots the Asian session’s high and low, helping you detect potential breakouts or fakeouts, as Asia often sets the initial high and low of the day.
✅ 50% Asia Level — Automatically calculates and displays the midpoint between Asia’s high and low, an important level for intraday trading.
📌 🔥 Advanced EMA Suite
✅ Includes 10, 20, 50, 200, and 800 EMAs — providing key zones of support, resistance, and trend direction.
👀 Good to know: the break of the 50EMA WITH a vector candle is significant for reversals.
📌 🔥 PVSRA Candles
(👀 IMPORTANT: To properly view PVSRA candles, make sure to UNCHECK all default candle settings — Color Bars, Body, Borders, and Wick — in your chart's candle settings.)
✅ Price, Volume, Support & Resistance Analysis (PVSRA) Candles — These special candles combine price action with volume analysis, color-coded to highlight areas potentially influenced by market makers, institutions, and large players. Perfect for identifying key volume zones and quickly analyzing any coin or pair without switching tools.
Candle Colors Explained:
Bullish Candles:
🟢 Green — 200% increase in volume on bullish moves (strong buyer presence).
🔵 Blue — 150% increase in bullish volume, but may also indicate fatigue or possible reversal.
⚪ White — Normal bullish volume (standard green candles).
Bearish Candles:
🔴 Red — 200% increase in bearish volume compared to the last 10 candles (strong selling).
🟣 Magenta — 150% increase in bearish volume, signaling possible continuation or exhaustion.
⚫ Gray — Normal bearish volume (standard red candles).
Pivot Point+ Supertrend + EMA + Support/Resistance- LAXMANTAK98
Pivot Point Supertrend with EMA and Support/Resistance Indicator
This custom trading indicator combines the following key components to assist in market analysis and trade decision-making:
Pivot Points:
Pivot points are calculated based on a chosen price source (High, Low, Open, or Close). These levels are used to determine potential support and resistance zones.
Pivot Highs (Resistance) and Pivot Lows (Support) are plotted as labels on the chart for easy identification.
Supertrend Indicator:
The Supertrend is a trend-following indicator that helps to identify bullish or bearish trends.
It uses the Average True Range (ATR) to calculate dynamic support/resistance levels, with adjustable settings for ATR length and multiplier factor.
The trend direction is visually represented by green (bullish) and red (bearish) lines on the chart.
Exponential Moving Averages (EMA):
The indicator plots up to four EMAs with user-defined periods (e.g., 9, 21, 50, 200).
EMAs are commonly used to smooth out price data and identify trends over various timeframes.
Support and Resistance Levels:
Based on Pivot Points, support and resistance levels are plotted using crosses on the chart.
These levels indicate possible price reversal points, helping traders spot key zones for entry and exit.
Visual Alerts:
The indicator includes built-in alerts for trend changes and potential buy/sell signals based on the transition between uptrend and downtrend states.
This combined indicator allows traders to analyze trends, identify key levels for trading, and make more informed decisions by integrating Pivot Points, Supertrend, EMAs, and Support/Resistance in one cohesive system.

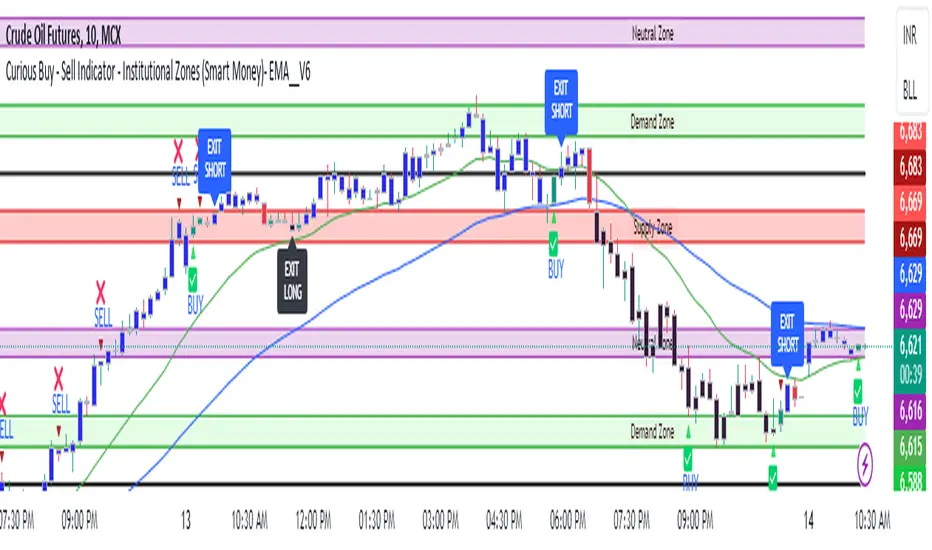
Curious Buy - Sell Indicator - Institutional Zones (Smart Money)How the Script Works:
1. The Scripts identifies Institutional Demand , Supply & Neutral Zones with FIBS on the scripts with Rectangle BOX with labels in advance. User can insert desired start and end value to plot institutional zones
2. Script generates BUY - SELL signals shape based on candle stick formation in live market and labels with BUY - SELL image for easy identification
3. Script gives pop message EXIT SHORT once Buy spotted and candle close above the buy signal and same way EXIT LONG once Sell spotted and candle close below the buy signal
4. Scripts identifies the candle closing above the BUY - SELL signals Eg - If buy spotted the candle closing above the BUY signal with display with BLUE color Candle same way for sell signal the candle closing below the sell signal candle with display with BLACK color candle.
5. Script spots fake signals which are not valid and can be ignored by the end user
6. Three EMA's 20,50,200 has implemented to identify the strength of the market
7. Scripts identifies OPEN = LOW & OPEN = HIGH candle stick to spot the Institutional BUY - SELL activity
8. The script provides visual clues on the chart to help users identify potential trading opportunities.
9. The script provides visual clues on the chart to help users identity potential trading opportunities in live market
10. The looks and parameters of the script can be modified by end user to customize and adapt to different strategy.
11. With the script user can check higher time frame DAILY \ WEEKLY BUY - SELL signals to plan intraday trades and plan safe BUY - SELL positions.
How Users Can Make Profit Using This Script:
1. Identify potential BUY - LONG opportunities: When a valid BUY is detected and condition is met, it is suggested to opening BUY position with stoploss below the BUY signal spotted candle.
Safe users can execute BUY position once BLUE COLOR candle is formed, Wait for pull back to reduce the stoploss
2. Identify potential SELL - SHORT opportunities: When a valid SELL is detected and condition is met, it suggests a potential opening SELL positions with stoploss above the BUY signal spotted candle. Safe users can execute SELL position once BLACK COLOR candle is formed, Wait for pull back to reduce the stoploss.
3. Script generated BUY - SELL signal met target with the Institutional zone. Eg if BUY spotted at demand zone target will be neutral zone & Supply zone.
4. Script designed for user to spot high probability trades when BUY SIGNAL SPOTTED at the Institutional Demand zone same way SELL SIGNAL SPOTTED AT INSTITUTIONAL supply zone.
5. Combine with additional analysis: Users can utilize this script as a tool in their overall trading strategy. They can combine the signals with fundament analysis , market sentiment to make more informed trading decision
6.Set risk management measures: It is important for users to implement proper risk management strategies when trading based on the scripts signals. To avoid potential losses user once spotted BUY - SELL execute the long or short position. Ensure to place the stoploss to avoid potential losses and place the target. Once your trade is moving in your favor
can trial your stoploss to cost and protect the profits.
SMA Table with Alerts and Intersections🌟 **Presenting the Dynamic SMA Intersection Alert Indicator!** 🌟
### **Overview:**
The Dynamic SMA Intersection Alert Indicator is a sophisticated tool developed for traders seeking simplicity and effectiveness. It integrates multiple Simple Moving Averages (SMA) to deliver real-time alerts and visual cues, enabling traders to identify potential market entry points with ease.
### **Features:**
1. **Multi-SMA Visualization:**
- Incorporates four SMAs: 8, 20, 50, 200 periods.
- Displays a customizable table showing the current value of each SMA.
2. **Alerts in Real-Time:**
- Provides instant notifications for price crossings over any of the SMAs.
- Offers customizable alert messages.
3. **Visualization of Intersection Points:**
- Displays green triangles for bullish crosses and red for bearish, directly on the chart.
- Allows for the identification of precise intersection points between shorter-term and longer-term SMAs.
### **Benefits:**
- **Informed Decision-Making:** Enables quick discernment of market trends.
- **Efficiency:** Automates the tracking of SMA intersections.
- **User-Friendly:** Applicable for both novice and experienced traders.
### **How It Operates:**
- The indicator computes four different SMAs and presents their current values systematically.
- It triggers a real-time alert when the price crosses any SMA, instantly notifying the trader.
- Visual cues are plotted on the chart when any two SMAs intersect, indicating the type of cross.
### **Enhance Your Trading Experience!**
The Dynamic SMA Intersection Alert Indicator is designed to refine your trading experience and assist in making informed and timely trading decisions. Leverage this tool to stay abreast of market trends and enhance your market understanding!
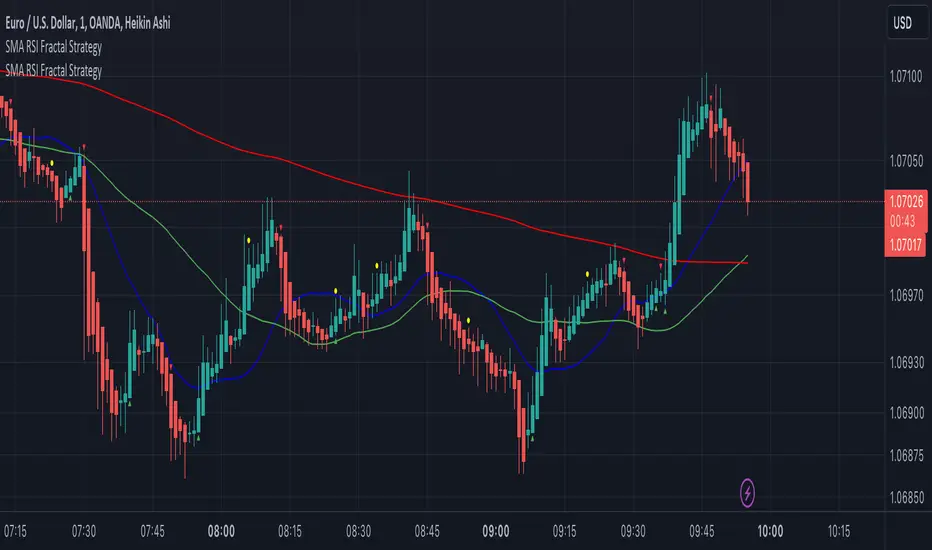
SMA RSI Fractal Entry & Exit PointsUsing the 20, 50, 200 SMA, RSI, and Fractals to indicate when to exit buy/sells or move SL if your not trailing to protect profits
JK - Q SuiteThis indicator is primarily for identifying pauses in Stage 2 uptrends, modelled on Qullamaggie's style of trading, but fits well with many traders including William O' Neil. or Mark Minervini.
I built this for my own purposes, and have gradually added range of tools into a single suite. My goal has also to be as clean as possible, while providing clear, actionable information.
This suite includes all of the following:
Moving averages (10, 20, 50, 200)
Coloured bars showing tightening price (blue under 75% of ADR, orange under 50% of ADR)
A 'markets' dashboard (top-right), showing the major indexes. Red if 10<20MA, or price <20MA
A 'sectors' dashboard (top-right, below markets). Red if 5<10MA, or price <10MA - see note below
Strength / Weakness information - two cells at the top, bottom-right. See below
Stock information - glanceable stock info as quick filters. The thresholds for ADR, Average volume, and Dollar Volume can be customised.
NOTE - if the 'tightening coloured candles' are not showing, the indicator needs to be at the top of the stack. Click the triple squares at the very bottom-right of the TradingView interface, and drag the indicator to the top, should work then!
=============
Sectors
These are based on the 11 official Sectors, tracked using index funds (XLY, XLK etc). HOWEVER, TradingView does NOT use the official 11 sectors - therefore I've done my best to match TradingViews ones to the official ones, but doesn't always work... e.g. 'Electronic Technology' is typically semiconductors, which are classes as 'Industrials', but Apple is the same sector in TV, but classed as 'Technology' using the official 11 Sectors.
If TradingView move to use the official 11 I'll update this, but for now it's a best guess and will sometimes be wrong, sorry!
Strength / Weakness information
This was an experiment in trying not to give too much back to the market! Typically the strategy would be to sell if price closes below 10MA (Weakness), however there may be large pops that can be advantageous to sell into.
The 'Strength' information (top cell, bottom-right), checks how far the price is extended above 10MA - this is customisable as a multiple of ADR. You may find that in weak markets (like now), it can be best to take profits quickly - in good markets, you could increase this as stocks make bigger or more sustained moves.
=============
While I'm not the best coder - and I've hacked and tried and changed different things - this has been a labour of love and essential for me.
If you have any suggestions, while I may or may not be able to implement them, I'm certainly open to ideas!
