Understanding contract sizes in a strategyThis simple strat fires up on green bars, down on red bars. cannot get any simpler. So, it's a good example to check how returns are calculated.
First, the internal firing mechanism for the strategy.entry function is something hardcore. As result, the entry points can be confusing, and seem to appear in a wrong bar (as the 2nd and 3rd signals are good examples), but i'll put that aside to keep it simple. And, because i don't yet get it myself ;)
The example is simple, so that numbers can be followed easy. Chart in BTC/USD, so USD is the "base" currency used by strat to calculate. A contract/unit is the value of 1 unit in base currency. 1 Apple share is 600$, 1 bitcoin is 600$, 1 oz gold is 1330 bucks. So, here in each bar, the value of 1 contract is the value of the BTC in USD. simple as that.
The strat properties, can be passed as input fields (line 2) or accessed/changed in the right click->properties pop-up. To make it easier, initial capital is 1000 bucks, and "order size" is 1 contract. This means that the strat will open a position of 1 BTC when it fires. Value "Initial capital" makes no difference at all, at least with these choices. It's just for show. Try to put 1$ and 1 contract, the strat will still trade anyway. It manages to trade 1 contract(or BTC) values at ~600$, with a single dollar. nice ;)
Check the chart. see the little blue "BarUp +1" ? that's it, strat goes long 1 BTC. there's a little blue triangle on the bar, points to the value of entry.
Then later, on second move, the "BarDn -2", the strat goes short 2BTC. 1BTC to close the long +1 more to open a short.
The profit here is the difference between the value of the long opening and the long closing. The extra BTC (shorted) is part of the next position. Since this dumb strat just reverses the direction, there are always +2, -2 , +2.... 1 to close previous position, 1 to open another. At the strategy tester tab, the option "list of trades" shows in details each of the moves
Checking each move and comparing what we see with the chart itself helps to achieve ilumination :)
Bonus feature: as soon as you get it, try to increase the option "pyramiding" and see how the strat adds more contracts, and how it reverses the positions. sometimes it even makes sense!!!! :)
Cerca negli script per "涨幅大于1000的股票"

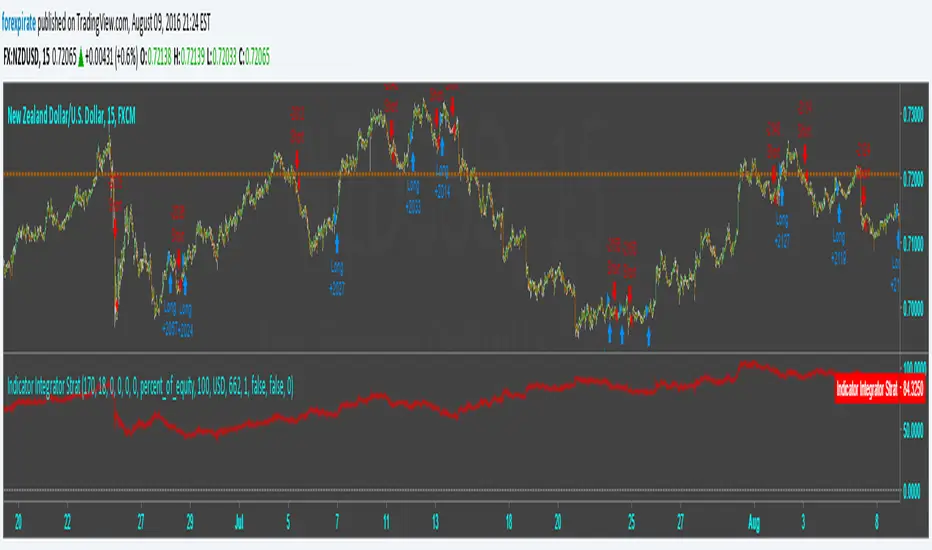
Indicator Integrator Strat <<<<<< Updated again, second2nd patch
Found an error in the orders. Script was making double orders at times. I fixed it. It is tuned as such:
NZDUSD
15 min chart
starting $USD to show 1000 contracts for minicontract with FXCM (start date 3-18 $633 ** see note)
Indicator plots Starting equity-trade gain and loses-number of trades time spread = net money
** with 1:50 leverage it requires $16 for one 1,000 contract.
$84 net vs $16 initial balance is 456% in 109 days.
* If you find errors please comment.
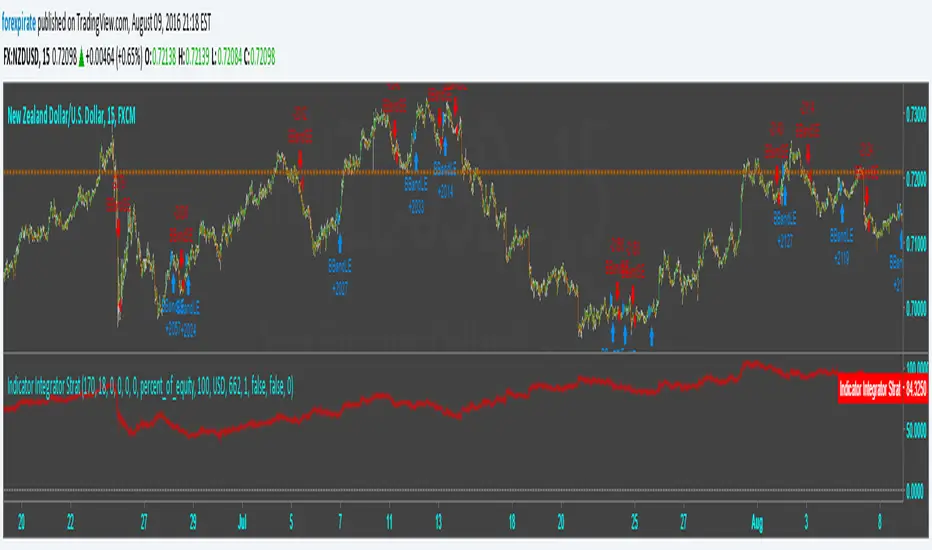
Indicator Integrator Strat <<<<<< UPDATED with CorrectionFound an error in the orders. Script was making double orders at times. I fixed it. It is tuned as such:
NZDUSD
15 min chart
starting $USD to show 1000 contracts for minicontract with FXCM (start date 3-18 $633 with 1:50 leverage)
Indicator plots ==> Starting equity - (trade gain and loses) - (number of trades) * (spread) = true balance estimate
The Always Winning Holy Grail Strategy - Not (by ChartArt)How to win all the time if 1+1 = 2
The most upvoted strategies on Tradingview are those which seemingly work 100%, but they actually don't at all because they are repainting and would not work in live trading reality. They are using the multi-time-frame strategy testing bug and thereby trade during the backtest on close prices before the bar has closed in reality.
Top list of these cheating repainting strategies:
1569 upvotes ANN Strategy
877 upvotes Vdub FX SniperVX3 Strategy
481 upvotes Get Trend Strategy
I guess there are much more strategies among the top upvoted strategies on Tradingview which cheat with a multi-time-frame close price, but three examples are enough. The ANN Strategy uses the daily close price as multi-time-frame and cheats with that. The Vdub FX SniperVX3 Strategy uses the half-day (720 minute) close price to cheat and the Get Trend Strategy uses the 160 minute bar close for repaint cheating (at least here the author of this strategy explains that his strategy is only demo and would not work, which might be the reason why it has 1000 less upvotes than the ANN Strategy. I already wrote months ago a comment underneat these strategies to explain this issue but it hasn't stopped these strategies from getting more and more upvotes and staying in the top list.
I thought this way of cheating is lame, so I invented a new way to cheat my way to seemingly reach 100% profitable trades all the time by going long if 1+1 is equal to 2. Welcome to super wide stop losses. Simply use a extreme unrealistic large stop loss and take profit after a realistic amount of pips and according to Tradingview's current backtest module you win 100% all the time. Yay! :)
My recommendation for the Tradingview team is to add a function to let the user define a stop out and margin call level and maybe set a realistic setting as default, like 100%.
Please don't trade with this strategy!

AK TREND ID v1.00Hello,
"Are we at the top yet ? "........ " Is it a good time to invest ? " ......." Should I buy or sell ? " These are the many questions I hear and get on the daily basis. 1000's of investors do not know when to go in and out of the market. Most of them rely on the opinion of "experts" on television to make their investment decisions. Bad idea.Taking a systematic approach when investing, could save you a lot of time and headache. If there was only a way to know when to get in and out of the market !! hmmmm. The good news is that there many ways to do that. The bad news is , are you disciplined enough to follow it ?
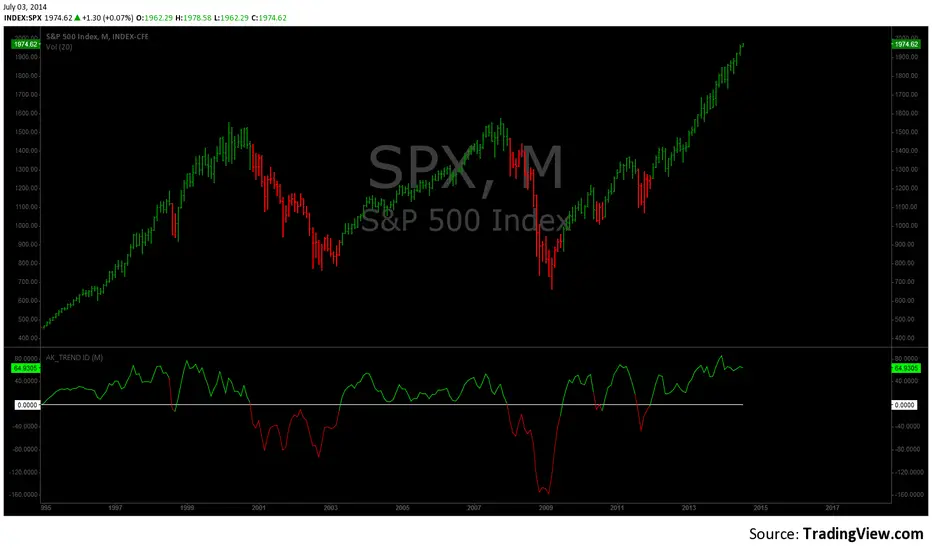
I coded the AK_TREND ID specifically to identified trends in the SPX or SPY only . How does it work ? very simply , I simply plot the spread between the 3 month and 8 month moving average on the chart.
If the spread > 0 @ month end = BUY
if the spread < 0 @ month end = SELL
The AK TREND ID is a LAGGING Indicator , so it will not get you in at the very bottom or get you out at the very top. I did a backtest on the SPX from 1984 to 7/2/2014 (yesterday), The rule was to buy only when the AK TREND ID was green. let's look at the result:
14 trades : 11 W 3 L , 78.75 % winning %
Biggest winner (%) = 108 %
Biggest loser (%) = -10.7 %
Average Return = 27 %
Total Return since 1984 = 351.3 %
You can see the result in detail here : docs.google.com
Although the backtesting results are good, the AK TREND ID is not to be used as a trading system. It is simply design to let you know when to invest and when to get out. I'm working a more accurate version of this Indicator , that will use both technical and fundamental data. In the mean time , I hope this will give some of you piece of mind, and eliminate emotions from your trading decision. Feel free to modify the code as you wish, but please share your finding with the rest of Trading View community.
All the best
Algo
Confluence script This is modified version of Dale Legan's "Confluence" indicator written by Gary Fritz.
================================================================
Here is Gary`s commentary:
* I moved the core Confluence computations into a Confluence function.
Since the Confluence indicator returned several "states" (bull, bear, grey, and zero),
he modified the return value a bit:
-9 to -1 = Bearish
-0.9 to 0.9 = "grey" (and zero)
1 to 9 = Bullish
The "grey" range corresponds to the "grey" values plotted by Dale's indicator, but
they're divided by 10.
So -0.4 is equivalent to "grey -4" in Dale's indicator.
* I got rid of a bit of extra computation in the function. I didn't try to do a hard-core
Pierre-style optimization :-), but I noticed several significant chunks of calculation were
being done several times each bar, and I commented them out and replaced them with an intermediate
variable. It still calls sine/cosine a dozen times on each bar, which accounts for the bulk of the
processing time, but I think it's a bit easier to understand what the code is doing this way. (It also
seems to work better -- see below.) For the most part I didn't try to use mnemonic names for these
intermediate variables, because I don't understand exactly what the values represent!!
* I'm appending a simplified Confluence indicator using the function.
* I've also appended a simple Confluence system. This system sets an entry stop above/below the current
bar if Confluence goes into bull/bear mode, and similarly sets an exit stop below/above the bar where it
exits bull/bear mode. There's also an optional "aggressive" stop mode that tightens the stops if the market
moves in your direction; for example, if the high is 1000 and your "Trigger" offset is 2, the initial stop
is set at 1002. If the next bar has a high of 997, the stop is tightened to 997+2=999.
Interestingly, when I first wrote this system, I ran into a strange MaxBarsBack problem. The Confluence
indicator worked just fine with a MaxBarsBack setting of "Auto-Detect." But systems don't have a setting
like that -- you have to specify a fixed value. But NO fixed value (up to the maximum of 999) worked for
either the system OR the indicator! And I couldn't see anywhere that it was looking back that many bars.
Then, when I did the optimization on the Confluence code, the MaxBarsBack problem mysteriously disappeared.
Sometimes TradeStation is just spooky... Any ideas what happened?
I've appended a sample system report for the system on SPX, using the default parameters. The system actually
does pretty well. It probably won't make anyone rich, but I thought some folks might enjoy playing with it.
There are some other things you could do with it -- e.g. it might be interesting to change it to look for
long opportunities when Confluence hits -9, and short when it hits 9.
