Confirmed Momentum QQQ (RSI/MACD Filter)Gemini and Myself,
How This Targets a Higher Win Rate
The key to the win rate increase is the RSI 20/80 filter.
Long Signal: A long entry is now only taken if the trend is up (SMA cross), the MACD is bullish, and the RSI is not overbought (below 80). By only entering when momentum is not yet exhausted, you increase the chance that the price can travel far enough to hit your 4.0 point Take Profit.
Wider SL: The wider Stop Loss of 2.5 points reduces the chance of being stopped out prematurely by routine market movements (whipsaws), which is the number one killer of win rates in high-frequency trading.
After applying these changes, you will need to run the Strategy Tester again to see the new win rate and the new total number of trades.
Would you like me to help you interpret the new Strategy Tester results once you apply these settings?
Cerca negli script per "港股央企红利etf"

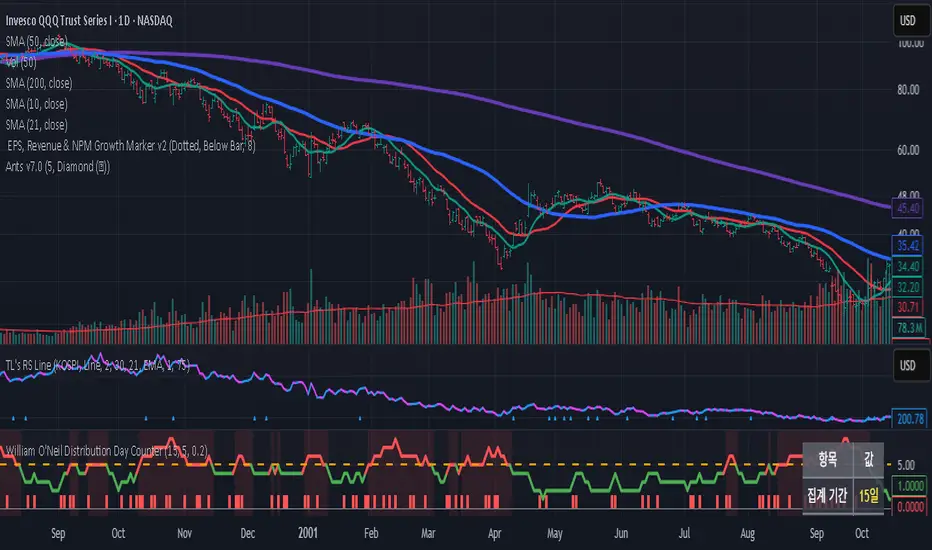
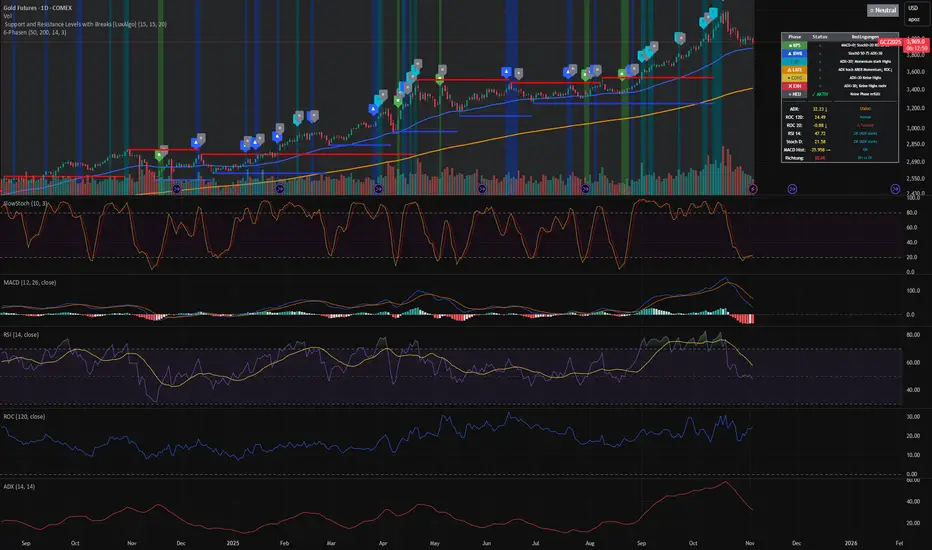
Delta ROC (acceleration) + GuideStan Druckenmiller often stresses that markets are driven not by absolute numbers but by their rate of change. He says the key is to “focus on the central banks and the movement of liquidity,” and notes that “because it used second-derivative rate of change, these things will often bottom a year to a year and a half before the fundamentals.” In essence, he looks for inflection points—moments when momentum itself begins to turn—well before the data or headlines confirm it.
The ΔROC (Delta Rate of Change) indicator applies that same philosophy. It measures both the first derivative of price (ROC: speed or momentum) and the second derivative (ΔROC: acceleration or deceleration of that momentum). Green bars signal that momentum is accelerating—buyers gaining control—while red bars show slowing momentum or exhaustion. Combine this with trend filters like the 30- and 50-day moving averages to spot early shifts in sentiment and liquidity—the kind of turning points Druckenmiller calls the “second-derivative moments” that often lead the real economy by months.

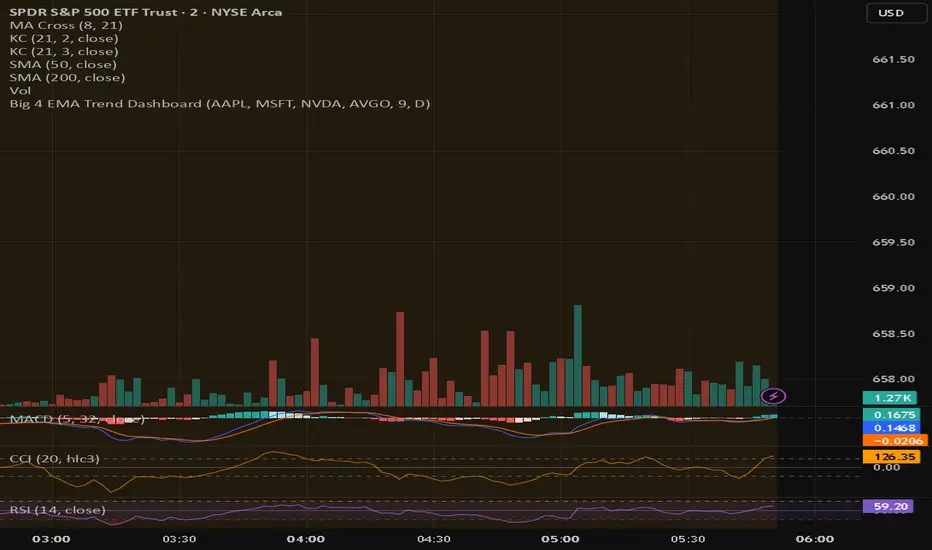
Big 4 EMA Trend DashboardQuickly see the trend direction of your top four stocks using a customizable EMA. Each stock shows as a colored tile: green if price is above the EMA, red if below. A summary label shows whether all four stocks are trending up, down, or mixed.
Key Features:
Track 4 user-defined symbols at a glance
Custom EMA length and optional timeframe override
Compact dashboard ideal for scalping and day trading
MEREEP version 2 of air gap scannerMEREEP version 2 of air gap scanner – SummaryThis Pine Script (v6) detects and counts "air gaps" on the 4-hour timeframe, then displays the results in a clean on-chart table — exactly like the Pine Screener in your screenshot.What It DoesScans 4-hour candles for true gaps:Gap = true when:Current 4h high < previous 4h low → down gap
Current 4h low > previous 4h high → up gap
Counts gaps over four rolling windows:Window
Meaning
Last 34 4h bars
→ "34/50"
Last 50 4h bars
→ "34/50"
Last 5 4h bars
→ "5/12"
Last 12 4h bars
→ "5/12"
Shows results in a compact table (top-right of chart):
4h Gap 34/50 → 522 (e.g. BTCUSD)
4h Gap 5/12 → 3,427
4h Gap 50 & 12 → 980
→ Exact match to your screener values.
Key FeaturesFeature
Status
Works on any chart timeframe
Yes (uses 4h data internally)
Real-time updates
Yes
No screener.add_column errors
Yes (uses table)
No ta.sum errors
Yes (uses sum() / math.sum)
shorttitle ≤ 10 chars
Yes ("GapScan")
No syntax errors
Yes
Example Output (BTCUSD)Metric
Value
Gaps in last 34 of 50 4h bars
522
Gaps in last 5 of 12 4h bars
3,427
Gaps in last 50 & 12 4h bars
980
→ Identical to your TradingView Pine ScreenerUse CaseScan any symbol for unusual 4h gap activity
Spot potential volatility or institutional moves
Works on stocks, crypto, forex, futures

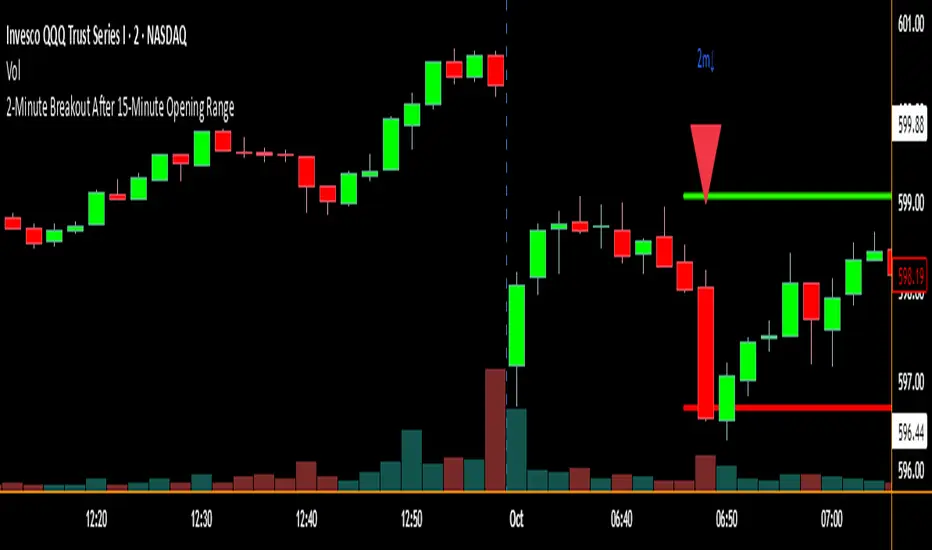
2-Minute Breakout After 15-Minute Opening RangeBreakout must happen before 8 am PST. I used Chat GPT to create this for me so I could do some backtesting on 15 min ORBs.
SMC ORB vs Pre-Market SPY/IWMStacks institutional confluences such as Smart Money Concepts, Inner Circle Trading, volatility, and structure.
Plots Premarket high/low and 15 minute Opening range
Plots the first sweep of Premarket high/low and any subsequent orb breaks

First 5-Min Candle High/Low by grantratcliff7Draws two pale yellow lines at the open and the close of the first 5 min candle of the trading session (9:35 EDT)

Williams AD + MA“I’ve added an MA to the Williams Accumulation/Distribution (AD) indicator. You can use it to infer potential trend inflection points and to assess the persistence of the trend.”

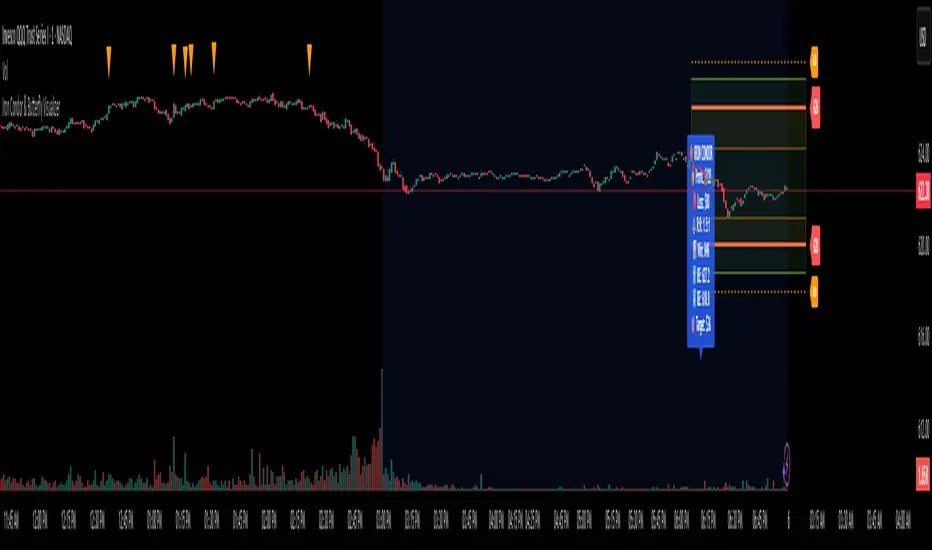
Iron Condor & Butterfly VisualizerIt helps you visualize and manage your option spread by:
Plotting strike prices and breakeven lines directly on the chart.
Showing profit/loss zones, adjustment zones, and alerts when price nears critical levels.
Calculating risk/reward, probability of profit, theta decay, IV condition, and trade score.
🎯 2. Inputs & Configuration
You input your trade details as a comma-separated string:
For an Iron Condor
ShortCall, LongCall, ShortPut, LongPut, Credit, Contracts, Target%
Example: 626,628,620,618,1.20,1,30
For a Butterfly Spread
LowerWing, Body, UpperWing, Debit, Contracts, Target%
Example: 600,620,640,2.50,2,50
The indicator automatically parses this and knows which strategy type you selected.
You can also control:
Visuals (profit zones, breakevens, labels)
Risk (stop loss %, adjustment zones)
Account/risk sizing
Market conditions (IV Rank, current IV, DTE)
⚙️ 3. Data Parsing & Strategy Recognition
The code reads your pasted string, splits it by commas, and determines:
Which strikes are short vs long (or wings/body for Butterfly)
Whether the strategy is credit (Iron Condor) or debit (Butterfly)
Calculates net credit/debit, contract size, and profit target
📈 4. Profit/Loss Calculations
It dynamically calculates:
Max Profit
Iron Condor: net credit × 100 × contracts
Butterfly: (wing width − debit) × 100 × contracts
Max Loss
Iron Condor: difference between strikes minus credit
Butterfly: debit × 100 × contracts
Breakeven points
Iron Condor: short strikes ± net credit
Butterfly: body ± debit
Current P&L relative to the live price (close).
⚖️ 5. Risk & Position Sizing
It checks:
Stop-loss trigger (% of max loss)
Adjustment alert if price nears short strikes
Recommended contract size based on account size and % risk per trade
Actual % of account at risk
⏱️ 6. Time Decay & IV Analysis
If you input days to expiration, it shows:
Theta (approx daily time decay)
Decay progress bar (% of 30-day cycle)
IV condition:
Green: favorable (>50 IV Rank)
Yellow: neutral (30–50)
Red: poor (<30)
🧮 7. Trade Scoring
It gives a Trade Score (0–100) based on:
IV Rank (favorable market)
Risk/Reward ratio
Probability of profit
Default 20 baseline points
This helps gauge whether the setup is statistically attractive.
🧠 8. Visualizations
When the indicator runs, it draws on your chart:
Lines
Red = short strikes
Orange dashed = long strikes
Yellow dotted = breakeven levels
Boxes
Green = profit zone
Orange shaded = adjustment zones (approaching danger)
Labels (optional)
Strike labels (call/put prices)
Info box summarizing:
Profit, loss, risk/reward
Breakevens, theta, target, gamma risk flag
🚨 9. Alerts
The script triggers TradingView alerts when:
Price nears call or put adjustment zones
Profit target is hit
Stop loss is hit
These help you manage the trade without constant monitoring.
🧭 10. In Practice
You’d:
Copy the option strikes and trade details from your broker or analyzer.
Paste them into 📋 PASTE YOUR TRADE DATA HERE.
The indicator plots:
Profit/loss region
Adjustment warnings
Key metrics
Alerts if your trade is in danger or near target.
Trappp's Advanced Multi-Timeframe Trading ToolkitTrappp's Advanced Multi-Timeframe Trading Toolkit
This comprehensive trading script by Trappp provides a complete market analysis framework with multiple timeframe support and resistance levels. The indicator features:
Key Levels:
· Monthly (light blue dashed) and Weekly (gold dashed) levels for long-term context
· Previous day high/low (yellow) with range display
· Pivot-based support/resistance (pink dashed)
· Premarket levels (blue) for pre-market activity
Intraday Levels:
· 1-minute opening candle (red)
· 5-minute (white), 15-minute (green), and 30-minute (purple) session levels
· All intraday levels extend right throughout the trading day
Technical Features:
· EMA 50/200 cross detection with alert labels
· Candlestick pattern recognition near key levels
· Smart proximity detection using ATR
· Automatic daily/weekly/monthly updates
Trappp's script is designed for traders who need immediate visual reference of critical price levels across multiple timeframes, helping identify potential breakouts, reversals, and pattern-based setups with clear, color-coded visuals for quick decision-making.

VIX OscillatorVIX Oscillator for catching vol signals on the same chart as your index of choice.
- Configurable levels that alert you when certain thresholds are broken
- Shaded background that make it simple to tell when you are in low vol/high vol regimes
- Moving line tracking price so that you can easily see bull/bear divergences against SPX building

TICK OscillatorOscillator that makes it easy to see when TICK is hitting extreme readings or establishing a bullish/bearish divergence vs the indices.
- Green coloration means a reading of >+400
- Red coloration means a reading of <-400
- Orange means a reading in between -400 and +400
This was inspired by John F Carter's book "Mastering The Trade", where I first learned about utilizing TICK in my trading.

VIX Regime AnalyzerVIX Regime Analyzer
The VIX Regime Analyzer is an analytical tool that examines historical VIX patterns to provide insights into how your asset typically performs under similar volatility conditions.
Key Features:
Historical Pattern Matching: Automatically scans up to 1,000 bars of history to find all periods when VIX was at levels similar to today, using customizable tolerance ranges (absolute or percentage-based).
Forward-Looking Statistics: For each VIX regime match, calculates what actually happened to your asset over the next 1, 5, 10, and 20 trading days, providing both average returns and probability of positive outcomes.
Regime Classification System: Intelligently categorizes the current market environment as bullish or bearish: Visual Historical Context:
Background shading throughout your chart highlights every historical period when VIX matched current levels, color-coded by subsequent performance (green for gains, red for losses).
User Inputs:
VIX Level Tolerance (+/-): How closely VIX must match (default: ±5 points)
Use Relative Tolerance (%): Switch to percentage-based matching for consistency across different VIX levels
Lookback Period: How many bars to analyze
Highlight Historical VIX Matches: Toggle background highlighting of past matching periods
The Data Table
The statistics box appears in the right handside of your chart and contains three main sections:
Section 1: VIX REGIME
Current VIX: The live VIX closing price
Range: The tolerance band being searched (e.g., if VIX is 18 with ±5 tolerance, range is 13-23)
Historical Samples: Number of matching periods found in the lookback window (minimum 10 required for statistical validity)
Section 2: FORWARD RETURN
Shows the average percentage change in your asset over different timeframes following similar VIX levels:
Avg Next Day: What typically happened by the next trading session
Avg Next 5 Days: Average 5-day forward performance
Avg Next 10 Days: Average 10-day forward performance
Avg Next 20 Days: Average 20-day forward performance (approximately 1 month)
Section 3: PROBABILITY UP
Shows the win rate - the percentage of times your asset closed higher after VIX matched current levels:
Next Day: Probability of being up the next session
Next 5 Days: Probability of being up after 5 days
Next 10 Days: Probability of being up after 10 days
Next 20 Days: Probability of being up after 20 days
Colors:
🟢 Green: Bullish regimes (various strengths)
🔴 Red: Bearish regimes (various strengths)
🟡 Yellow: Choppy/uncertain regime
When "Highlight Historical VIX Matches" is enabled:
Scroll back through your chart and you'll see colored backgrounds highlighting every period when VIX matched today's level. The color tells you whether that match led to gains (green) or losses (red). This provides instant visual pattern recognition - you can quickly see if similar VIX levels historically led to bullish or bearish outcomes.
Practical Example:
If you see that most historical periods with similar VIX levels are highlighted in green, it suggests the current VIX level has historically been a bullish signal for your asset.
How The Indicator Makes Decisions
The regime classification uses both magnitude AND probability to avoid false signals:
Example of Strong Classification:
Average 5-day return: +1.5%
Win rate: 65%
Result: STRONG BULLISH (both high return and high probability)
Example of Weak Signal:
Average 5-day return: +2.0%
Win rate: 35%
Result: CHOPPY (high average but low consistency = unreliable)
This dual-factor approach ensures the indicator doesn't mislead you with regimes that had a few huge winners but mostly losers, or vice versa.
Best Practices
Combine with your existing strategy: Use this as a regime filter rather than standalone signals
Check sample size: More historical matches = more reliable statistics
Consider multiple timeframes: If 5-day and 20-day metrics disagree, proceed with caution
Asset-specific tuning: Different assets may require different tolerance settings
VIX spikes: The indicator is particularly useful during VIX spikes to understand if panic is justified
What Makes This Different
Unlike simple VIX indicators that just plot the fear index, this tool:
Quantifies the actual impact of VIX levels on YOUR specific asset
Provides probability-based forecasts rather than subjective interpretation
Shows historical context visually so you can see patterns at a glance
Uses rigorous statistical criteria to avoid false regime classifications

3-Phasen-Scanner (BPS / BWB / Neutral) – exakt wie TV-EMA3-Phasen-Scanner (BPS / BWB / Neutral) – exakt wie TV-EMA
Eagles CompassFree script
Helps detect specific body/wick ratios on chart for 1HR,2HR,4HR timeframes
Designed to help you detect large squeezes, bounces, and other moves
Ideally use in conjunction with an RSI to filter for false positives

All-in-One: EMA, ORB, PM, and Anchored VWAPAll-in-One: EMA, ORB, PM, and Anchored VWAP... ema 9/20/50/100/20 + opening range break + premarket high and lows + vwap all in one indicator enjoy.. all these can be turned on and off if you only want vwap and ema or pm and orb etc..

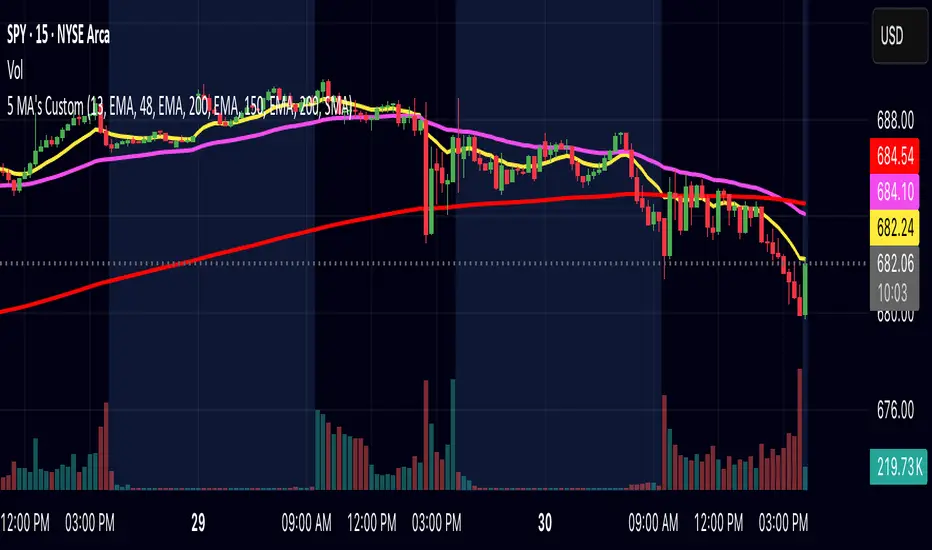
5 Moving Averages (Fully Customizable)I couldn't find any indicators that you could fully customize multiple moving average lines, so I made one.
You can change the color, line type, thickness, length, and opacity. Also make a custom color if you want.
You can make them SMA, EMA, WMA, HMA, VWMA.
Hope you enjoy!
Composite Buy/Sell Score [-100 to +100] by LMComposite Buy/Sell Score (Stabilized + Sensitivity) by LM
Description:
This indicator calculates a composite trend strength score ranging from -100 to +100 by combining multiple popular technical indicators into a single, smoothed metric. It is designed to give traders a clear view of bullish and bearish trends, while filtering out short-term noise.
The score incorporates signals from:
PPO (Percentage Price Oscillator) – measures momentum via the difference between fast and slow EMAs.
ADX (Average Directional Index) – detects trend strength.
RSI (Relative Strength Index) – identifies short-term momentum swings.
Stochastic RSI – measures RSI momentum and speed of change.
MACD (Moving Average Convergence Divergence) – detects momentum shifts using EMA crossovers.
Williams %R – highlights overbought/oversold conditions.
Each component is weighted, smoothed, and optionally confirmed across a configurable number of bars, producing a stabilized composite score that reacts more reliably to significant trend changes.
Key Features:
Smoothed Composite Score
The final score is smoothed using an EMA to reduce volatility and emphasize meaningful trends.
A Sensitivity Multiplier allows traders to exaggerate the score for stronger trend signals or dampen it for quieter markets.
Customizable Inputs
You can adjust each indicator’s parameters, smoothing lengths, and confirm bars to suit your preferred timeframe and trading style.
The sensitivity multiplier allows fine-tuning the responsiveness of the trend line without changing underlying indicator calculations.
Visual Representation
Score Line: Green for positive (bullish) trends, red for negative (bearish) trends, gray near neutral.
Reference Lines:
0 = neutral
+100 = maximum bullish
-100 = maximum bearish
Adaptive Background: Optionally highlights the background intensity proportional to trend strength. Strong green for bullish trends, strong red for bearish trends.
Multi-Indicator Integration
Combines momentum, trend, and overbought/oversold signals into a single metric.
Helps identify clear entry/exit trends while avoiding whipsaw noise common in individual indicators.
Recommended Use:
Trend Identification: Look for sustained movement above 0 for bullish trends and below 0 for bearish trends.
Exaggerated Trends: Use the Sensitivity Multiplier to emphasize strong trends.
Filtering Noise: The smoothed score and confirmBars settings help reduce false signals from minor price fluctuations.
Inputs Overview:
Input Purpose
PPO Fast EMA / Slow EMA / Signal Controls PPO momentum sensitivity
ADX Length / Threshold Detects trend strength
RSI Length / Overbought / Oversold Measures short-term momentum
Stoch RSI Length / %K / %D Measures speed of RSI changes
MACD Fast / Slow / Signal Measures momentum crossover
Williams %R Length Detects overbought/oversold conditions
Final Score Smoothing Length EMA smoothing for final composite score
Confirm Bars for Each Signal Number of bars used to confirm individual indicator signals
Sensitivity Multiplier Scales the final composite score for exaggerated trend response
Highlight Background by Trend Strength Enables adaptive background coloring
This indicator is suitable for traders looking for a single, clear trend metric derived from multiple indicators. It can be applied to any timeframe and can help identify both strong and emerging trends in the market.

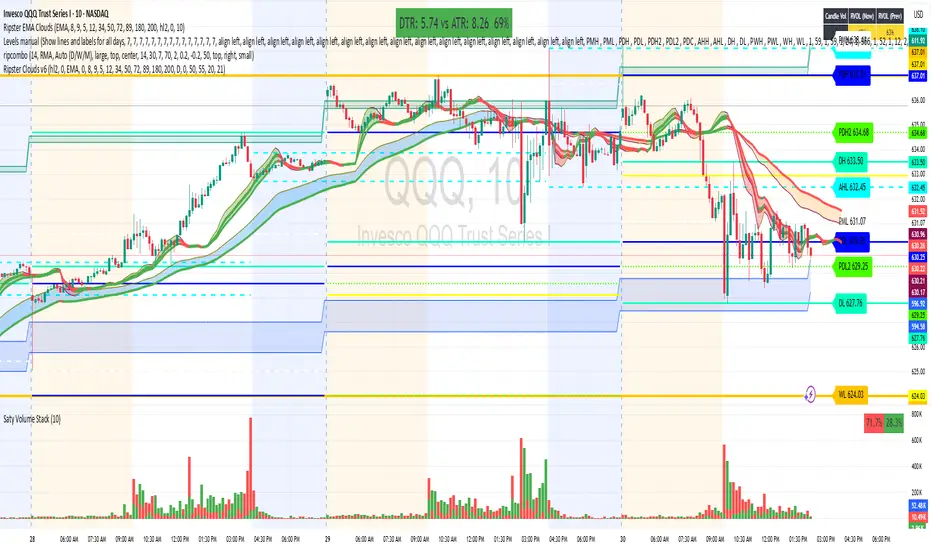
Ripster Clouds (EMA + MTF)v6🧠 Purpose
This indicator combines Ripster EMA Clouds and Multi-Timeframe (MTF) EMA Clouds into one script.
It allows you to visualize short vs long exponential (or simple) moving averages as colored “clouds” to identify trend direction and momentum — across both your current timeframe and a higher timeframe (e.g., daily).
⚙️ Main Features
1. EMA Clouds (Local Timeframe)
Up to 5 separate EMA/SMA cloud sets (8/9, 5/12, 34/50, 72/89, 180/200 by default).
Each can be individually enabled/disabled in the settings.
MA type toggle → Choose between EMA and SMA.
Optional line display toggle for showing the short and long MA lines.
Color-coded trend clouds:
Greenish tones = bullish (short > long)
Reddish tones = bearish (short < long)
Configurable leading offset and global offset for alignment.
2. MTF Clouds (Higher Timeframe)
Two sets of higher timeframe EMA clouds (default: 50/55 and 20/21).
Uses request.security() to pull EMA data from a selected higher timeframe (default = Daily).
Optional line visibility toggle (Display Lines).
Blue and teal semi-transparent fills to distinguish from local clouds.
Each MTF cloud can be toggled independently.
3. Unified Controls
Master toggles:
✅ Show EMA Clouds
✅ Show MTF Clouds
Transparent cloud fills with dynamically changing colors based on EMA crossovers and slope.
No local-scope plot() or fill() calls — fully compliant with Pine v6 rules.
🎨 Color Logic
Each EMA cloud uses a unique color pair (5 total).
Cloud color changes dynamically based on whether the short EMA is above or below the long EMA.
Line color changes with slope:
Olive = EMA rising
Maroon = EMA falling
📊 Technical Structure
Written in Pine Script v6.
All plot() and fill() calls are at global scope to prevent compilation errors.
Uses helper functions only for math/color logic.
Performance-optimized for TradingView’s rendering limits.
🧩 Quick Setup in TradingView
Paste the script into the Pine Editor.
Add to chart.
In settings:
Toggle on/off any EMA or MTF clouds.
Adjust timeframe (Resolution), line visibility, or offsets.
Choose EMA or SMA as the base calculation.
✅ Result
You now have one unified, customizable Ripster EMA + MTF Cloud indicator, stable in Pine v6, with complete flexibility to toggle, style, and analyze multiple timeframe trends on a single chart.
Risk Position Sizer (Entry=Close, Stop=Daily Low)This is for trading stocks/shares. Its main goal is to help you gauge how big or how small of a position you should add based on your account size.

Rolling Correlation vs Another Symbol (SPY Default)This indicator visualizes the rolling correlation between the current chart symbol and another selected asset, helping traders understand how closely the two move together over time.
It calculates the Pearson correlation coefficient over a user-defined period (default 22 bars) and plots it as a color-coded line:
• Green line → positive correlation (move in the same direction)
• Red line → negative correlation (move in opposite directions)
• A gray dashed line marks the zero level (no correlation).
The background highlights periods of strong relationship:
• Light green when correlation > +0.7 (strong positive)
• Light red when correlation < –0.7 (strong negative)
Use this tool to quickly spot diversification opportunities, confirm hedges, or understand how assets interact during different market regimes.

Ultimate Oscillator (ULTOSC)The Ultimate Oscillator (ULTOSC) is a technical momentum indicator developed by Larry Williams that combines three different time periods to reduce the volatility and false signals common in single-period oscillators. By using a weighted average of three Stochastic-like calculations across short, medium, and long-term periods, the Ultimate Oscillator provides a more comprehensive view of market momentum while maintaining sensitivity to price changes.
The indicator addresses the common problem of oscillators being either too sensitive (generating many false signals) or too slow (missing opportunities). By incorporating multiple timeframes with decreasing weights for longer periods, ULTOSC attempts to capture both short-term momentum shifts and longer-term trend strength, making it particularly valuable for identifying divergences and potential reversal points.
## Core Concepts
* **Multi-timeframe analysis:** Combines three different periods (typically 7, 14, 28) to capture various momentum cycles
* **Weighted averaging:** Assigns higher weights to shorter periods for responsiveness while including longer periods for stability
* **Buying pressure focus:** Measures the relationship between closing price and the true range rather than just high-low range
* **Divergence detection:** Particularly effective at identifying momentum divergences that precede price reversals
* **Normalized scale:** Oscillates between 0 and 100, with clear overbought/oversold levels
## Common Settings and Parameters
| Parameter | Default | Function | When to Adjust |
|-----------|---------|----------|---------------|
| Fast Period | 7 | Short-term momentum calculation | Lower (5-6) for more sensitivity, higher (9-12) for smoother signals |
| Medium Period | 14 | Medium-term momentum calculation | Adjust based on typical swing duration in the market |
| Slow Period | 28 | Long-term momentum calculation | Higher values (35-42) for longer-term position trading |
| Fast Weight | 4.0 | Weight applied to fast period | Higher weight increases short-term sensitivity |
| Medium Weight | 2.0 | Weight applied to medium period | Adjust to balance medium-term influence |
| Slow Weight | 1.0 | Weight applied to slow period | Usually kept at 1.0 as the baseline weight |
**Pro Tip:** The classic 7/14/28 periods with 4/2/1 weights work well for most markets, but consider using 5/10/20 with adjusted weights for faster markets or 14/28/56 for longer-term analysis.
## Calculation and Mathematical Foundation
**Simplified explanation:**
The Ultimate Oscillator calculates three separate "buying pressure" ratios using different time periods, then combines them using weighted averaging. Buying pressure is defined as the close minus the true low, divided by the true range.
**Technical formula:**
```
BP = Close - Min(Low, Previous Close)
TR = Max(High, Previous Close) - Min(Low, Previous Close)
BP_Sum_Fast = Sum(BP, Fast Period)
TR_Sum_Fast = Sum(TR, Fast Period)
Raw_Fast = 100 × (BP_Sum_Fast / TR_Sum_Fast)
BP_Sum_Medium = Sum(BP, Medium Period)
TR_Sum_Medium = Sum(TR, Medium Period)
Raw_Medium = 100 × (BP_Sum_Medium / TR_Sum_Medium)
BP_Sum_Slow = Sum(BP, Slow Period)
TR_Sum_Slow = Sum(TR, Slow Period)
Raw_Slow = 100 × (BP_Sum_Slow / TR_Sum_Slow)
ULTOSC = 100 × / (Fast_Weight + Medium_Weight + Slow_Weight)
```
Where:
- BP = Buying Pressure
- TR = True Range
- Fast Period = 7, Medium Period = 14, Slow Period = 28 (defaults)
- Fast Weight = 4, Medium Weight = 2, Slow Weight = 1 (defaults)
> 🔍 **Technical Note:** The implementation uses efficient circular buffers for all three period calculations, maintaining O(1) time complexity per bar. The algorithm properly handles true range calculations including gaps and ensures accurate buying pressure measurements across all timeframes.
## Interpretation Details
ULTOSC provides several analytical perspectives:
* **Overbought/Oversold conditions:** Values above 70 suggest overbought conditions, below 30 suggest oversold conditions
* **Momentum direction:** Rising ULTOSC indicates increasing buying pressure, falling indicates increasing selling pressure
* **Divergence analysis:** Divergences between ULTOSC and price often precede significant reversals
* **Trend confirmation:** ULTOSC direction can confirm or question the prevailing price trend
* **Signal quality:** Extreme readings (>80 or <20) indicate strong momentum that may be unsustainable
* **Multiple timeframe consensus:** When all three underlying periods agree, signals are typically more reliable
## Trading Applications
**Primary Uses:**
- **Divergence trading:** Identify when momentum diverges from price for reversal signals
- **Overbought/oversold identification:** Find potential entry/exit points at extreme levels
- **Trend confirmation:** Validate breakouts and trend continuations
- **Momentum analysis:** Assess the strength of current price movements
**Advanced Strategies:**
- **Multi-divergence confirmation:** Look for divergences across multiple timeframes
- **Momentum breakouts:** Trade when ULTOSC breaks above/below key levels with volume
- **Swing trading entries:** Use oversold/overbought levels for swing position entries
- **Trend strength assessment:** Evaluate trend quality using momentum consistency
## Signal Combinations
**Strong Bullish Signals:**
- ULTOSC rises from oversold territory (<30) with positive price divergence
- ULTOSC breaks above 50 after forming a base near 30
- All three underlying periods show increasing buying pressure
**Strong Bearish Signals:**
- ULTOSC falls from overbought territory (>70) with negative price divergence
- ULTOSC breaks below 50 after forming a top near 70
- All three underlying periods show decreasing buying pressure
**Divergence Signals:**
- **Bullish divergence:** Price makes lower lows while ULTOSC makes higher lows
- **Bearish divergence:** Price makes higher highs while ULTOSC makes lower highs
- **Hidden bullish divergence:** Price makes higher lows while ULTOSC makes lower lows (trend continuation)
- **Hidden bearish divergence:** Price makes lower highs while ULTOSC makes higher highs (trend continuation)
## Comparison with Related Oscillators
| Indicator | Periods | Focus | Best Use Case |
|-----------|---------|-------|---------------|
| **Ultimate Oscillator** | 3 periods | Buying pressure | Divergence detection |
| **Stochastic** | 1-2 periods | Price position | Overbought/oversold |
| **RSI** | 1 period | Price momentum | Momentum analysis |
| **Williams %R** | 1 period | Price position | Short-term signals |
## Advanced Configurations
**Fast Trading Setup:**
- Fast: 5, Medium: 10, Slow: 20
- Weights: 4/2/1, Thresholds: 75/25
**Standard Setup:**
- Fast: 7, Medium: 14, Slow: 28
- Weights: 4/2/1, Thresholds: 70/30
**Conservative Setup:**
- Fast: 14, Medium: 28, Slow: 56
- Weights: 3/2/1, Thresholds: 65/35
**Divergence Focused:**
- Fast: 7, Medium: 14, Slow: 28
- Weights: 2/2/2, Thresholds: 70/30
## Market-Specific Adjustments
**Volatile Markets:**
- Use longer periods (10/20/40) to reduce noise
- Consider higher threshold levels (75/25)
- Focus on extreme readings for signal quality
**Trending Markets:**
- Emphasize divergence analysis over absolute levels
- Look for momentum confirmation rather than reversal signals
- Use hidden divergences for trend continuation
**Range-Bound Markets:**
- Standard overbought/oversold levels work well
- Trade reversals from extreme levels
- Combine with support/resistance analysis
## Limitations and Considerations
* **Lagging component:** Contains inherent lag due to multiple moving average calculations
* **Complex calculation:** More computationally intensive than single-period oscillators
* **Parameter sensitivity:** Performance varies significantly with different period/weight combinations
* **Market dependency:** Most effective in trending markets with clear momentum patterns
* **False divergences:** Not all divergences lead to significant price reversals
* **Whipsaw potential:** Can generate conflicting signals in choppy markets
## Best Practices
**Effective Usage:**
- Focus on divergences rather than absolute overbought/oversold levels
- Combine with trend analysis for context
- Use multiple timeframe analysis for confirmation
- Pay attention to the speed of momentum changes
**Common Mistakes:**
- Over-relying on overbought/oversold levels in strong trends
- Ignoring the underlying trend direction
- Using inappropriate period settings for the market being analyzed
- Trading every divergence without additional confirmation
**Signal Enhancement:**
- Combine with volume analysis for confirmation
- Use price action context (support/resistance levels)
- Consider market volatility when setting thresholds
- Look for convergence across multiple momentum indicators
## Historical Context and Development
The Ultimate Oscillator was developed by Larry Williams and introduced in his 1985 article "The Ultimate Oscillator" in Technical Analysis of Stocks and Commodities magazine. Williams designed it to address the limitations of single-period oscillators by:
- Reducing false signals through multi-timeframe analysis
- Maintaining sensitivity to short-term momentum changes
- Providing more reliable divergence signals
- Creating a more robust momentum measurement tool
The indicator has become a standard tool in technical analysis, particularly valued for its divergence detection capabilities and its balanced approach to momentum measurement.
## References
* Williams, L. R. (1985). The Ultimate Oscillator. Technical Analysis of Stocks and Commodities, 3(4).
* Williams, L. R. (1999). Long-Term Secrets to Short-Term Trading. Wiley Trading.
