Short Swing Bearish MACD Cross (By Coinrule)This strategy is oriented towards shorting during downside moves, whilst ensuring the asset is trading in a higher timeframe downtrend, and exiting after further downside.
This script can work well on coins you are planning to hodl for long-term and works especially well whilst using an automated bot that can execute your trades for you. It allows you to hedge your investment by allocating a % of your coins to trade with, whilst not risking your entire holding. This mitigates unrealised losses from hodling as it provides additional cash from the profits made. You can then choose to hodl this cash, or use it to reinvest when the market reaches attractive buying levels. Alternatively, you can use this when trading contracts on futures markets where there is no need to already own the underlying asset prior to shorting it.
ENTRY
This script utilises the MACD indicator accompanied by the Exponential Moving Average (EMA) 450 to enter trades. The MACD is a trend following momentum indicator and provides identification of short-term trend direction. In this variation it utilises the 11-period as the fast and 26-period as the slow length EMAs, with signal smoothing set at 9.
The EMA 450 is used as additional confirmation to prevent the script from shorting when price is above this long-term moving average. Once price is above the EMA 450 the script will not open any shorts - preventing the rule from attempting to short uptrends. Due to this, this strategy is ideal for setting and forgetting.
The script will enter trades based on two conditions:
1) When the MACD signals a bearish cross. This occurs when the EMA 11 crosses below the EMA 26 within the MACD signalling the start of a potential downtrend.
2) Price has closed below the EMA 450. Price closing below this long-term EMA signals that the asset is in a sustained downtrend. Price breaking above this could indicate a bullish strength in which shorting would not be profitable.
EXIT
This script utilises a set take-profit and stop-loss from the entry of the trade. The take profit is set at 8% and the stop loss of 4%, providing a risk reward ratio of 2. This indicates the script will be profitable if it has a win ratio greater than 33%.
Take-Profit Exit: -8% price decrease from entry price.
OR
Stop-Loss Exit: +4% price increase from entry price.
Based on backtesting results across a selection of assets, the 45-minute and 1-hour timeframes are the best for this strategy.
The strategy assumes each order is using 30% of the available coins to make the results more realistic and to simulate you only ran this strategy on 30% of your holdings. A trading fee of 0.1% is also taken into account and is aligned to the base fee applied on Binance.
The backtesting data was recorded from December 1st 2021, just as the market was beginning its downtrend. We therefore recommend analysing the market conditions prior to utilising this strategy as it operates best on weak coins during downtrends and bearish conditions, however the EMA 450 condition should mitigate entries during bullish market conditions.
Cerca negli script per "科创板医药板块股票技术指标分析(MACD、成交量、支撑位压力位)"

Triple Exponential MACDA modification of the classic MACD to use Triple EMAs which tends to have less lag than the standard indicator. (I also have a Double Exp MACD indicator, I tend to use both simultaneously)
Alert conditions are pre-configured for simple line crosses and you can enable/disable the histogram from the indicator options menu.
Enjoy!

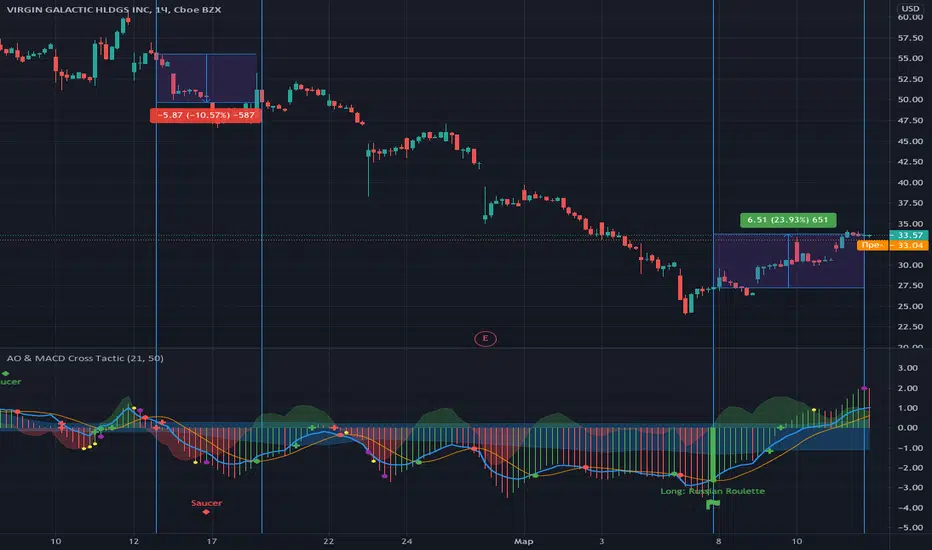
Awesome Oscillator & MACD Cross TacticOscillator for Tradingview based on MACD and Awesome Oscillator. This oscillator is designed to identify potential local growth or decline in prices as part of a trend movement.
For some ridiculous reason I am not allowed to attach screenshots of graphs and links on TradingView, so I hope that you will find my detailed instructions on my github page: github.com/samgozman/AO-MACD-cross-tradingview
EMA Cross and MACD Signal CombinedThe rule is simple.
When MACD crosses up, it is supposed to give a buy signal. However, before entering into a Long position, there is a need for a confirmation. This confirmation can be from a down trendline breakout or from another indicator.
In this case, I've chosen the Exponential Moving Average Cross to be as the confirmation.
The Buy Signal will appear when there it fulfills the following conditions:-
i. The MACD line is above the Signal Line
ii. The fast EMA crosses the Slow EMA
The Sell signal will appears when the opposite of the above condition is met.
This indicator is meant for the Swing Trader whom would like to hold a position for a long time.

Combing in MACD and MTFHi all, I'm trying to wedge in the MACD into a multiple timeframe. Scope is to create:
1) an alert when the MACD across all timeframes is positive,
2) an alert when the MACD across all timeframes is negative, and
3) one when neither of them is applicable.
Would anyone be so kind to give it some thoughts, please?
//@version=2
strategy(" Easy MTF Strategy", overlay=false)
TF_1_time = input("3", "Timeframe 1")
TF_2_time = input("5", "Timeframe 2")
TF_3_time = input("15", "Timeframe 3")
TF_4_time = input("30", "Timeframe 4")
fastLen = input(title="Fast Length", type=integer, defval=12)
slowLen = input(title="Slow Length", type=integer, defval=26)
sigLen = input(title="Signal Length", type=integer, defval=9)
= macd(close, fastLen, slowLen, sigLen)
width = 5
upcolor = green
downcolor = red
neutralcolor = blue
linestyle = line
TF_1 = security(tickerid, TF_1_time, open) < security(tickerid, TF_1_time, close) ? true:false
TF_1_color = TF_1 ? upcolor:downcolor
TF_2 = security(tickerid, TF_2_time, open) < security(tickerid, TF_2_time, close) ? true:false
TF_2_color = TF_2 ? upcolor:downcolor
TF_3 = security(tickerid, TF_3_time, open) < security(tickerid, TF_3_time, close) ? true:false
TF_3_color = TF_3 ? upcolor:downcolor
TF_4 = security(tickerid, TF_4_time, open) < security(tickerid, TF_4_time, close) ? true:false
TF_4_color = TF_4 ? upcolor:downcolor
TF_global = TF_1 and TF_2 and TF_3 and TF_4
TF_global_bear = TF_1 == false and TF_2 == false and TF_3 == false and TF_4 == false
TF_global_color = TF_global ? green : TF_global_bear ? red : white
TF_trigger_width = TF_global ? 6 : width
plot(1, style=linestyle, linewidth=width, color=TF_1_color)
plot(5, style=linestyle, linewidth=width, color=TF_2_color)
plot(10, style=linestyle, linewidth=width, color=TF_3_color)
plot(15, style=linestyle, linewidth=width, color=TF_4_color)
plot(25, style=linestyle, linewidth=4, color=TF_global_color)
exitCondition_Long = TF_global_bear
exitCondition_Short = TF_global
longCondition = TF_global
if (longCondition)
strategy.entry("MTF_Long", strategy.long)
shortCondition = TF_global_bear
if (shortCondition)
strategy.entry("MTF_Short", strategy.short)
strategy.close("MTF_Long", when=exitCondition_Long)
strategy.close("MTF_Short", when=exitCondition_Short)

MACD Divergence +This study plots MACD Divergences and has the option of plotting a Top Dog Trading - MOM and DAD Version of the MACD
MACD Histogram and outline change color when increasing or decreasing above or below the zero-line,
Background also changes color according to MACD Line cross of Signal Line and 0 line or The Direction of DAD
Plenty of Alerts so that you dont have to stare at the screen all day

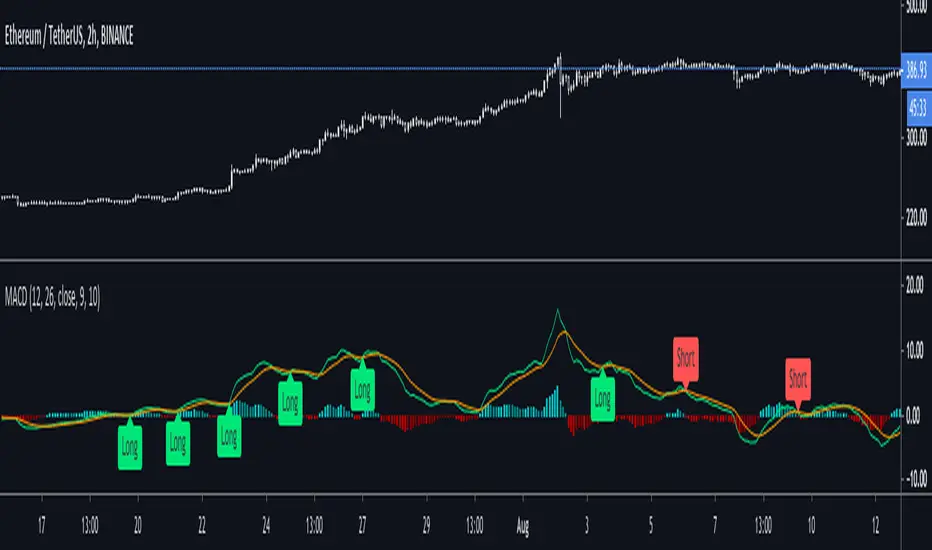
Easy to Use MACD+RSI Strategy
BEGINNERS REJOICE!
Easy to use strategy test using MACD with RSI as a confirming indicator. The code is structured to make it easy to manipulate the variables to your choosing.
EASY TO CHANGE CODE VARIABLES
LINE 2 = Change the amount you invest every trade and the currency
LINE 8/9/10 = Change the defval of each of these lines to backtest from a certain date
LINE 16/17/18 = Change the MACD sensitivity by changing the defval on each line
LINE 21 = Change the value after close toadjust the sensitivity of the RSI
LINE 37/39 = Change/remove the < and > variables for macdLine and rsivalue after the crossover/crossunder to adjust your buying point further.
As a beginner you may not feel comfortable with shorting stocks, therefore LINE 5 was added to only allows long positions.
Funny how a simple indicator can return such a high profitability. Couple this with some trend/exit strategies and you'll have something really special!
MACD, backtest 2015+ only, cut in half and doubledThis is only a slight modification to the existing "MACD Strategy" strategy plugin!
found the default MACD strategy to be lacking, although impressive for its simplicity. I added "year>2014" to the IF buy/sell conditions so it will only backtest from 2015 and beyond ** .
I also had a problem with the standard MACD trading late, per se. To that end I modified the inputs for fast/slow/signal to double. Example: my defaults are 10, 21, 10 so I put 20, 42, 20 in. This has the effect of making a 30min interval the same as 1 hour at 10,21,10. So if you want to backtest at 4hr, you would set your time interval to 2hr on the main chart. This is a handy way to make shorter time periods more useful even regardless of strategy/testing, since you can view 15min with alot less noise but a better response.
Used on BTCCNY OKcoin, with the chart set at 45 min (so really 90min in the strategy) this gave me a percent profitable of 42% and a profit factor of 1.998 on 189 trades.
Personally, I like to set the length/signals to 30,63,30. Meaning you need to triple the time, it allows for much better use of shorter time periods and the backtests are remarkably profitable. (i.e. 15min chart view = 45min on script, 30min= 1.5hr on script)
** If you want more specific time periods you need to try plugging in different bar values: replace "year" with "n" and "2014" with "5500". The bars are based on unix time I believe so you will need to play around with the number for n, with n being the numbers of bars.

MACD Remastered [CHE]MACD Remastered — Robust MACD with confirmed pivot-based divergence, optional signal bands, and ready-to-use alerts.
Summary
This indicator augments classic MACD with a robust, confirmed pivot-based divergence engine and an optional signal channel using Bollinger Bands. Divergence signals are only produced after a pivot is confirmed, which reduces noise from transient swings. A line-of-sight clearance check filters cases where the MACD histogram path contradicts the divergence, further cutting false flags. Histogram coloring clarifies momentum changes, while optional triangles project the same signals onto the main chart for quick context.
Motivation: Why this design?
Standard MACD divergence tools tend to fire early in volatile phases and flip during consolidation. The core idea here is to delay decision points until a pivot is confirmed and to validate the path between pivots. This addresses fake flips and improves signal credibility at the cost of some latency. Optional bands around the Signal line add context about compression and expansion without altering MACD’s core behavior.
What’s different vs. standard approaches?
Reference baseline: Classical MACD (fast and slow moving averages, Signal line, histogram) with simple divergence checks.
Architecture differences:
Confirmed pivot logic with left and right bars.
Line-of-sight clearance test across the histogram path between pivots.
Optional Signal-line Bollinger Bands with configurable length and width.
Composite “Any Divergence” alert plus separate regular and hidden alerts.
Optional main-chart triangles using forced overlay for at-a-glance context.
Practical effect: Fewer early or contradictory divergence signals, clearer momentum context via histogram colors and a visible Signal channel during compression and expansion.
How it works (technical)
The MACD line derives from a fast and a slow moving average on a chosen source. The Signal line smooths the MACD line using a selected moving average type and length. The histogram is the difference between MACD and Signal and is colored by direction and acceleration.
Divergence uses confirmed pivots: a pivot forms only after a set number of bars on the right side, so the event is locked in. The engine retrieves the last two relevant pivots and checks price movement versus the MACD histogram movement to classify regular or hidden divergence. A line-of-sight clearance routine traverses the histogram path between the two pivots and rejects the signal if the path invalidates the directional relationship. When enabled, Bollinger Bands are plotted around the Signal line; width scales with standard deviation. Programmatic alerts fire only on confirmed bars. No higher-timeframe requests are used.
Parameter Guide
Oscillator MA Type — Sets fast and slow MA family for MACD. Default: EMA. Tip: EMA is more responsive; SMA is steadier.
Fast Length — Fast MA period. Default: 12. Trade-off: Shorter is quicker but noisier.
Slow Length — Slow MA period. Default: 26. Trade-off: Longer reduces noise but adds lag.
Source — Price input. Default: Close. Tip: Use a stable source for consistency.
Signal MA Type — Moving average family for Signal. Default: EMA.
Signal Length — Smoothing of MACD into Signal. Default: 9. Trade-off: Longer smooths more, reacts slower.
Calculate Divergence — Enables divergence engine. Default: True.
Enable Bollinger Bands on Signal — Adds bands around Signal. Default: False.
BB Length — Sampling window for bands. Default: 20. Active: Only when bands are enabled.
BB StdDev — Band width in standard deviations. Default: 2.0. Bounds: between about zero point zero zero one and fifty.
Pivot Left / Pivot Right — Bars to the left and right that define a confirmed pivot. Default: five and five. Trade-off: Larger values mean stronger but slower pivots.
Min / Max Bars Between Pivots — Valid window between two pivots. Default: five and sixty. Tip: Increase minimum to reduce micro-divergences.
Detect Hidden — Include hidden divergence. Default: True.
Draw Lines — Draw connector lines on the MACD pane. Default: True.
Alerts: Enable / Regular / Hidden / Frequency / Prefix — Control alert emission, categories, cadence, and label. Defaults: Enabled, both categories on, once per bar close, prefix “MACD RM”.
Reading & Interpretation
Histogram: Columns above zero reflect positive momentum; below zero reflect negative momentum. Color shifts indicate momentum increasing or decreasing within each side.
MACD and Signal: Crosses and distance indicate momentum shifts and strength. When bands are enabled, touches and departures hint at compression and expansion around the Signal.
Divergence: Solid green lines and labels indicate regular bullish; solid red indicate regular bearish. Dashed teal and dashed orange denote hidden bullish and hidden bearish. Triangles on the main chart mirror these events for quicker visibility.
Practical Workflows & Combinations
Trend following: Use histogram color transitions with a structure filter such as higher highs and higher lows for long bias, or lower highs and lower lows for short bias. Divergence against the prevailing structure suggests caution or partial exits.
Exits and risk: In a long, regular bearish divergence near resistance can justify scaling out or tightening stops. Hidden divergence in the trend direction can support continuation but should not replace risk controls.
Multi-asset / Multi-timeframe: Works across liquid futures, forex, indices, and large-cap equities. Start with defaults on four-hour and daily; shorten lengths on intraday only when liquidity is strong.
Behavior, Constraints & Performance
Repaint and confirmation: Signals are anchored only after the right-side pivot bars complete; alerts trigger on confirmed bars. This intentionally adds latency to reduce noise.
No higher-timeframe requests: No `security` calls are used; repaint risk is primarily tied to live bars before confirmation.
Resources: Declared `max_bars_back` is five hundred. The divergence path check iterates between pivots, bounded by the maximum bars parameter. Line objects may accumulate; limits are set for lines and labels.
Known limits: Latency at sharp turns, potential misses during fast single-bar reversals, and sensitivity to extremely choppy sessions if minimum gap between pivots is set too low.
Sensible Defaults & Quick Tunin g
Starting point: EMA, twelve and twenty-six with Signal nine; pivots five and five; minimum five, maximum sixty; alerts on close; bands off.
Too many flips: Increase Signal length, raise pivot counts, and increase minimum bars between pivots. Consider disabling hidden divergence.
Too sluggish: Reduce pivot counts, lower Signal length, and enable bands to visualize early compression.
Cluttered chart: Keep lines off and rely on labels and main-chart triangles. Use the alert prefix to route events cleanly.
What this indicator is—and isn’t
This is a visualization and signal layer for MACD with confirmed, path-checked divergence and optional Signal bands. It is not a trading system, not predictive, and not a position management framework. Use it together with structure analysis, liquidity context, and explicit risk controls.
Disclaimer
The content provided, including all code and materials, is strictly for educational and informational purposes only. It is not intended as, and should not be interpreted as, financial advice, a recommendation to buy or sell any financial instrument, or an offer of any financial product or service. All strategies, tools, and examples discussed are provided for illustrative purposes to demonstrate coding techniques and the functionality of Pine Script within a trading context.
Any results from strategies or tools provided are hypothetical, and past performance is not indicative of future results. Trading and investing involve high risk, including the potential loss of principal, and may not be suitable for all individuals. Before making any trading decisions, please consult with a qualified financial professional to understand the risks involved.
By using this script, you acknowledge and agree that any trading decisions are made solely at your discretion and risk.
Do not use this indicator on Heikin-Ashi, Renko, Kagi, Point-and-Figure, or Range charts, as these chart types can produce unrealistic results for signal markers and alerts.
Best regards and happy trading
Chervolino

[AS] MACD-v & Hist [Alex Spiroglou | S.M.A.R.T. TRADER SYSTEMS] MACD-v & MACD-v Histogram
=======================================
Volatility Normalised Momentum 📈
Twice Awarded Indicator 🏆
=======================================
=======================================
✅ 1. INTRODUCTION TO THE MACD-v ✅
=======================================
I created the MACD-v in 2015,
as a way to deal with the limitations
of well known indicators like the Stochastic, RSI, MACD.
I decided to publicly share a very small part of my research
in the form of a research paper I wrote in 2022,
titled "MACD-v: Volatility Normalised Momentum".
That paper was awarded twice:
1. The "Charles H. Dow" Award (2022),
for outstanding research in Technical Analysis,
by the Chartered Market Technicians Association (CMTA)
2. The "Founders" Award (2022),
for advances in Active Investment Management,
by the National Association of Active Investment Managers (NAAIM)
=======================================
===================================================
❌ 2. WHY CREATE THE MACD-v ?
THE LIMITATIONS OF CONVENTIONAL MOMENTUM INDICATORS
====================================================
Technical Analysis indicators focused on momentum,
come in two general categories,
each with its own set of limitations:
(i) Range Bound Oscillators (RSI, Stochastics, etc)
These usually have a scaling of 0-100,
and thus have the advantage of having normalised readings,
that are comparable across time and securities.
However they have the following limitations (among others):
1. Skewing effect of steep trends
2. Indicator values do not adjust with and reflect true momentum
(indicator values are capped to 100)
(ii) Unbound Oscillators (MACD, RoC, etc)
These are boundless indicators,
and can expand with the market,
without being limited by a 0-100 scaling,
and thus have the advantage of really measuring momentum.
They have the main following limitations (among others):
1. Subjectivity of overbought / oversold levels
2. Not comparable across time
3. Not comparable across securities
=======================================
=======================================
💡 3. THE SOLUTION TO SOLVE THESE LIMITATIONS
=======================================
In order to deal with these limitations,
I decided to create an indicator,
that would be the "Best of two worlds".
A unique & hybrid indicator,
that would have objective normalised readings
(similar to Range Bound Oscillators - RSI)
but would also be able to have no upper/lower boundaries
(similar to Unbound Oscillators - MACD).
This would be achieved by "normalising" a boundless oscillator (MACD)
=======================================
==================================================
⛔ 4. DEEP DIVE INTO THE 5 LIMITATIONS OF THE MACD
==================================================
A Bloomberg study found that the MACD
is the most popular indicator after the RSI,
but the MACD has 5 BIG limitations.
Limitation 1: MACD values are not comparable across Time
The raw MACD values shift
as the underlying security's absolute value changes across time,
making historical comparisons obsolete
e.g S&P 500 maximum MACD was 1.56 in 1957-1971,
but reached 86.31 in 2019-2021 - not indicating 55x stronger momentum,
but simply different price levels.
Limitation 2: MACD values are not comparable across Assets
Traditional MACD cannot compare momentum between different assets.
S&P 500 MACD of 65 versus EUR/USD MACD of -0.5
reflects absolute price differences, not momentum differences
Limitation 3: MACD values cannot be Systematically Classified
Due to limitations #1 & #2, it is not possible to create
a momentum level classification scale
where one can define "fast", "slow", "overbought", "oversold" momentum
making systematic analysis impossible
Limitation 4: MACD Signal Line gives false crossovers in low-momentum ranges
In range-bound, low momentum environments,
most of the MACD signal line crossovers are false (noise)
Since there is no objective momentum classification system (limitation #3),
it is not possible to filter these signals out,
by avoiding them when momentum is low
Limitation 5: MACD Signal Line gives late crossovers in high momentum regimes.
Signal lag in strong trends not good at timing the turning point
— In high-momentum moves, MACD crossovers may come late.
Since there is no objective momentum classification system (limitation #3),
it is not possible to filter these signals out,
by avoiding them when momentum is high
===================================================================
===================================================================
🏆 5. MACD-v : THE SOLUTION TO THE LIMITATIONS OF THE MACD , RSI, etc
====================================================================
MACD-v is a volatility normalised momentum indicator.
It remedies these 5 limitations of the classic MACD,
while creating a tool with unique properties.
Formula: × 100
MACD-V enhances the classic MACD by normalizing for volatility,
transforming price-dependent readings into standardized momentum values.
This resolves key limitations of traditional MACD and adds significant analytical power.
Core Advantages of MACD-V
Advantage 1: Time-Based Stability
MACD-V values are consistent and comparable over time.
A reading of 100 has the same meaning today as it did in the past
(unlike traditional MACD which is influenced by changes in price and volatility over time)
Advantage 2: Cross-Market Comparability
MACD-V provides universal scaling.
Readings (e.g., ±50) apply consistently across all asset classes—stocks,
bonds, commodities, or currencies,
allowing traders to compare momentum across markets reliably.
Advantage 3: Objective Momentum Classification
MACD-V includes a defined 5-range momentum lifecycle
with standardized thresholds (e.g., -150 to +150).
This offers an objective framework for analyzing market conditions
and supports integration with broader models.
Advantage 4: False Signal Reduction in Low-Momentum Regimes
MACD-V introduces a "neutral zone" (typically -50 to +50)
to filter out these low-probability signals.
Advantage 5: Improved Signal Timing in High-Momentum Regimes
MACD-V identifies extremely strong trends,
allowing for more precise entry and exit points.
Advantage 6: Trend-Adaptive Scaling
Unlike bounded oscillators like RSI or Stochastic,
MACD-V dynamically expands with trend strength,
providing clearer momentum insights without artificial limits.
Advantage 7: Enhanced Divergence Detection
MACD-V offers more reliable divergence signals
by avoiding distortion at extreme levels,
a common flaw in bounded indicators (RSI, etc)
====================================================================
=======================================
⚒️ 5. HOW TO USE THE MACD-v: 7 CORE PATTERNS
HOW TO USE THE MACD-v Histogram: 2 CORE PATTERNS
=======================================
>>>>>> BASIC USE (RANGE RULES) <<<<<<
The MACD-v has 7 Core Patterns (Ranges) :
1. Risk Range (Overbought)
Condition: MACD-V > Signal Line and MACD-V > +150
Interpretation: Extremely strong bullish momentum—potential exhaustion or reversal zone.
2. Retracing
Condition: MACD-V < Signal Line and MACD-V > -50
Interpretation: Mild pullback within a bullish trend.
3. Rundown
Condition: MACD-V < Signal Line and -50 > MACD-V > -150
Interpretation: Momentum is weakening—bearish pressure building.
4. Risk Range (Oversold)
Condition: MACD-V < Signal Line and MACD-V < -150
Interpretation: Extreme bearish momentum—potential for reversal or capitulation.
5. Rebounding
Condition: MACD-V > Signal Line and MACD-V > -150
Interpretation: Bullish recovery from oversold or weak conditions.
6. Rallying
Condition: MACD-V > Signal Line and MACD-V > +50
Interpretation: Strengthening bullish trend—momentum accelerating.
7. Ranging (Neutral Zone)
Condition: MACD-V remains between -50 and +50 for 20+ bars
Interpretation: Sideways market—low conviction and momentum.
The MACD-v Histogram has 2 Core Patterns (Ranges) :
1. Risk (Overbought)
Condition: Histogram > +40
Interpretation: Short-term bullish momentum is stretched—possible overextension or reversal risk.
2. Risk (Oversold)
Condition: Histogram < -40
Interpretation: Short-term bearish momentum is stretched—potential for rebound or reversal.
=======================================
=======================================
📈 6. ADVANCED PATTERNS WITH MACD-v
=======================================
Thanks to its volatility normalization,
the MACD-V framework enables the development
of a wide range of advanced pattern recognition setups,
trading signals, and strategic models.
These patterns go beyond basic crossovers,
offering deeper insight into momentum structure,
regime shifts, and high-probability trade setups.
These are not part of this script
=======================================
===========================================================
⚙️ 7. FUNCTIONALITY - HOW TO ADD THE INDICATORS TO YOUR CHART
===========================================================
The script allows you to see :
1. MACD-v
The indicator with the ranges (150,50,0,-50,-150)
and colour coded according to its 7 basic patterns
2. MACD-v Histogram
The indicator The indicator with the ranges (40,0,-40)
and colour coded according to its 2 basic ranges / patterns
3. MACD-v Heatmap
You can see the MACD-v in a Multiple Timeframe basis,
using a colour-coded Heatmap
Note that lowest timeframe in the heatmap must be the one on the chart
i.e. if you see the daily chart, then the Heatmap will be Daily, Weekly, Monthly
4. MACD-v Dashboard
You can see the MACD-v for 7 markets,
in a multiple timeframe basis
=======================================
=======================================
🤝 CONTRIBUTIONS 🤝
=======================================
I would like to thank the following people:
1. Mike Christensen for coding the indicator
@TradersPostInc, @Mik3Christ3ns3n,
2. @Indicator-Jones For allowing me to use his Scanner
3. @Daveatt For allowing me to use his heatmap
=======================================
=======================================
⚠️ LEGAL - Usage and Attribution Notice ⚠️
=======================================
Use of this Script is permitted
for personal or non-commercial purposes,
including implementation by coders and TradingView users.
However, any form of paid redistribution,
resale, or commercial exploitation is strictly prohibited.
Proper attribution to the original author is expected and appreciated,
in order to acknowledge the source
and maintain the integrity of the original work.
Failure to comply with these terms,
or to take corrective action within 48 hours of notification,
will result in a formal report to TradingView’s moderation team,
and will actively pursue account suspension and removal of the infringing script(s).
Continued violations may result in further legal action, as deemed necessary.
=======================================
=======================================
⚠️ DISCLAIMER ⚠️
=======================================
This indicator is For Educational Purposes Only (F.E.P.O.).
I am just Teaching by Example (T.B.E.)
It does not constitute investment advice.
There are no guarantees in trading - except one.
You will have losses in trading.
I can guarantee you that with 100% certainty.
The author is not responsible for any financial losses
or trading decisions made based on this indicator. 🙏
Always perform your own analysis and use proper risk management. 🛡️
=======================================

MACD Forecast [Titans_Invest]MACD Forecast — The Future of MACD in Trading
The MACD has always been one of the most powerful tools in technical analysis.
But what if you could see where it’s going, instead of just reacting to what has already happened?
Introducing MACD Forecast — the natural evolution of the MACD Full , now taken to the next level. It’s the world’s first MACD designed not only to analyze the present but also to predict the future behavior of momentum.
By combining the classic MACD structure with projections powered by Linear Regression, this indicator gives traders an anticipatory, predictive view, redefining what’s possible in technical analysis.
Forget lagging indicators.
This is the smartest, most advanced, and most accurate MACD ever created.
🍟 WHY MACD FORECAST IS REVOLUTIONARY
Unlike the traditional MACD, which only reflects current and past price dynamics, the MACD Forecast uses regression-based projection models to anticipate where the MACD line, signal line, and histogram are heading.
This means traders can:
• See MACD crossovers before they happen.
• Spot trend reversals earlier than most.
• Gain an unprecedented timing advantage in both discretionary and automated trading.
In other words: this indicator lets you trade ahead of time.
🔮 FORECAST ENGINE — POWERED BY LINEAR REGRESSION
At its core, the MACD Forecast integrates Linear Regression (ta.linreg) to project the MACD’s future behavior with exceptional accuracy.
Projection Modes:
• Flat Projection: Assumes trend continuity at the current level.
• LinReg Projection: Applies linear regression across N periods to mathematically forecast momentum shifts.
This dual system offers both a conservative and adaptive view of market direction.
📐 ACCURACY WITH FULL CUSTOMIZATION
Just like the MACD Full, this new version comes with 20 customizable buy-entry conditions and 20 sell-entry conditions — now enhanced with forecast-based rules that anticipate crossovers and trend reversals.
You’re not just reacting — you’re strategizing ahead of time.
⯁ HOW TO USE MACD FORECAST❓
The MACD Forecast is built on the same foundation as the classic MACD, but with predictive capabilities.
Step 1 — Spot Predicted Crossovers:
Watch for forecasted bullish or bearish crossovers. These signals anticipate when the MACD line will cross the signal line in the future, letting you prepare trades before the move.
Step 2 — Confirm with Histogram Projection:
Use the projected histogram to validate momentum direction. A rising histogram signals strengthening bullish momentum, while a falling projection points to weakening or bearish conditions.
Step 3 — Combine with Multi-Timeframe Analysis:
Use forecasts across multiple timeframes to confirm signal strength (e.g., a 1h forecast aligned with a 4h forecast).
Step 4 — Set Entry Conditions & Automation:
Customize your buy/sell rules with the 20 forecast-based conditions and enable automation for bots or alerts.
Step 5 — Trade Ahead of the Market:
By preparing for future momentum shifts instead of reacting to the past, you’ll always stay one step ahead of lagging traders.
🤖 BUILT FOR AUTOMATION AND BOTS 🤖
Whether for manual trading, quantitative strategies, or advanced algorithms, the MACD Forecast was designed to integrate seamlessly with automated systems.
With predictive logic at its core, your strategies can finally react to what’s coming, not just what already happened.
🥇 WHY THIS INDICATOR IS UNIQUE 🥇
• World’s first MACD with Linear Regression Forecasting
• Predictive Crossovers (before they appear on the chart)
• Maximum flexibility with Long & Short combinations — 20+ fully configurable conditions for tailor-made strategies
• Fully automatable for quantitative systems and advanced bots
This isn’t just an update.
It’s the final evolution of the MACD.
______________________________________________________
🔹 CONDITIONS TO BUY 📈
______________________________________________________
• Signal Validity: The signal will remain valid for X bars .
• Signal Sequence: Configurable as AND or OR .
🔹 MACD > Signal Smoothing
🔹 MACD < Signal Smoothing
🔹 Histogram > 0
🔹 Histogram < 0
🔹 Histogram Positive
🔹 Histogram Negative
🔹 MACD > 0
🔹 MACD < 0
🔹 Signal > 0
🔹 Signal < 0
🔹 MACD > Histogram
🔹 MACD < Histogram
🔹 Signal > Histogram
🔹 Signal < Histogram
🔹 MACD (Crossover) Signal
🔹 MACD (Crossunder) Signal
🔹 MACD (Crossover) 0
🔹 MACD (Crossunder) 0
🔹 Signal (Crossover) 0
🔹 Signal (Crossunder) 0
🔮 MACD (Crossover) Signal Forecast
🔮 MACD (Crossunder) Signal Forecast
______________________________________________________
______________________________________________________
🔸 CONDITIONS TO SELL 📉
______________________________________________________
• Signal Validity: The signal will remain valid for X bars .
• Signal Sequence: Configurable as AND or OR .
🔸 MACD > Signal Smoothing
🔸 MACD < Signal Smoothing
🔸 Histogram > 0
🔸 Histogram < 0
🔸 Histogram Positive
🔸 Histogram Negative
🔸 MACD > 0
🔸 MACD < 0
🔸 Signal > 0
🔸 Signal < 0
🔸 MACD > Histogram
🔸 MACD < Histogram
🔸 Signal > Histogram
🔸 Signal < Histogram
🔸 MACD (Crossover) Signal
🔸 MACD (Crossunder) Signal
🔸 MACD (Crossover) 0
🔸 MACD (Crossunder) 0
🔸 Signal (Crossover) 0
🔸 Signal (Crossunder) 0
🔮 MACD (Crossover) Signal Forecast
🔮 MACD (Crossunder) Signal Forecast
______________________________________________________
______________________________________________________
🔮 Linear Regression Function 🔮
______________________________________________________
• Our indicator includes MACD forecasts powered by linear regression.
Forecast Types:
• Flat: Assumes prices will stay the same.
• Linreg: Makes a 'Linear Regression' forecast for n periods.
Technical Information:
• Function: ta.linreg()
Parameters:
• source: Source price series.
• length: Number of bars (period).
• offset : Offset.
• return: Linear regression curve.
______________________________________________________
______________________________________________________
⯁ UNIQUE FEATURES
______________________________________________________
Linear Regression: (Forecast)
Signal Validity: The signal will remain valid for X bars
Signal Sequence: Configurable as AND/OR
Table of Conditions: BUY/SELL
Conditions Label: BUY/SELL
Plot Labels in the graph above: BUY/SELL
Automate & Monitor Signals/Alerts: BUY/SELL
Linear Regression (Forecast)
Signal Validity: The signal will remain valid for X bars
Signal Sequence: Configurable as AND/OR
Table of Conditions: BUY/SELL
Conditions Label: BUY/SELL
Plot Labels in the graph above: BUY/SELL
Automate & Monitor Signals/Alerts: BUY/SELL
______________________________________________________
📜 SCRIPT : MACD Forecast
🎴 Art by : @Titans_Invest & @DiFlip
👨💻 Dev by : @Titans_Invest & @DiFlip
🎑 Titans Invest — The Wizards Without Gloves 🧤
✨ Enjoy!
______________________________________________________
o Mission 🗺
• Inspire Traders to manifest Magic in the Market.
o Vision 𐓏
• To elevate collective Energy 𐓷𐓏
🎗️ In memory of João Guilherme — your light will live on forever.

RedK K-MACD : a MACD with some more musclesMoving Averages are probably the most commonly used analysis tools, and MACD is possibly the first charting indicator a trader gets to learn about.
MACD Basic concept
----------------------------
Without repeating all the tons of documentation about what MACD does, let's quickly re-visit the MACD concept from a 10-mile altitude (note we're keen on simplifying here rather than being technically accurate - so please forgive the use of any "common lingos")
- MACD goal is to represent the distance between 2 Moving Averages (MAs) - one fast and one slow, relatively - as an unrestricted zero-based oscillator.
- The value of the main MACD line is the distance, or the displacement between the 2 MA's
- usually a signal line is used (which is another MA of that distance value) to enable better visualization of the change (and rate of change, since this is all depicted on a time axis) of that displacement - this represents price momentum (price movement in the recent period versus movements for a relatively longer period).
- the difference between the main MACD line and its signal is then represented as a histogram above and below the zero line. in this case, that histogram is really redundant, since it shows a value that is already represented visually by the main line and its signal line.
How K-MACD is different
---------------------------------
K-MACD takes that simple concept of the classic MACD and expands around it - the idea is to use the same simple approach to representing price momentum while bringing in more insight to price moves in the short, medium and long terms, ability to represent more than 2 MA's and to enable better identification of tradeable patterns (like Volatility Contraction and others) - while still keeping things simple and visually clean.
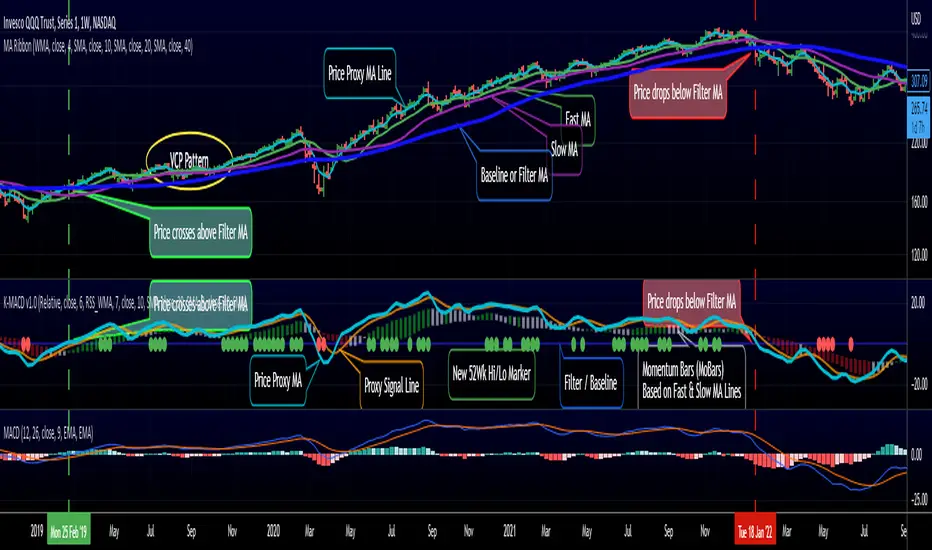
K-MACD is an indicator that allows us to view how price moves against 3 moving averages: a fast / slow pair, and a "market" Filter or Baseline (very long) that will be used as a flag for Bear/Bull market mode. Many traders and trading literature use the 200 day (40 week) SMA as that key filter
so in total, there are 4 MA lines in K-MACD (excluding the "orange" signal line):
* Price Proxy: Which is a very fast moving average that will represent the price itself - let's use a WMA(3) or something close to that here - there will be a signal line to enable better visualization of this similar to a classic MACD - that's the orange line
* Fast & Slow MA's : Use whatever represents the "medium term" momentum for your trading - Some traders use 20 and 50, others use 10 and 20 .. if on your price chart, you keep using a pair of MA's for this, use the same settings in K-MACD - these will be represented by the 3-color Momentum Bars that fluctuate above and below the baseline
* Filter/Baseline MA: Should be your long (Bullish/Bearish Mode) MA. so 100 or 200 or any other value you consider your market to be bearish below and bullish above. on K-MACD this is actually the blue zero line - everything else is "relative" to it
Review the sample chart which explains various elements and the "price chart" setup that K-MACD represents. With K-MACD you can clean up your chart from those various Moving Averages - or use a different set than the ones you already have K-MACD represent - or other indicators (like ATR channels..etc)
Other "muscles" in the K-MACD
---------------------------------------------
- Relative vs Classic Calculation Mode
A key issue with the classic MACD is that the displacement between the 2 moving averages is represented as "absolute or direct" values - as the price of the underlying increases with time, you can't really use these values to make useful comparison between the past and now (see below example) - also you can't use them to compare 2 different instruments.
- The "Relative" calculation option in K-MACD addresses that issue by relating all "distances" to the Baseline MA as percentage (above or below) - you can see this clear when you look at the above chart the far left versus the far right and compare K-MACD with the classic MACD - the Classic option is still available
- More MA "type" options for all MA lines: choose between SMA, EMA, WMA, and RSS_WMA (which i use a lot in my trading and is my default for the Price Proxy)
- More Alerts: a total or 9 alerts (in 3 groups) are available with K-MACD (Momentum above or below baseline, Price Proxy crossing signal line, and Price Proxy crossing baseline)
- New 52 week High / Low markers: These will show as Green/red circles on the zero line in K-MACD. this will only work for 1D timeframe and above, i'm just using a simple approach and would like to keep it that way.
- i know i added some more features not covered above :) -- if you have questions about any of the settings, feel free to ask below
Closing thoughts
-------------------------
K-MACD is a combination of couple of indicators i published in the past (xMACD and Mo_Bars) - so you can go back and read about them if needed - I then added improvements to accommodate ideas from swing trading literature and common practices that i plan to focus on in future. So K-MACD is really part of my own trading setup.
I assume here that most traders are familiar with what a MACD is - so kept this post short - if you thing we should expand more about the concepts covered here let me know in the comments - i can make some separate posts with examples and more details.
I hope many fellow traders find this work useful - and feel free let me know in comments below if you do.
[Sidders] MACDEMASAR IndicatorCame across a cool idea for a strategy that couldn't find in the indicator database, so decided to code it up myself for your pleasure.
Indicators consists of 3 indicators: EMA(200) to determine the overall trend, and the MACD & Parabolic SAR to determine entries (and exits).
Long entry contains 4 conditions and is generated when price is above the 200EMA (1), the MACD crosses above the signal line (2), while they are both below 0 line (3) and when the parabolic SAR is below the closing price of the bar (4).
Short entry is build up the same but in reverse: price is below the 200EMA(1), signal line crosses below the MACD line (2), while they are both above the 0 line (3) and when the parabolic SAR is above the closing price of the bar (4).
Place the stoploss on the parabolic SAR dot below/above the candle that created the signal. Profit target 1:1 risk:reward ratio, but can ofcourse be changed according to your risk apetite. Might add automatically drawn SL/TPs in a later update.
Concept behind the strategy should work on all timeframes, but will require proper backtesting. I think with additional filters the strategy can also be way more finetuned and profitable, personally haven't had the time yet to dive into that.
Have also added alerts for your convenience.
Enjoy!

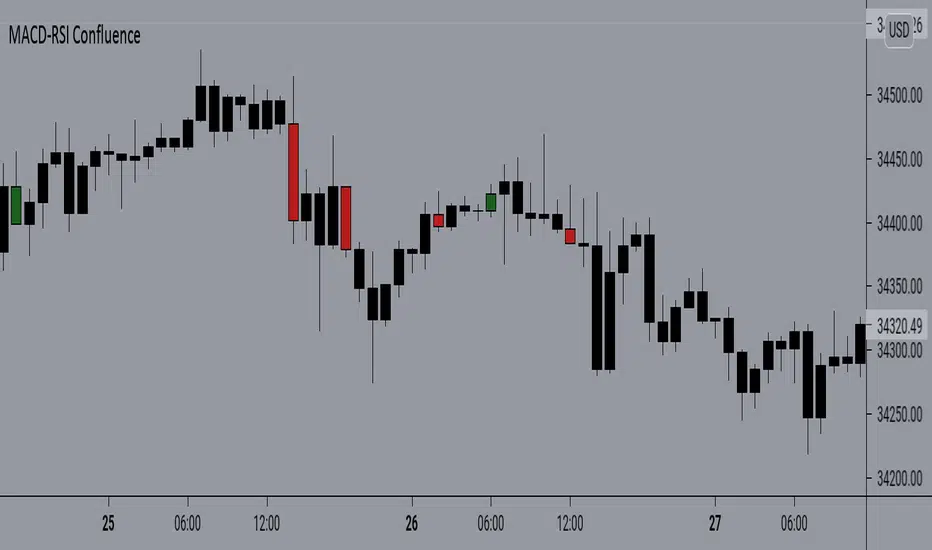
MACD-RSI Confluence SimplifiedAnother simple version of the MACD RSi Confluence script. But this is one is more simplified with simple signals. Again to fully understand macd & RSI you should already have some type of knowledge of how they work. With understanding this script & it's signals are great for those who do. This script is based on Barcolor signals reflected by macd & RSI data
Double Exponential MACDA modification of the classic MACD to use Double EMAs which tends to have less lag than the standard indicator.
Alert conditions are pre-configured for simple line crosses and you can enable/disable the histogram from the indicator options menu.
Enjoy!

[SCL] MACD DoubleCrossCounts crosses of the MACD and signal lines and derives entry signals. The code for counting the crosses, for deciding what counts as "close enough", and for auto-adjusting for resolutions 1D or longer, might be useful for Pinescripters. The entries and exits themselves are not intended to be used on their own, but could be used as confluence within a trading system. Full explanation is in the script introduction.
EVWMA VWAP MACD Strategy [QuantNomad]Based on comment of @coondawg71 I tried to compare VWAP and EVWMA.
Both are sort of moving averages so I decided to create a MACD based on these 2 indicators.
In parameters you can set EVWMA Length and 2 smoothing lengths for "macd" and "signal".
Strategy seems to work pretty good at 2h-8h timeframes for crypto.
What do you thing about it?

Zero Lag MACD [ChuckBanger]This is an MACD indicator with the ability to use zeror lag moving average instead of exponential moving average. I also added different background color when histogram is over or under center line, MACD Leader, Laguerre filter and dots to indicate when Leader line crosses macd line. Good luck traders!
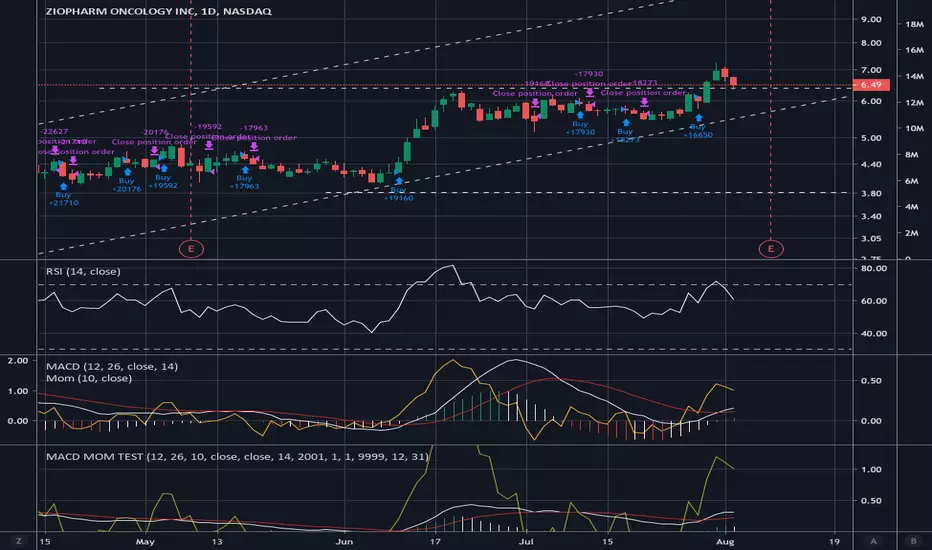
MACD MOMENTUM STRATEGYHey,
First of I'm not so familiar with Pine Editor, yet.
But a do need some help with a trick thing I*ve been working on.
As you can see I*ve merge the MACD and the MOMENTUM indicators in the same "chart" this have been working pretty well for me as a trading strategy. But now a chat tho create a real strategy with Pine Editor based on the same data. The thing is that I can't seem tho get the MOMENTUM indicator to and the MACD indicator in the same (different) scale in my strategy as when I merge them.
I suspect this got something to do with my chose of source för the MOMENTUM indicator, but I'm not 100.
I would be grateful for all kinds of feedback and tips for a solutions on this.
Thanks.
VW-MACDHello traders!
I am reading "Investing with Volume Analysis: Identify, Follow, and Profit from Trends" by Buff Pelz Dormeier so I am going to implement all indicators that are considered there.
VW-MACD was developed by Buff Pelz Dormeier in 2000 and is based on the difference between a short-term volume-weighted moving average and a long-term volume-weighted moving average. The signal line is traditionally left as an exponential moving average.
Like and follow for more cool indicators!
Happy Trading!

Multi-Functional Fisher Transform MTF with MACDL TRIGGERWhat this indicator gives you is a true signal when price is exhausted and ready for a fast turnaround. Fisher Transform is set for multi-time frame and also allows the user to change the length. This way a user can compare two or more time spans and lengths to look for these MACDL divergent triggers after a Fisher exhaustion. With so many indicators, it's probably best to merge these indicators and change the Fisher and Trigger colors so you can still have a look at price action (remember to scale right after merger). I've noticed from time to time when you have Fisher 34 100 and 300 up and running on two different time frames such as 5 and 15 min charts, with MACDL triggers on the 100/300 or 34/100 you get a high probability trade trigger. However, there are rare exceptions such as when price moves in a parabolic state up or down for a long period where this indication does not work. Ideally this indicator works best in a sideways market or slow rising/descending moving market.
This indicator was worked on by Glaz, nmike and myself
LazyBear also introduced the MACDL indicator

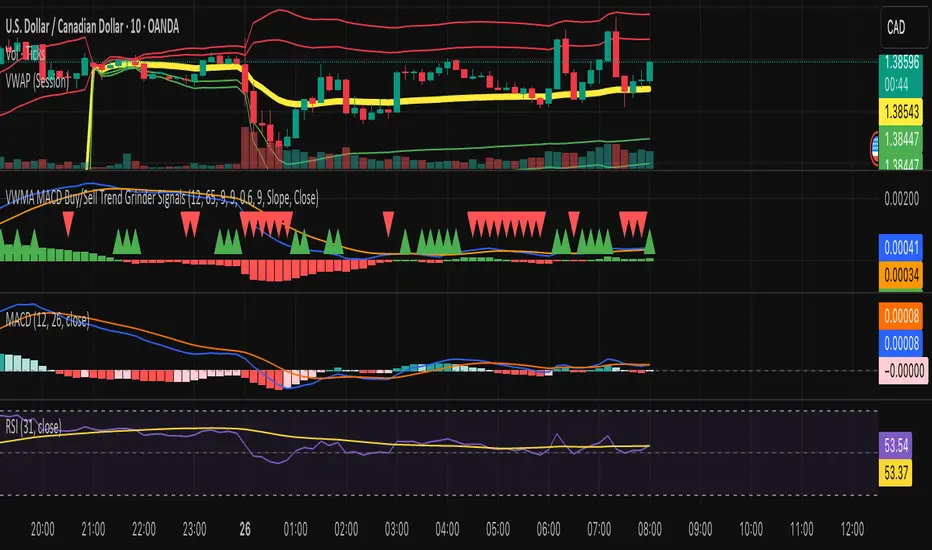
VWMA MACD Trend Grinder Buy/Sell SignalsDescription:
This indicator combines a VWMA-based MACD with volume and trend filters to reduce false buy and sell signals.
It is designed to give more reliable entry and exit points in trending markets while avoiding low-volume noise.
Features:
1. VWMA MACD:
- MACD is calculated using Volume-Weighted Moving Averages (VWMA) instead of standard EMAs.
- Histogram shows the difference between MACD and its signal line.
2. Volume Filter:
- Signals are only triggered when current volume exceeds a multiple of its moving average.
- Reduces false signals in low-volume periods.
3. Trend Filter:
- Only triggers buy signals when price is above a long-term VWMA (uptrend).
- Only triggers sell signals when price is below the long-term VWMA (downtrend).
- Helps avoid counter-trend trades.
4. Plots:
- MACD (blue), Signal (orange), Histogram (green/red)
- Trend VWMA (purple)
- Buy and Sell arrows in the indicator pane (green/red)
5. Alerts:
- Configurable alerts for buy and sell signals filtered by volume and trend.
Inputs:
- Fast Length: VWMA period for the fast MACD line (default 12)
- Slow Length: VWMA period for the slow MACD line (default 26)
- Signal Length: EMA period for the MACD signal line (default 9)
- Volume MA Length: Length for volume moving average filter (default 20)
- Volume Threshold Multiplier: Multiplier for volume filter (default 1.2)
- Trend VWMA Length: Period for long-term trend VWMA (default 50)
- Price Source: Close, HL2, HLC3, OHLC4
Usage:
- Use as a confirmation tool along with other analysis techniques.
- Buy when the green triangle appears (MACD crossover, above trend VWMA, sufficient volume).
- Sell when the red triangle appears (MACD crossunder, below trend VWMA, sufficient volume).
- Trend VWMA helps visually confirm the market trend.
VWMA MACD Amanita Buy/Sell Signals VWMA MACD Amanita Buy/Sell Signals – Volume-Weighted Momentum Indicator
A twist on the classic MACD: this indicator uses Volume Weighted Moving Averages (VWMA) instead of EMAs, giving more weight to price moves backed by higher volume.
Features:
VWMA-based MACD line & signal line
Histogram highlights bullish/bearish momentum
Color-coded for easy visualization
Quick Guide:
MACD above Signal → bullish
MACD below Signal → bearish
Rising histogram → strengthening trend
Falling histogram → weakening trend
Perfect for traders who want momentum confirmed by volume.