Deckchair Trader COT IndexPlots the COT Index from the legacy report data from Quandl. Plots the commercial, non commercial and non reportables. Each plot can be hidden as needed.
I've tried to capture the basic dollar based currencies and the futures such as corn , wheat , rice, oil , hogs etc. The symbols required a little translation to match what Quandl is expecting but I think I got most of them. Please let me know of any issues with these.
Part of a suite of COT related indicators based on the excellent book "the commitment of traders bible" by Stephen Briese.
Currently working on a trading strategy based around these indicators,
Would love to hear if you are interested in this or have some COT trading ideas to share.
Feb 26, 2018
Release Notes: Quandl have changed their codes :( now they seem to be using the CFTC Id's where are numeric (and can be found in the dump you get from them)
So whereas before for example, GBPUSD was mapped to BP it is now mapped to 096742.
I have gone through the various dumps and tried to map all the symbols I was using, the currency were the easy ones, the wheat, corn etc a little harder to trade down due to variations.
Please let me know if different
Thanks
Tim Titchmarsh
DeckchairTrader
Cerca negli script per "米哈游2018年股票价格"

CryptoCoyns HullMA [v2018-12-10]CryptoCoyns Hull Moving Average
This indicator implements the Hull moving average.
The Hull Moving Average (HMA), developed by Alan Hull, is an extremely
fast and smooth moving average. In fact, the HMA almost eliminates lag
altogether and manages to improve smoothing at the same time. A longer
period HMA may be used to identify trend. If the HMA is rising, the
prevailing trend is rising, indicating it may be better to enter long
positions. If the HMA is falling, the prevailing trend is also falling,
indicating it may be better to enter short positions. A shorter period
HMA may be used for entry signals in the direction of the prevailing trend.
The Source for price can be defined. i.e. Close, Open, High, Low, etc.
The period length used can be defined.
MA Line colour is fully configurable.
If you get some value out of this indicator please consider making
a small donation to my favourite charity the Save the Childrens Fund.
Every donation will make a difference to the lives of children.
All donations over $2 are tax deductable. You can donate here:
savethechildrenfundraising.org.au
Copyright (c) 2018, Grant Cause aka CryptoCoyns

CryptoCoyns Cross Indicator [v2018-12-10]CryptoCoyns Cross
I use EMA crosses in a number of trading strategies and I often found myself
putting these onto charts. So to save some time I created this indicator that
allows me to put the most common ones on in one hit.
This indicator implements a series of Exponential Moving Averages to show
where they cross. This indicator works on any chart timeframe.
There is an option to swap over to using SMA rather than EMA for all MA lines.
MA lines can be turned on or off individually.
All colours are fully configurable.
If you get some value out of this indicator please consider making
a small donation to my favourite charity the Save the Childrens Fund.
Every donation will make a difference to the lives of children.
All donations over $2 are tax deductable. You can donate here:
savethechildrenfundraising.org.au
Copyright (c) 2018, Grant Cause aka CryptoCoyns

CryptoCoyns MACDS [v2018-12-10]CryptoCoyns MACDS
This indicator implements a standard Moving Average Convergance / Divergance
that works on any chart timeframe. It shows the strength of the current trend.
MACD Crosses are highlighted with yellow circles to make them more obvious.
Strength is indicated by histogram colours moving from Red (weak) through to Light Green (strong):
Red indicates a strong down trend
Yellow indicates a positive change is coming and moving out of a downtrend.
Green indicates a weakening upward trend moving towards a change to a downward trend.
Light Green indicates a strong upward trend
All colours are fully configurable.
If you get some value out of this indicator please consider making
a small donation to my favourite charity the Save the Children's Fund.
Every donation will make a difference to the lives of children.
All donations over $2 are tax deductible. You can donate here:
savethechildrenfundraising.org.au
Copyright (c) 2018, Grant Cause aka CryptoCoyns

Multiple MACD RSI simple strategySimple strategy script I've had for a while but looks like I never published.
Although it is one of my most simple it seems to have the best profitability. It is pretty rough though. the Stoch RSI has only a little weight to the trade trigger. I'll refine it more over time or you can by all means. Basically the Stoch RSI current K line has to be OVER 40 to trigger a SELL. It has no effect on buy side.
The triggers are roughly as follows:
Year - since so many assets have gone 2x, 3x, 10x+ since 2013 having a strategy that earns a 500% return from 2013 to now isn't that good if buy-and-holding would have got you 800%. This eliminates some of that noise and makes it a little easier to quickly gauge success. So buy/sell trigger need a value of greater or equal to 2018 (default)
MACD 1 - First MACD (short) needs to indicate greater than 0 to buy or less than 0 to sell.
MACD 2 - Same as MACD1 but for second MACD set (long)
Uptrend - Latest close + high divided by last periods close + high needs to be grater than 1. So if latest is 34.30 close and 34.60 high and previous interval is 34.80 close and 34.82 high, that is 0.99 and will not trigger a buy trade.
Downtrend - Same thing but close + low and less than 1.
This script/strategy is pretty rough but if there is interest I'll polish it more since it is a pretty solid but simple strategy for most assets.

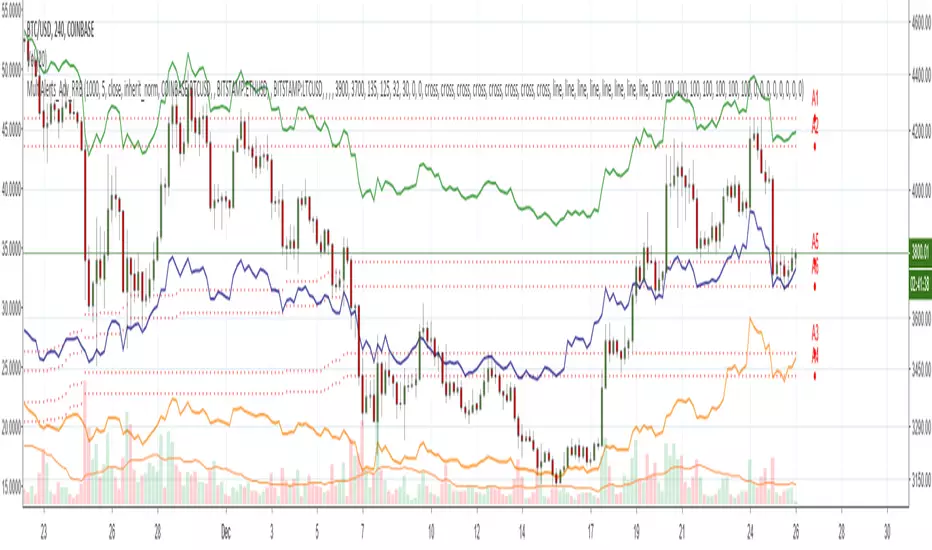
Zindarra Multi Alerts Advanced (8 Symbols, 8 Levels) by RRBZindarra Multi Alerts Advanced by RRB by RagingRocketBull 2018
Version 1.0
This indicator lets you configure multiple alert levels for several assets. Zindarra Multi Alerts Advanced supports 8 symbols with 8 custom alert levels.
You can have an M:M relationship betweeen symbols and levels, for example:
- 4 symbols each boxed by 2 alerts above/below the price
- 3 symbols with 1 alert each
- 2 symbols, 1st with 2 alerts, 2nd - with 6 alerts
- 1 symbol with 8 alerts etc
There are several versions: Simple, Pro, Advanced and Ultimate. This is the Advanced version. The Differences are listed below.
- Simple: 10 Alert Levels, 1 plot mode, alert type: cross, no colors/triggered alerts
- Pro: 9 Alert Levels, 2 plot modes: plot/price line, alert type: cross, +change/swap colors, +hide/disable triggered alerts, 2 penetration modes (close, high/low), trigger on confirmed close
- Advanced: 8 Symbols/Tickers, 8 Alert Levels, +alert types: cross up/cross down, no color change. Display sources as lines/candles, normalize, scale/shift independently
- Ultimate: 5 Symbols/Tickers, 8 Alert Levels, +alert types: volume/price %/abs change, volume/ema/time cross
Features:
- 8 custom symbols, symbols:levels = M:M
- 8 custom alert levels with labels. For each alert there must be a corresponding non-empty symbol (can be a duplicate)
- alert types: cross/cross up/cross down
- normalize symbols (and alert levels) to 100% to compare,
- scale and shift each symbol (and alert levels) to position on a chart independently
- 1 alert levels plot mode: plot
- 2 symbol types: line/candles
- colorize symbol candles
- high/low or close level penetration modes
- show/hide levels/labels
- keep or auto disable triggered alerts
- trigger alerts only after a confirmed close
You will see all symbols on a single chart at the same time with their corresponding alert levels. From this chart you can manage all alerts configured for multiple assets.
Although TradingView has 2 percentage scale modes (Percent, Indexed to 100), somehow they still fail to be usefull when comparing multiple assets.
This indicator lets you normalize all symbols to 100% making a direct single scale comparison between assets with vastly different price levels possible.
All alert levels will be normalized as well.
TradingView does not let you move the plots attached to left scale. When scaled they all remain stuck in the center and can't be moved vertically or relative to each other.
This indicator lets you position all symbols independently using individual scale and shift settings. For example, you can:
- split your screen in 3 horiz areas and have a symbol in each of them without overlapping or
- have several partially overlapping assets with different scale each or
- have all assets fully overlapping and normalized to the same 100% scale
You have to manually create an alert in Manage Alerts Panel and configure it to use with this indicator.
Free accounts are limited to only 1 alert slot and this indicator will take it (any existing alerts must be disabled/stopped).
Once the alert is configured, the indicator can be removed from chart to free a slot for another indicator, but you won't see the alert levels.
Usage:
1. attach indicator to a chart
2. define alert levels in UI settings
3. in TradingView's Manage Alerts panel on the right:
- for free accounts: disable/stop all existing alerts, you are limited to 1 alert slot only. Otherwise you won't be able to save.
- create a new Alert:
- select 'Multi Alerts' indicator name in the Condition dropdown box, leave Level 1 and Multi Alerts Cross as default options
- select 'Once Per Bar' or 'Once Per Minute' instead of 'Only Once' to trigger the alert multiple times
5. click Save. Your 9 alerts are enabled now.
Change Settings:
1. change levels/settings in UI. Any changes will also reset already triggered levels visibility.
2. in Manage Alerts panel:
- open/edit the alert you created
- select new instance of 'Multi Alerts' indicator name in the Condition dropdown box (appears at the bottom)
- check the Condition dropdown again - a single instance should remain selected.
3. click Save. Your alert settings are updated.
Notes on using alerts:
- attaching this indicator to a chart and configuring alert levels will not automatically enable the alerts - you have to manually create/configure a new alert in the Alerts Panel
- removing this indicator from chart will not disable the alerts, you have to manually disable the alert you created in the Alerts Panel
- your alert in the Alerts Panel uses another instance (copy) of indicator/settings. Any changes won't affect the alert. You have to manually update the alert every time you change any settings in the indicator.
- recompiling and attaching your own version of indicator will require creating a new Alert (delete the old one).
- alerts are designed to work in realtime. In replay mode you will see triggered alert levels hiding/changing colors but there will be no system alert messages. It's best to test the indicator in realtime on M1 (1 min) chart
- you will only see 1 system alert per bar/60 sec when multiple alert levels are crossed with a single bar or across several symbols at the same time. However all of these levels will hide in the indicator as expected.
- you can only see the alert levels when the indicator is attached to chart, they are not shown by the system alert.
- For source=high/low a directional level penetration is used automatically (crossunder/low and crossover/high). For source=close a standard bidirectional cross is used unless another alert type is specified.
- normalization breaks/distorts alert levels and symbol price - this is normal and is expected. To view the real price of alert levels uncheck normalize - the first 8 outputs are alert levels. Unnormalized levels are straight lines.
- you will see alerts from all symbols in the system alert message box of the current symbol - a bit confusing, but there's no workaround, you can't have a customized alert message for each symbol/level
- many tickers as arguments can stretch/break TradingView's Create New Alert dialog but it's still possible to push all required buttons and Save.
- duplicate symbols will be displayed by default. You can manually hide duplicates using show/hide flags.
- empty tickers (and corresponding alerts) are essentially disabled
1. uses plot*, cross*, barssince, highest, security, alertcondition
Zindarra Multi Alerts by RRBZindarra Multi Alerts by RRB by RagingRocketBull 2018
Version 1.0
This indicator lets you configure multiple alert levels for an asset. Zindarra Multi Alerts supports 10 custom alert levels.
You have to manually create an alert in Manage Alerts Panel and configure it to use with this indicator.
Free accounts are limited to only 1 alert slot and this indicator will take it (any existing alerts must be disabled/stopped).
Once the alert is configured, the indicator can be removed from chart to free a slot for another indicator, but you won't see the alert levels.
This is the Zindarra Multi Alerts Simple version. You can't auto disable already triggered alerts in this indicator. All alerts will remain active.
If you want to be able to hide/disable/change color of the triggered alert levels use the Zindarra Multi Alerts Pro version.
Features:
- 10 custom alert levels with labels
- set open/high/low/close source point for level penetration
- show/hide levels/labels
Usage:
1. attach indicator to a chart
2. define alert levels in UI settings
3. in TradingView's Manage Alerts panel on the right:
- for free accounts: disable/stop all existing alerts, you are limited to 1 alert slot only. Otherwise you won't be able to save.
- create a new Alert:
- select 'Multi Alerts' indicator name in the Condition dropdown box, leave Level 1 and Multi Alerts Cross as default options
- select 'Once Per Bar' or 'Once Per Minute' instead of 'Only Once' to trigger the alert multiple times
5. click Save. Your 9 alerts are enabled now.
Change Settings:
1. change levels/settings in UI
2. in Manage Alerts panel:
- open/edit the alert you created
- select new instance of 'Multi Alerts' indicator name in the Condition dropdown box (appears at the bottom)
- check the Condition dropdown again - a single instance should remain selected.
3. click Save. Your alert settings are updated.
Notes on using alerts:
- attaching this indicator to a chart and configuring alert levels will not automatically enable the alerts - you have to manually create/configure a new alert in the Alerts Panel
- removing this indicator from chart will not disable the alerts, you have to manually disable the alert you created in the Alerts Panel
- your alert in the Alerts Panel uses another instance (copy) of indicator/settings. Any changes won't affect the alert. You have to manually update the alert every time you change any settings in the indicator.
- recompiling and attaching your own version of indicator will require creating a new Alert (delete the old one).
- alerts are designed to work in realtime. In replay mode you will see only the alert levels but there will be no system alert messages. It's best to test the indicator in realtime on M1 (1 min) chart
- you will only see 1 system alert per bar/60 sec when multiple alert levels are crossed with a single bar.
- you can only see the alert levels when the indicator is attached to chart, they are not shown by the system alert.
- a standard bidirectional cross is used for all penetration sources
1. uses plot*, cross*, alertcondition
Zindarra Multi Alerts Pro (9 Levels) by RRBZindarra Multi Alerts Pro by RRB by RagingRocketBull 2018
Version 1.0
This indicator lets you configure multiple alert levels for an asset. Zindarra Multi Alerts Pro supports 9 custom alert levels.
You have to manually create an alert in Manage Alerts Panel and configure it to use with this indicator.
Free accounts are limited to only 1 alert slot and this indicator will take it (any existing alerts must be disabled/stopped).
Once the alert is configured, the indicator can be removed from chart to free a slot for another indicator, but you won't see the alert levels.
If you want 10 alert levels and don't need colors and Pro features - use Multi Alerts Simple version instead.
Features:
- 9 custom alert levels with labels
- 2 plot modes: plot and price line
- high/low or close level penetration modes
- show/hide levels/labels
- change color based on level position above/below price
- keep or auto disable triggered alerts
- trigger alerts only after a confirmed close
- swap level colors
Usage:
1. attach indicator to a chart
2. define alert levels in UI settings
3. in TradingView's Manage Alerts panel on the right:
- for free accounts: disable/stop all existing alerts, you are limited to 1 alert slot only. Otherwise you won't be able to save.
- create a new Alert:
- select 'Multi Alerts' indicator name in the Condition dropdown box, leave Level 1 and Multi Alerts Cross as default options
- select 'Once Per Bar' or 'Once Per Minute' instead of 'Only Once' to trigger the alert multiple times
5. click Save. Your 9 alerts are enabled now.
Change Settings:
1. change levels/settings in UI. Any changes will also reset already triggered level colors/visibility.
2. in Manage Alerts panel:
- open/edit the alert you created
- select new instance of 'Multi Alerts' indicator name in the Condition dropdown box (appears at the bottom)
- check the Condition dropdown again - a single instance should remain selected.
3. click Save. Your alert settings are updated.
Notes on using alerts:
- attaching this indicator to a chart and configuring alert levels will not automatically enable the alerts - you have to manually create/configure a new alert in the Alerts Panel
- removing this indicator from chart will not disable the alerts, you have to manually disable the alert you created in the Alerts Panel
- your alert in the Alerts Panel uses another instance (copy) of indicator/settings. Any changes won't affect the alert. You have to manually update the alert every time you change any settings in the indicator.
- recompiling and attaching your own version of indicator will require creating a new Alert (delete the old one).
- alerts are designed to work in realtime. In replay mode you will see triggered alert levels hiding/changing colors but there will be no system alert messages. It's best to test the indicator in realtime on M1 (1 min) chart
- you will only see 1 system alert per bar/60 sec when multiple alert levels are crossed with a single bar. However all of these levels will hide/change color in the indicator as expected.
- plot modes: price line - changes color of the whole level, style is not configurable; plot - changes color of a level's segment after each cross, configurable style
- you can only see the alert levels when the indicator is attached to chart, they are not shown by the system alert.
- For source=high/low a directional level penetration is used automatically (crossunder/low and crossover/high). For source=close a standard bidirectional cross is used. Colors always change above/below close.
1. uses plot*, cross*, alertcondition

SadLittleThings Price Compare With Offset MTF by RRBSadLittleThings Price Compare With Offset MTF by RagingRocketBull 2018
Version 1.0
This indicator lets you compare multiple assets across different timeframes, supports offsets and alpha multipliers.
Standard TradingView Compare doesn't have Offset/Timeframe/Multiplier options, hence this indicator.
Features:
- compare current asset's price with 2 custom ext OHLC sources
- plot sources as lines/bars/candles
- use offset:
- for lines - both positive/negative offsets, unlimited
- for bars/candles - only positive offsets <= 5000
- specify timeframe for each source
- uses timeframe textbox instead of input resolution dropdown to allow for 240 120 and other custom TFs
- support for timeframes in H: H, 2H, 4H etc
- show/hide sources
- colorize sources
- convert source price to 1000s, mlns, or blns using alpha multiplier
- total bars counter
Notes on using offsets:
- Max offset is defined by study max_bars_back which is limited to 5000 for free accounts. This variable specifies the number of history bars an indicator can access.
- if you see the 'internal server study error' => one of the indexes of ohlc series is out of bounds (i.e. close ) => decrease the offset <= 5000 or switch to line type
- you will be limited only by the total number of bars in history (n) +/- 1 full screen of empty bars
- you can't scroll past the beginning of history - 1 empty screen and past the end of history + 1 empty screen to be able to still see the line with applied offset
- before applying a large offset, scroll back long enough to make sure you have enough history loaded
- if you have a long history the indicator will get slower, its UI less responsive. Reloading the page may fix that.
- you will not see source's history past the beginning of the current asset - open the chart with the longest history first (i.e. BLX, not COINBASE)
- Make sure that the Left Price Scale shows up with Auto Fit Data enabled. You can reattach the indicator to a different scale in Style.
- you may not be able to plot intraday TFs < current TF, because free accounts are limited to TFs >= D1 (i.e. D, 2D, 3D, W), but you can still plot, say, H4+ on a lower TF H1 chart
1. uses plot*, security, change

Weekly & Daily Percantage Price OscillatorMy first script.
By Vitali Apirine. Technical Analysis of Stocks & Commodities ( February 2018, Vol.36 Issue 2). Thank you.

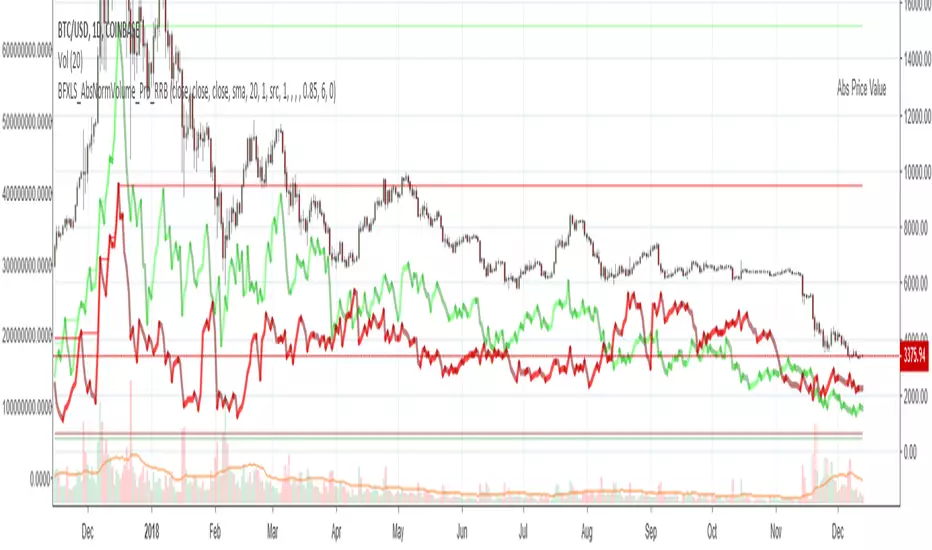
Chiki-Poki BFXLS Longs Shorts Abs Normalized Volume Pro by RRBChiki-Poki BFXLS Longs vs Shorts Absolute Normalized Volume Value Pro by RagingRocketBull 2018
Version 1.0
This indicator displays Longs vs Shorts in a side by side graph, shows volume's absolute price value and normalized volume of Longs/Shorts for the current asset. This allows for more accurate L/S comparisons (like a log scale for volume) since volume on spot exchanges (Bitstamp, Bitfinex, Coinbase etc) is measured in coins traded, not USD traded. Similarly, L/S is usually the amount of coins in open L/S positions, not their total USD value. On Bitmex and other futures exchanges volume is measured in USD traded, so you don't need to apply the Volume Absolute Price Value checkbox to compare L/S. You should always check first whether your source is measured in coins or USD.
Chiki-Poki BFXLS primarily uses *SHORTS/LONGS feeds from Bitfinex for the current crypto asset, but you can specify custom L/S source tickers instead.
This 2-in-1 works both in the Main Chart and in the indicator pane below. You can switch between Main/Sub Window panes using RMB on the indicator's name and selecting Move To/Pane Above/Below.
This indicator doesn't use volume of the current asset. It uses L/S ticker's OHLC as a source for SHORTS/LONGS volumes instead. Essentially L/S => L/S Volume == L/S
Features:
- Display Longs vs Shorts side by side graph for the current crypto asset, i.e. for BTCUSD - BTCUSDLONGS/BTCUSDSHORTS, for ETHUSD - ETHUSDLONGS/ETHUSDSHORTS etc.
- Use custom OHLC ticker sources for Longs/Shorts from different exchanges/crypto assets with/without exchange prefix.
- Plot Longs/Shorts as lines or candles
- Show/Hide L/S, Diff, MAs, ATH/ATL
- Use Longs/Shorts Volume Absolute Price Value (Price * L/S Volume) instead of Coins Traded in open L/S positions to compare total L/S value/capitalization
- Normalize L/S Volume using Price / Price MA / L/S Volume MA
- Supports any existing type of MA: SMA, EMA, WMA, HMA etc
- Volume Absolute Price Value / Normalize also works on candles
- Oscillator mode with negative axis (works in both Main Chart/Subwindow panes).
- Highlight L/S Volume spikes above L/S MAs in both lines/oscillator.
- Change L/S MA color based on a number of last rising/falling L/S bars, colorize candles
- Display L/S volume as 1000s, mlns, or blns using alpha multiplier
1. based on BFXLS Longs vs Shorts and Compare Style, uses plot*, security and custom hma functions
2. swma has a fixed length = 4, alma and linreg have additional offset and smoothing params
Notes:
- Make sure that Left Price Scale shows up with Auto Fit Data enabled. You can reattach indicator to a different scale in Style.
- It is not recommended to switch modes multiple times due to TradingView's scale reattachment bugs. You should switch between Main Chart and Sub Window only once.
- When the USD price of an asset is lower you can trade more coins but capitalization value won't be as significant as when there are less coins for a higher price. Same goes for Shorts/Longs.
Current ATH in shorts doesn't trigger a squeeze because its total value is now far less than before and we are in a bear market where it's normal to have a higher number of shorts.
- You should always subtract Hedged L/S from L/S because hedged positions are temporary - used to preserve the value of the main position in the opposite direction and should be disregarded as such.
- Low margin rates increase the probability of a move in an underlying direction because it is cheaper. High margin rates => the market is anticipating a move in this direction, thus a more expensive rate. Sudden 5-10x rate raises imply a possible reversal soon. high - 0.1%, avg - 0.01-0.02%, low - 0.001-0.005%
You can also check out:
- BFXLS Longs/Shorts on BFXData
- Bitfinex L/S margin rates and Hedged L/S on datamish
- Bitmex L/S on Coinfarm.online
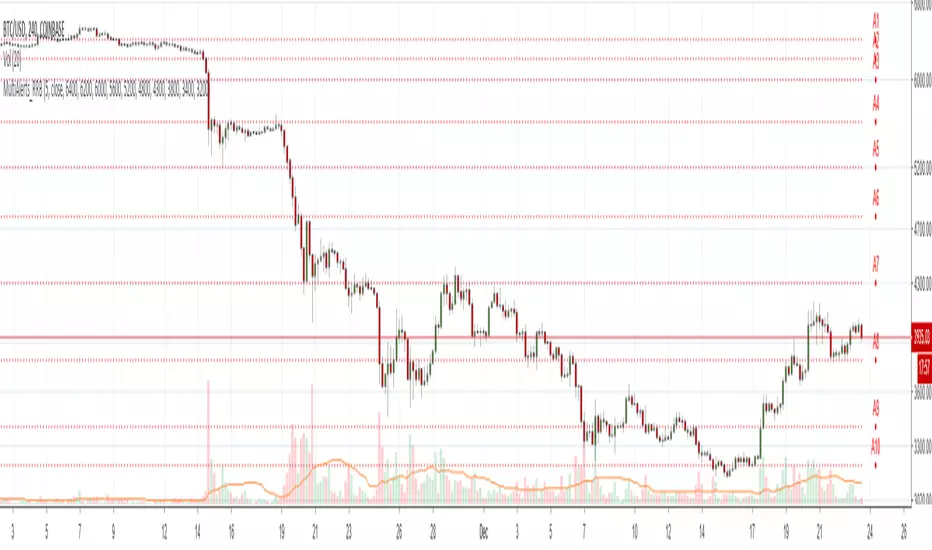
Spiky Iguana Multi RSI Bands (Reverse RSI for the Price) by RRBSpiky Iguana Multi RSI Bands by RagingRocketBull 2018
Version 1.0
This indicator shows multiple RSI Bands with prices corresponding to specified overbought/oversold RSI levels.
It is used to extrapolate the exact price levels currently matching a given set of RSI levels based on prior price/RSI levels action.
You can think of it as a reverse RSI where RSI levels are moving dynamically around the price instead of price bouncing between straight lines.
Features:
- 6+6 = 12 customizable Overbought(R)/Oversold(S) RSI Levels + 6 Mean(M) lines
- Multicolor levels/fill ranges
- Show/Hide specific S/R/M levels and fill ranges
1. uses plot*, fill and is based on RSIBANDS_LB
Good Luck! Feel free to explore and learn from the code

Balihuntul Normalized Absolute Volume by RRBBalihuntul Normalized Absolute Volume by RagingRocketBull 2018
Version 1.0
This indicator shows absolute and/or normalized volume for an asset, allows for more accurate volume based comparisons (like a log scale for volume).
Volume is measured in coins traded, not USD traded, so direct comparisons of different price moves may not be accurate.
Professional traders usually compare absolute or normalized volumes of trend moves/spikes/dips/capitulation events instead.
When the USD price of an asset is lower you can trade more coins but capitalization won't be as significant as when there are less coins for a higher price.
Similarly, you can normalize volume using:
- price/price ma (to get a bit of a price-weighted volume) or
- volume ma to compare it with its average assuming the total volume is a percentage above or below the MA (100% or 1).
- use alpha multiplier to add/lose a few zeroes if necessary
Features:
- Use Absolute Price Value (Price * Volume) of an asset instead of Coins Traded (Volume) to compare capitalization
- Normalize volume using Price / Price MA / Volume MA
- Supports any existing type of MA: SMA, EMA, WMA, HMA etc
- Oscillator mode with negative axis
- Highlight high volume spikes above MA or hide low volume bars below MA
- Change color based on prev Close or Volume bars
- Change Volume MA color based on a number of last rising/falling bars
- Display volume as 1000s, mlns, or blns using alpha multiplier
Notes:
1. uses plot* and custom hma functions
2. swma has a fixed length = 4, alma and linreg have additional offset and smoothing params
Feel free to use. Good Luck!

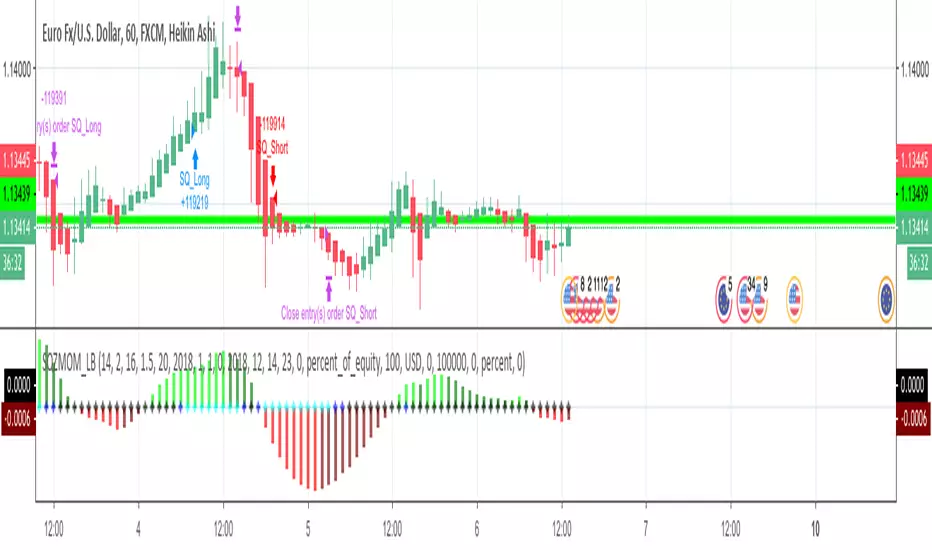
Strategy based on Squeeze Momentum Indicator [LazyBear]This Strategy is based on LazyBear Squeeze Momentum Indicator.
I added some custom feature and filters.
You can customize a lot of features to get a profitable strategy.
Here is a link to original study.
Please use comment section for any feedback.
Next improvement (only to whom is interested to this script and follows me): study with alerts on multiple tickers all at one. Leave a comment if you want to have access to study.
********************************** IMPORTANT*******************************
I have developed an expert advisor for metatrader4 (MT4) and for jforex platform: results of expert advisor form 2015-01-01 to 2018-11-25 are very good with low drawdown and good profit.
********************************************************************************

Stiffness IndicatorThis indicator was originally developed by Markos Katsanos (Stocks & Commodities, V.36:12 (November, 2018): "The Stiffness Indicator").
Like and follow for more open source indicators!
Happy Trading!

BarstateThe TradingView system has two types of bars. Bars that are historical and bars that are real-time.
When programming complex scripts and strategies that use higher timeframe data there can be difficult programming conditions due to these two bar states.
Especially in the case of after-hours, end of day, low volume trading and thinly traded stocks the bar state status can sometimes be historical and sometimes be real-time in different timeframes or even the same timeframe.
This script displays what state a bar is in by shading the background of the chart.
The script is being made publicly available to help my script users know about and understand 'barstate'. The script allows users to see the 'barstate' in order to help report bugs and conduct their own workarounds.
My testing has indicated that the 'barstate' status is sometimes spurious especially on thinly traded symbols. Additionally, the Tradingview back-end calls the script only after price changes to reduce system load. As a result, these two characteristics can cause unexpected Pine Script results.
Crinkebine
November 2018

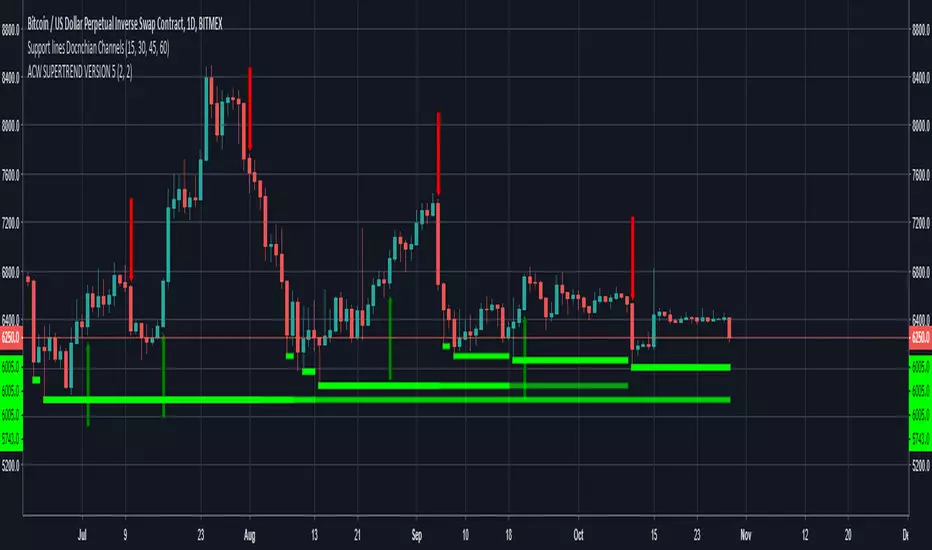
ACW SUPERTREND VERSION 5 Updated 29 October 2018//Author - PRINZ MASTER TRADER
//ACW SUPERTREND VERSION 5
numerous code changes that enable more accurate signal delivery and accuracy
removed false signals
enabled higher roe targets on higher time frames
works best on H2 with ethusd bitmex and all time frames on xbtusd bitmex
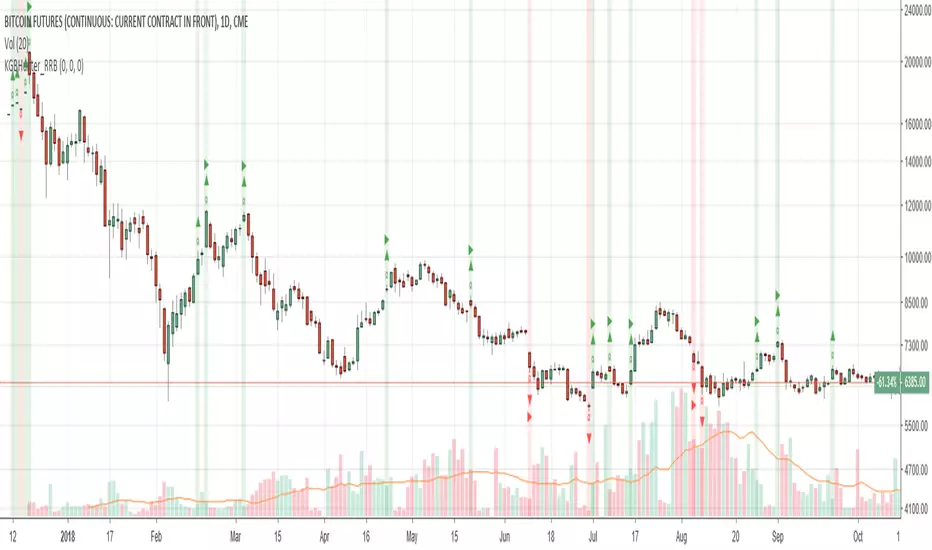
Katana Gaps Bounty Hunter Pro (Show Gaps of All Types) by RRBKatana Gaps Bounty Hunter Pro (KGB Hunter Pro, Gap Exterminator) by RagingRocketBull 2018
Version 1.0
This indicator shows/counts/filters gaps on a chart.
There are several versions: Simple, Pro, Advanced and Zones. This is the Pro version. The Differences are listed below.
- Simple: shows/counts gaps, changes color based on gap dir (2 colors), filters out price gaps within session, large gaps, and high volume gaps
- Pro: +shows all types of gaps, multi color, pro filters (full/partial/overlapping time, price, large, candle, volume, doji, weekend gaps within delta ranges)
- Advanced: +session times mask, show/count gaps only for last N bars, +min/max/filled gaps stats, dark mode
- Zones: +shows gaps as dynamic horiz zones
KGB Hunter Pro Gap Exterminator focuses on showing you all possible types of gaps in multiple colors. Gap theory states that price tends to return and fill the gaps,
so you can use it to collect the bounty. You can apply any combination of complex filters to narrow down search results i.e., find only all:
- type 3 gaps up with allowed wick-candle overlapping of up to 10% and
- gap size larger than 200 and
- with at least one of the candles larger than 100 and
- volume change at least 40 and
- spanning less than 2 bar periods and
- excluding weekend gaps
Features:
- highlights gaps using barcolor and plotchar chars (8 colors x 2 dirs)
- supports all 3 types of gap overlapping: full gap (no overlapping), wick-wick and wick-body overlapping up to a specified % of candle body
- finds all types of gaps with pro filters for price, time, large, volume, timerange, candle size, doji gaps
- individual show/hide flags for each gap/char based on gap type
- can show/hide gaps/chars based on gap dir
- changes color of gaps/chars based on gap dir/type, multi color gap type combos
- displays chars above/below bar based on gap dir
- can show/hide weekend gaps
- counts all filtered gaps
Colors:
Basically There are 2 gap types (Price, Time) x 2 directions (Up, Down) x 2 modifiers (Large, Volume), Volume Gap is a separate class with its own modifiers, so more accurately:
- (Price, Time) x 2 directions (Up, Down) x Large modifier
- (Price Volume, Time Volume) x 2 directions (Up, Down) x Large modifier
using a total of 16+1 colors or 8+1 base colors + transparency modifier
depending on settings you can highlight gaps using any multi color combo from just 1 to all 16 colors (+1 gray color for weekends).
basic gap = 1 base color with normal transparency
price,time = 2 base colors (including basic gap) with normal transparency (+1 color)
* up,down dir = +2 new base colors with normal transparency (including 2 base colors), with a total of 2*2 = 4 price/time base colors (+2 colors)
* large = same 4 base colors with vivid transparency modifier (+4 colors)
* volume = +2 new base colors with normal transparency, a separate class (+2 colors)
* volume * up,down dir = +another 2 new base colors with normal transparency (including 2 volume base colors), with a total of 2*2 = 4 volume base colors (+2 colors)
* volume * large = 4 volume base colors with vivid transparency modifier (+4 colors)
weekend_gap = gray (+1 color)
doji gap, candle gap, timerange gap = no special color, inherits color from parent gap type
for more details, please see the Gap Color Hierarchy comments in code
_________________________________________________________________________
You can find the following gap related terminology in literature: full, partial, extreme, breakaway, runaway/continuation, common, exhaustion gaps.
There are no exact rules to distinguish between them, so this can't be implemented.
When defining a gap it all boils down to how do you plot a gap, which points between adjacent candles do you consider a gap. Different sources apply different methodology
but in practice only 3 types of gap overlapping can exist:
- full gap (no overlapping),
- partial (wick-wick overlapping) and
- extreme partial (wick-body overlapping up to a specified % of a candle body)
All these types are supported in this script. The only possible remaining option is candle-candle overlapping which is not a gap by definition.
Many other script specific subtypes are also supported. Please see description of each gap type below and comments in code.
General display modes
- gap has 3 possible overlapping modes: full gap (no overlapping), wick-wick overlapping, wick-candle overlapping up to a specified % of candle body size (for mode 3 only)
the remaining candle-candle overlapping implies not a gap by definition
full gap mode will find the least amount of gaps, wick-candle - the most
- gap can be either price or time, up or down, and shown above or below the candles (gap chars)
- by definition, a price gap is a smaller subset of a time gap, a gap within current session with a price gap and zero time lag between bars.
Therefore timerange filter is useless for price gaps, but can still be applied.
On the other hand, all price gap filters can be applied to time gaps without any distinction.
- gap can have multiple modifier subtypes: (price|time) * (up|down) * (large? + volume? + doji? + timerange? + weekend?)
i.e. price + large + volume + doji or time + large + volume + timerange + doji + weekend
- the gap is always counted only once no matter how many subtype modifiers it has
- if the gap does not satisfy any of the applied flags/filters it is not shown/counted (no gap bars/chars are shown)
- gap color can depend on a combo of gap type/dir and modifier subtypes or can be shown in a single base color
- char color can only depend on gap dir (not type/modifiers) or can be shown in a single base color
- char position can also depend on gap dir (above/below) the gap candle. Alternatively you can pin chars to the top/bottom of the screen in UI Styles.
- change_by_type = true - uses gap type base colors (2 colors + optional modifiers, up to 8 colors if volume and/or large filters are enabled)
- change_by_dir = true - uses gap dir base colors (2 colors + optional modifiers, up to 8 colors if volume and/or large filters are enabled)
- both change_by_type and change_by_dir = true - uses both gap type and dir base colors (4 colors + optional modifiers, up to 16 colors if volume and/or large filters are enabled)
- both change_by_type and change_by_dir = false - uses a single base gap color (1 color)
- don't need that much colors - disable filters
- highlight bars has priority over individual gap flags, when it is false all gaps are hidden regardless of their corresponding flag settings (does not affect dim weekend gaps)
- show chars has priority over individual gap char flags, when it is false all char flags are hidden regardless of their corresponding flag settings
- price gaps are only shown/counted when show_price_gaps flag is true. The large or volume filters can be used to narrow down results further.
- time gaps are only shown/counted when show_time_gaps flag is true. The large, volume, and timerange filters can be used to narrow down results further.
- doji gaps are only shown/counted when show_doji_gaps flag is true. The doji candle size and other filters can be used to narrow down results further.
- show weekend gaps = true and dim weekend gaps = false - shows/counts weekend gaps
- show weekend gaps = true and dim weekend gaps = true - dims weekend gaps, doesn't show/count weekwend gaps
- show/dim weekend gaps do just that - show the gap if it happens on a weekend, not all weekends
- large gaps are only shown/counted when the large filter is enabled != 0. positive values 5 (>= 5), negative -5 (<=5) are used to switch between <>
- volume gaps are only shown/counted when the volume filter is enabled != 0. positive values 5 (>= 5), negative -5 (<=5) are used to switch between <>
- timerange gaps are only shown/counted when the timerange filter is enabled != 0. positive values 5 (>= 5), negative -5 (<=5) are used to switch between <>
- candle size gaps are only shown/counted when the candle size filter is enabled != 0. positive values 5 (>= 5), negative -5 (<=5) are used to switch between <>
- candle size filter is the only filter with 2 arguments, use_and_for_delta to enable AND condition for the args (OR is the default)
Good Luck! Feel free to explore and learn from the code

Katana Gaps Bounty Hunter (Show Gaps Counter) by RRBKatana Gaps Bounty Hunter (KGB_Hunter) by RagingRocketBull 2018
Version 1.0
This indicator shows/counts/filters gaps on a chart
There are several versions: Simple, Pro and Zones. This is the Simple version. The Differences are listed below.
- Simple: shows/counts gaps, changes color based on gap dir (2 colors), filters out price gaps within session, large gaps, and high volume gaps
- Pro: +shows all types of gaps, multi color, more filters (time gaps, doji, etc)
- Zones: +shows gaps as dynamic horiz zones
Features:
- highlights gaps using barcolor and plotchar chars (2 colors x 2 dirs)
- can show/hide gaps/chars based on gap dir
- changes color of gaps/chars based on gap dir
- displays chars above/below bar based on gap dir
- can filter out price gaps, large gaps, and high volume gaps
- counts all filtered gaps
Good Luck! Feel free to reuse the code and make it your own
TRI Level 2 Domino ScriptThis script is for our Level 2 class Fall 2018
But feel free to use if you find the script helpful.

PpSignal Chandelier StopThere are few indicators for MT4 which draw trailing stop line. I prefer to use Chandelier Stops. I believe that with good money management this is one of the best tools to follow a trend.
About ATR trailing stop loss (Chandelier Stops)
When you catch trend you can profit from most of the move. The good thing about ATR is that you have a stop loss level in place. When there is a close on the other side of ATR, it is a signal to close. No second guessing.
Best time frame for ATR trailing stop loss
I strongly recommend time frames such as 30m or larger. On lower time frames like 5m there is too much algo trading. I trade with ATR on 1h or 4h charts.
Parameters for trailing stop
Depends on pair or instrument. In most cases standard parameters will be fine. If I change anything then it is usually a Kv parameter. Standard is 3.5 and I tend to make it bigger like 3.7 or 4.0. In most cases it is around 3.7.
ATR trailing stop loss (Chandelier Exit) – Metatrader download
January 1, 2018 by simon in forex indicators
In this section you can download ATR trailing stop loss (Chandelier Exit) for MetaTrader:
– download ATR trailing stop loss (Chandelier Exit) for MetaTrader 4 –
There are few indicators for MT4 which draw trailing stop line. I prefer to use Chandelier Stops. I believe that with good money management this is one of the best tools to follow a trend.
About ATR trailing stop loss (Chandelier Stops)
When you catch trend you can profit from most of the move. The good thing about ATR is that you have a stop loss level in place. When there is a close on the other side of ATR, it is a signal to close. No second guessing.
Over 300 pips in profit thanks to ATR stop
Over 300 pips in profit thanks to ATR stop
Best time frame for ATR trailing stop loss
I strongly recommend time frames such as 30m or larger. On lower time frames like 5m there is too much algo trading. I trade with ATR on 1h or 4h charts.
Parameters for trailing stop
Depends on pair or instrument. In most cases standard parameters will be fine. If I change anything then it is usually a Kv parameter. Standard is 3.5 and I tend to make it bigger like 3.7 or 4.0. In most cases it is around 3.7.
Remember, it depends from pair and current situation in the market. You should experiment with few settings and check it on historical price action if they are ok.
Best pairs to trade with ATR trailing stop loss
Trailing stop loss works best in trending markets. That is why you should check pair if it tends to move strong or to move in range. It is not the secret that yen pairs line to move strongly. If you are looking for solid trends, you can’t go wrong with GBPJPY or EURJPY.

Random Walk Generator PRNG
/////////////////////////////////////////////////////////////////////////////
//
// Generates a random walk driven by a pseudo RNG that generates *returns* that are
// uniformly distributed between your upper and lower bound.
// Please drop me a note if you use the code in original or modified form.
// Inspiration and support from 4X4good .... check out his scripts
//
// Specs:
// Implementation of LCG, using "Numerical Recipes" parameter set (m,a,c)
// as described in wiki article (09/2018):
// en.wikipedia.org
//
// The "Skew" parameter raises the random return to the specified power
//
// Disclaimer:
// The PRNG is provided "as-is" and this specific implementation has not undergone
// any testing. Use at your own risk.
//
/////////////////////////////////////////////////////////////////////////////
