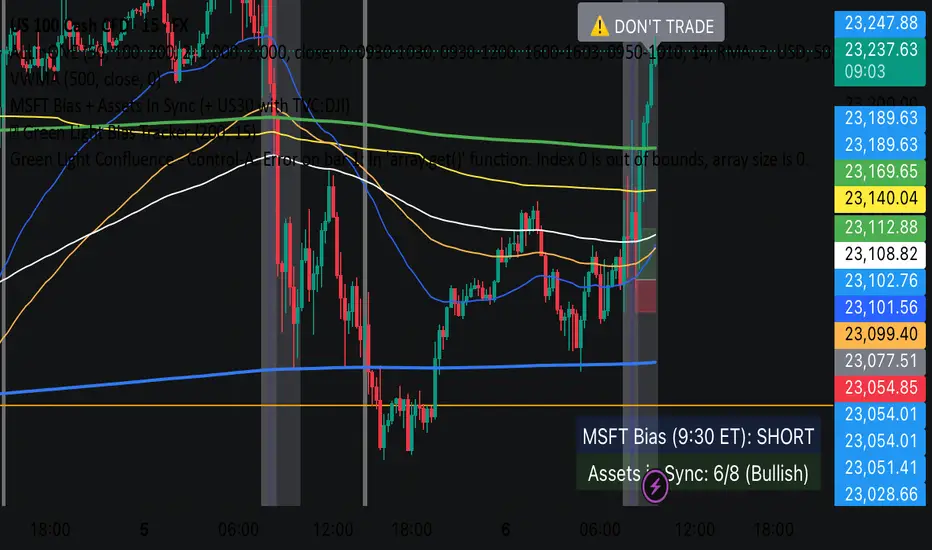
Green Light Confluence - Control-AIt scans the top 15 U.S. stocks in real time — including names like NASDAQ:AAPL , NASDAQ:AMZN , NASDAQ:NVDA , NASDAQ:GOOGL , NASDAQ:TSLA , and NASDAQ:MSFT — and identifies whether the majority are trending above or below their 200 EMA on the 1-minute chart.
Cerca negli script per "美国要强买强卖,要求中国购买指定商品,四年还必须买够15万亿?"
Opening Range Breakout (9:30 - 9:45 EST)Here's a Pine Script (v5) for TradingView that plots the Opening Range Breakout (ORB) lines from 9:30 AM to 9:45 AM EST on a 15-minute chart.
It draws a green line at the high of the opening range and a red line at the low, both extending through the rest of the day.

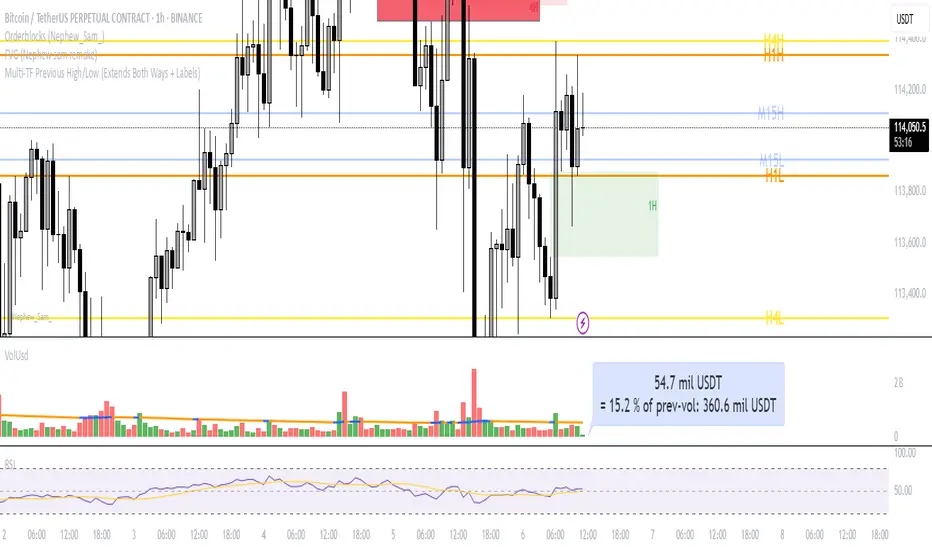
Multi‑TF Previous High/Low (Extends Both Ways + Labels)Use this indicator if you want to automate Support and Resistance levels.
Previous Day High and Low - Green Lines
Previous 4 Hour High and Low - Yellow Lines
Previous 1 Hour High and Low - Orange Lines
Previous 15 Minute High and Low - Light Blue Lines
Follow me on X-
@ADHDTRDR

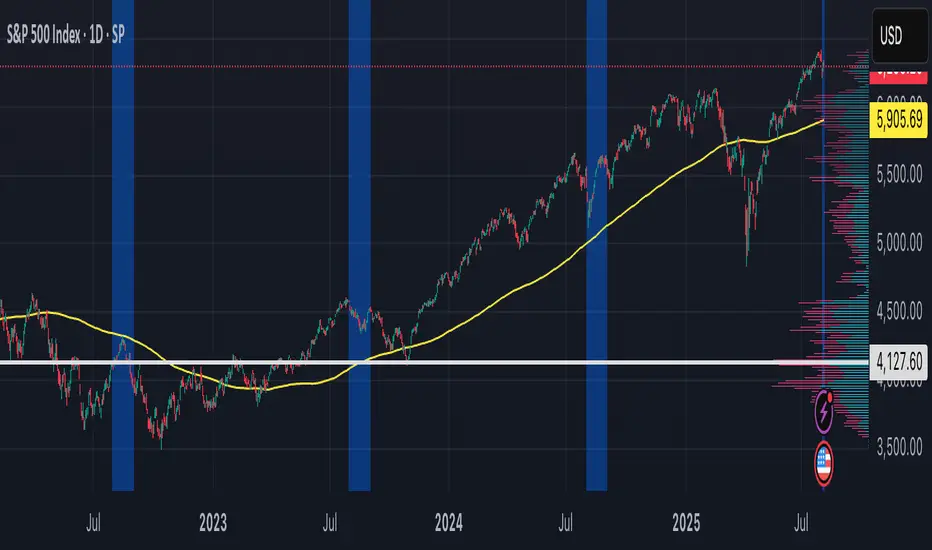
Period Highlighter ProPeriod Highlighter Pro is a versatile Pine Script indicator designed to visually highlight specific time periods on your TradingView charts, making it easier to analyze seasonal patterns, trading sessions, or specific weekdays. With customizable settings for months, weekdays, or intraday time ranges, this tool adapts to your trading strategy, allowing you to focus on key periods with precision.
Features
Flexible Highlight Modes: Choose from three modes to highlight:
Month Range: Highlight specific months or a range (e.g., March to June) for seasonal analysis.
Weekday Range: Highlight specific weekdays (e.g., Mondays or Monday to Wednesday) for weekly pattern analysis.
Time Range: Highlight daily time windows (e.g., 15:30–22:00) for intraday session analysis, restricted to weekdays.
Customizable Timezone: Set any IANA timezone (e.g., America/New_York, Europe/London) or UTC offset to align highlights with your preferred market hours.
Historical Range Control: Define how far back to apply highlights with options for years (Month Range), weeks (Weekday Range), or days (Time Range).
Visual Customization: Choose your highlight color to match your chart style.
User-Friendly Inputs: Intuitive dropdowns and tooltips guide you through configuring each mode, ensuring only relevant settings are adjusted.
How It Works
Select a highlight mode and configure the corresponding settings:
Month Range: Pick a start month and an optional end month (or "Disabled" for a single month) and set the number of years back.
Weekday Range: Choose a start weekday and an optional end weekday (or "Disabled" for a single day) and set the number of weeks back.
Time Range: Specify a start and end time (24-hour format) and the number of weekdays back. The indicator then applies a semi-transparent background color to chart bars that meet your criteria, making it easy to spot relevant periods.
Use Cases
Seasonal Traders: Highlight specific months to analyze recurring market patterns.
Day Traders: Focus on active trading sessions (e.g., New York open) with precise time range highlighting.
Weekly Pattern Analysts: Isolate specific weekdays to study price behavior.
Global Traders: Adjust for any timezone to align with your market of interest.
Why Use Period Highlighter Pro?
This indicator simplifies time-based analysis by providing a clear visual overlay for your chosen periods. Whether you're studying historical trends or focusing on specific trading hours, Period Highlighter Pro offers the flexibility and precision to enhance your chart analysis.
Licensed under the Mozilla Public License 2.0.
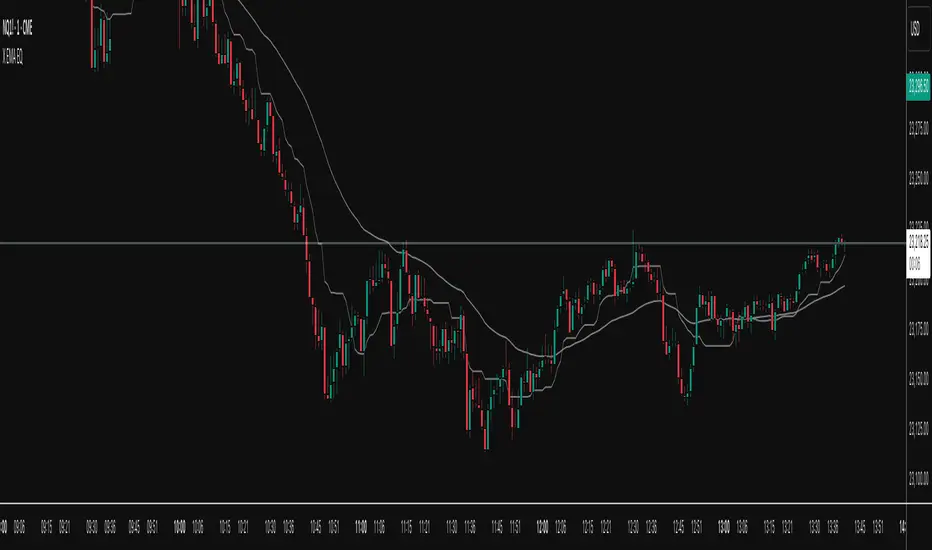
X EMA EQThe X EMA EQ is a versatile technical analysis tool designed to overlay price action with customizable Exponential Moving Averages (EMAs) and real-time equilibrium levels. Ideal for intraday traders, it blends trend-following and mean-reversion concepts to highlight both directional bias and potential value zones.
🔹 Key Features:
1. Dual EMA Visualization
Plot up to two user-defined EMAs (default: 20 and 50 periods).
Independently toggle and style each EMA to suit your strategy.
Helps track short- and mid-term trend dynamics with clarity.
2. Running Equilibrium Bands
Displays a real-time dynamic price range based on the highest high and lowest low over a user-defined rolling window (default: 15 minutes).
Includes upper/lower quartile lines and a central midpoint, giving structure to intraday price movement.
Useful for identifying compression, breakouts, and fair value zones.
3. Linear Regression Overlay (Optional)
Apply a smoothed linear regression curve across the same time window.
Highlights directional momentum and price mean trajectory.
Valuable for assessing slope bias and trend strength over the equilibrium period.
4. Intraday Timeframe Optimization
Designed specifically for intraday charts with minute-based resolutions (30 seconds to 60 minutes).
Auto-adjusts logic based on the current chart’s timeframe.
5. Clean Visual Design
Minimalist and translucent color schemes ensure readability without clutter.
All components are independently toggleable for full customization.
⚙️ Settings Overview:
EMA Settings: Enable/disable each EMA, set lengths and colors.
Time & Price Settings: Define the running equilibrium period (in minutes), control visibility of bands and regression line, and adjust styling.
X EMA EQ offers a compact yet powerful visual framework for traders seeking to align with short-term trend structure while keeping an eye on evolving price balance zones.
Manadi Buy/Sell Strategy EMA + MACD + RSI + AlertsIt is a strategy / indicator of buy and sell special crypto for 15 min to 1 h time frame.
used with RSI, Macd, and Ema cros 9/21

Time-Decaying Percentile Oscillator [BackQuant]Time-Decaying Percentile Oscillator
1. Big-picture idea
Traditional percentile or stochastic oscillators treat every bar in the look-back window as equally important. That is fine when markets are slow, but if volatility regime changes quickly yesterday’s print should matter more than last month’s. The Time-Decaying Percentile Oscillator attempts to fix that blind spot by assigning an adjustable weight to every past price before it is ranked. The result is a percentile score that “breathes” with market tempo much faster to flag new extremes yet still smooth enough to ignore random noise.
2. What the script actually does
Build a weight curve
• You pick a look-back length (default 28 bars).
• You decide whether weights fall Linearly , Exponentially , by Power-law or Logarithmically .
• A decay factor (lower = faster fade) shapes how quickly the oldest price loses influence.
• The array is normalised so all weights still sum to 1.
Rank prices by weighted mass
• Every close in the window is paired with its weight.
• The pairs are sorted from low to high.
• The cumulative weight is walked until it equals your chosen percentile level (default 50 = median).
• That price becomes the Time-Decayed Percentile .
Find dispersion with robust statistics
• Instead of a fragile standard deviation the script measures weighted Median-Absolute-Deviation about the new percentile.
• You multiply that deviation by the Deviation Multiplier slider (default 1.0) to get a non-parametric volatility band.
Build an adaptive channel
• Upper band = percentile + (multiplier × deviation)
• Lower band = percentile – (multiplier × deviation)
Normalise into a 0-100 oscillator
• The current close is mapped inside that band:
0 = lower band, 50 = centre, 100 = upper band.
• If the channel squeezes, tiny moves still travel the full scale; if volatility explodes, it automatically widens.
Optional smoothing
• A second-stage moving average (EMA, SMA, DEMA, TEMA, etc.) tames the jitter.
• Length 22 EMA by default—change it to tune reaction speed.
Threshold logic
• Upper Threshold 70 and Lower Threshold 30 separate standard overbought/oversold states.
• Extreme bands 85 and 15 paint background heat when aggressive fade or breakout trades might trigger.
Divergence engine
• Looks back twenty bars.
• Flags Bullish divergence when price makes a lower low but oscillator refuses to confirm (value < 40).
• Flags Bearish divergence when price prints a higher high but oscillator stalls (value > 60).
3. Component walk-through
• Source – Any price series. Close by default, switch to typical price or custom OHLC4 for futures spreads.
• Look-back Period – How many bars to rank. Short = faster, long = slower.
• Base Percentile Level – 50 shows relative position around the median; set to 25 / 75 for quartile tracking or 90 / 10 for extreme tails.
• Deviation Multiplier – Higher values widen the dynamic channel, lowering whipsaw but delaying signals.
• Decay Settings
– Type decides the curve shape. Exponential (default 1.16) mimics EMA logic.
– Factor < 1 shrinks influence faster; > 1 spreads influence flatter.
– Toggle Enable Time Decay off to compare with classic equal-weight stochastic.
• Smoothing Block – Choose one of seven MA flavours plus length.
• Thresholds – Overbought / Oversold / Extreme levels. Push them out when working on very mean-reverting assets like FX; pull them in for trend monsters like crypto.
• Display toggles – Show or hide threshold lines, extreme filler zones, bar colouring, divergence labels.
• Colours – Bullish green, bearish red, neutral grey. Every gradient step is automatically blended to generate a heat map across the 0-100 range.
4. How to read the chart
• Oscillator creeping above 70 = market auctioning near the top of its adaptive range.
• Fast poke above 85 with no follow-through = exhaustion fade candidate.
• Slow grind that lives above 70 for many bars = valid bullish trend, not a fade.
• Cross back through 50 shows balance has shifted; treat it like a micro trend change.
• Divergence arrows add extra confidence when you already see two-bar reversal candles at range extremes.
• Background shading (semi-transparent red / green) warns of extreme states and throttles your position size.
5. Practical trading playbook
Mean-reversion scalps
1. Wait for oscillator to reach your desired OB/ OS levels
2. Check the slope of the smoothing MA—if it is flattening the squeeze is mature.
3. Look for a one- or two-bar reversal pattern.
4. Enter against the move; first target = midline 50, second target = opposite threshold.
5. Stop loss just beyond the extreme band.
Trend continuation pullbacks
1. Identify a clean directional trend on the price chart.
2. During the trend, TDP will oscillate between midline and extreme of that side.
3. Buy dips when oscillator hits OS levels, and the same for OB levels & shorting
4. Exit when oscillator re-tags the same-side extreme or prints divergence.
Volatility regime filter
• Use the Enable Time Decay switch as a regime test.
• If equal-weight oscillator and decayed oscillator diverge widely, market is entering a new volatility regime—tighten stops and trade smaller.
Divergence confirmation for other indicators
• Pair TDP divergence arrows with MACD histogram or RSI to filter false positives.
• The weighted nature means TDP often spots divergence a bar or two earlier than standard RSI.
Swing breakout strategy
1. During consolidation, band width compresses and oscillator oscillates around 50.
2. Watch for sudden expansion where oscillator blasts through extreme bands and stays pinned.
3. Enter with momentum in breakout direction; trail stop behind upper or lower band as it re-expands.
6. Customising decay mathematics
Linear – Each older bar loses the same fixed amount of influence. Intuitive and stable; good for slow swing charts.
Exponential – Influence halves every “decay factor” steps. Mirrors EMA thinking and is fastest to react.
Power-law – Mid-history bars keep more authority than exponential but oldest data still fades. Handy for commodities where seasonality matters.
Logarithmic – The gentlest curve; weight drops sharply at first then levels off. Mimics how traders remember dramatic moves for weeks but forget ordinary noise quickly.
Turn decay off to verify the tool’s added value; most users never switch back.
7. Alert catalogue
• TD Overbought / TD Oversold – Cross of regular thresholds.
• TD Extreme OB / OS – Breach of danger zones.
• TD Bullish / Bearish Divergence – High-probability reversal watch.
• TD Midline Cross – Momentum shift that often precedes a window where trend-following systems perform.
8. Visual hygiene tips
• If you already plot price on a dark background pick Bullish Color and Bearish Color default; change to pastel tones for light themes.
• Hide threshold lines after you memorise the zones to declutter scalping layouts.
• Overlay mode set to false so the oscillator lives in its own panel; keep height about 30 % of screen for best resolution.
9. Final notes
Time-Decaying Percentile Oscillator marries robust statistical ranking, adaptive dispersion and decay-aware weighting into a simple oscillator. It respects both recent order-flow shocks and historical context, offers granular control over responsiveness and ships with divergence and alert plumbing out of the box. Bolt it onto your price action framework, trend-following system or volatility mean-reversion playbook and see how much sooner it recognises genuine extremes compared to legacy oscillators.
Backtest thoroughly, experiment with decay curves on each asset class and remember: in trading, timing beats timidity but patience beats impulse. May this tool help you find that edge.

5 SMA/EMA and Zigzag- Chỉ báo gộp của 2 chỉ báo 5 đường MA/EMA/WMA và đường zigzag
- Các thông số đường EMA và zigzag mặc định đã được đặt theo thông số khoá học Fibo
- 5 đường MA có thể lựa chọn loại đường SMA, EMA, WMA, VWM và được bật mặc định 3 đường EMA 8, 13, 21 và có thể thay đổi màu đường định dạng đường. Và giao cắt của đường EMA 10 và 21 được đánh dấu bằng các dấu chấm tròn.
- Đường zigzag được đặt thông số mặc định là 3.
Màu đường và độ dày đường zigzag có thể thay đổi từ bảng lựa chọn, kiểu đường thì phải thay đổi trong code.
- Bảng giá trị RSI, MA RSI thì đang để 7 khung thời gian. Muốn tắt bớt thì phải tắt trong code
Và giá trị của RSI và MA RSI sẽ không đúng với các Tf 5, 15, 30 nếu Tf của chart lớn hơn TF này (do tradingview) . Vd TF chart là 15m thì giá trị RSI trong bảng của khung 5m không đúng, Tf chart là 60m thì giá trị RSI của 30m, 15m , 5m trong bảng là không đúng. TF chart là 4H thì giá trị trong bảng của khung 5m, 15m 30m không đúng, còn giá trị của 1H, 2H, 3H vẫn đúng.
This is a combined indicator of two separate indicators: a 5-line MA/EMA/WMA indicator and a ZigZag indicator.
The default parameters for the EMA and ZigZag lines are set according to the Fibo course settings.
For the 5 moving averages, you can choose between SMA, EMA, WMA, and VWM. By default, 3 EMA lines (8, 13, 21) are enabled, and their colors and styles can be customized. The crossover between EMA 10 and EMA 21 is marked with circular dots.
The default setting for the ZigZag line is 3.
The color and thickness of the ZigZag line can be changed via the input panel, but the line style must be modified in the code.
The RSI and MA RSI value table is currently set to display across 7 timeframes. To reduce the number of timeframes shown, you will need to edit the code manually.
Note: The RSI and MA RSI values will not be accurate for timeframes 5m, 15m, and 30m if the chart's timeframe is higher than these (due to limitations in TradingView).
For example:
If the chart is on 15m, the RSI value for the 5m frame in the table will be incorrect.
If the chart is on 60m, then RSI values for 30m, 15m, and 5m will be incorrect.
If the chart is on 4H, the RSI values for 5m, 15m, and 30m will be incorrect, but the values for 1H, 2H, and 3H will still be correct.

Daily High/Low Close Breakout - GOLD### **Daily High/Low Close Breakout Indicator**
This indicator is a powerful tool for identifying potential breakout opportunities based on the previous day's price action. It's built on a unique time-based logic that defines key support and resistance levels for the trading day.
---
### **How the Indicator Works**
The indicator operates in two main phases:
1. **Calculation Period (00:00 to 16:30 Tehran Time):** The indicator first observes the price action from the start of the day until 16:30. During this time, it records the highest and lowest **closing prices** of all candles. The chart background is shaded gray to visually mark this period.
2. **Trading Period (16:30 to 16:30 the next day):** At 16:30, the highest and lowest close levels are finalized and drawn as horizontal lines. These levels then become the primary breakout zones for the next 24 hours. The indicator will generate signals whenever the price crosses these lines.
---
### **Trading Signals**
The indicator uses a simple and effective crossover logic for its signals:
* **BUY Signal:** A signal is generated when a candle's closing price **crosses above** the high close line.
* **SELL Signal:** A signal is generated when a candle's closing price **crosses below** the low close line.
---
### **Important Usage Guidelines**
For optimal performance, please follow these specific recommendations:
* **Timeframe:** This indicator is designed and optimized to be used exclusively on the **15-minute timeframe**. Using it on other timeframes may produce inconsistent or unreliable results.
* **Primary Asset:** The logic for this indicator was developed and backtested primarily for **Gold (XAUUSD)**. Its performance and win rate have been observed to be the most consistent on this asset.
* **Asset Restriction:** It is strongly recommended to **avoid using this indicator on other currency pairs or assets**, as it has not been optimized for their specific market behavior.
---
### **Disclaimer**
*This indicator is provided for informational and educational purposes only. It is not financial advice. Past performance is not a guarantee of future results. All trading decisions should be based on your own research and risk analysis. Always use proper risk management.*

Professional ORB Strategy - BUY & Sell signal- Ganesh SelvarayarORB 15 mins strategy buy and sell signal, with point system for your target

Advanced Forex Currency Strength Meter
# Advanced Forex Currency Strength Meter
🚀 The Ultimate Currency Strength Analysis Tool for Forex Traders
This sophisticated indicator measures and compares the relative strength of major currencies (EUR, GBP, USD, JPY, CHF, CAD, AUD, NZD) to help you identify the strongest and weakest currencies in real-time, providing clear trading signals based on currency strength differentials.
## 📊 What This Indicator Does
The Advanced Forex Currency Strength Meter analyzes currency relationships across 28+ major forex pairs and 8 currency indices to determine which currencies are gaining or losing strength. Instead of relying on individual pair analysis, this tool gives you a bird's-eye view of the entire forex market, helping you:
Identify the strongest and weakest currencies at any given time
Find high-probability trading opportunities by pairing strong vs weak currencies
Avoid ranging markets by detecting when currencies have similar strength
Get clear LONG/SHORT/NEUTRAL signals for your current trading pair
Optimize your trading strategy based on your preferred timeframe and holding period
## ⚙️ How The Indicator Works
### Dual Calculation Method
The indicator uses a sophisticated dual approach for maximum accuracy:
Pairs-Based Analysis: Calculates currency strength from 28+ major forex pairs (EURUSD, GBPUSD, USDJPY, etc.)
Index-Based Analysis: Incorporates official currency indices (DXY, EXY, BXY, JXY, CXY, AXY, SXY, ZXY)
Weighted Combination: Blends both methods using smart weighting for enhanced accuracy
### Smart Auto-Optimization System
The indicator automatically adjusts its parameters based on your chart timeframe and intended holding period:
The system recognizes that scalping requires different sensitivity than swing trading, automatically optimizing lookback periods, analysis timeframes, signal thresholds, and index weights.
### Strength Calculation Process
Fetches price data from multiple timeframes using optimized tuple requests
Calculates percentage change over the specified lookback period
Optionally normalizes by ATR (Average True Range) to account for volatility differences
Combines pair-based and index-based calculations using dynamic weighting
Generates relative strength by comparing base currency vs quote currency
Produces clear trading signals when strength differential exceeds threshold
## 🎯 How To Use The Indicator
### Quick Start
Add the indicator to any forex pair chart
Enable 🧠 Smart Auto-Optimization (recommended for beginners)
Watch for LONG 🚀 signals when the relative strength line is green and above threshold
Watch for SHORT 🐻 signals when the relative strength line is red and below threshold
Avoid trading during NEUTRAL ⚪ periods when currencies have similar strength
Note: This is highly recommended to couple this indicator with fundamental analysis and use it as an extra signal.
### 📋 Parameters Reference
#### 🤖 Smart Settings
🧠 Smart Auto-Optimization: (Default: Enabled) Automatically optimizes all parameters based on chart timeframe and trading style
#### ⚙️ Manual Override
These settings are only active when Smart Auto-Optimization is disabled:
Manual Lookback Period: (Default: 14) Number of periods to analyze for strength calculation
Manual ATR Period: (Default: 14) Period for ATR normalization calculation
Manual Analysis Timeframe: (Default: 240) Higher timeframe for strength analysis
Manual Index Weight: (Default: 0.5) Weight given to currency indices vs pairs (0.0 = pairs only, 1.0 = indices only)
Manual Signal Threshold: (Default: 0.5) Minimum strength differential required for trading signals
#### 📊 Display
Show Signal Markers: (Default: Enabled) Display triangle markers when signals change
Show Info Label: (Default: Enabled) Show comprehensive information label with current analysis
#### 🔍 Analysis
Use ATR Normalization: (Default: Enabled) Normalize strength calculations by volatility for fairer comparison
#### 💰 Currency Indices
💰 Use Currency Indices: (Default: Enabled) Include all 8 currency indices in strength calculation for enhanced accuracy
#### 🎨 Colors
Strong Currency Color: (Default: Green) Color for positive/strong signals
Weak Currency Color: (Default: Red) Color for negative/weak signals
Neutral Color: (Default: Gray) Color for neutral conditions
Strong/Weak Backgrounds: Background colors for clear signal visualization
### 🧠 Smart Optimization Profiles
The indicator automatically selects optimal parameters based on your chart timeframe:
#### ⚡ Scalping Profile (1M-5M Charts)
For positions held for a few minutes:
Lookback: 5 periods (fast/sensitive)
Analysis Timeframe: 15 minutes
Index Weight: 20% (favor pairs for speed)
Signal Threshold: 0.3% (sensitive triggers)
#### 📈 Intraday Profile (10M-1H Charts)
For positions held for a few hours:
Lookback: 12 periods (balanced sensitivity)
Analysis Timeframe: 4 hours
Index Weight: 40% (balanced approach)
Signal Threshold: 0.4% (moderate sensitivity)
#### 📊 Swing Profile (4H-Daily Charts)
For positions held for a few days:
Lookback: 21 periods (stable analysis)
Analysis Timeframe: Daily
Index Weight: 60% (favor indices for stability)
Signal Threshold: 0.5% (conservative triggers)
#### 📆 Position Profile (Weekly+ Charts)
For positions held for a few weeks:
Lookback: 30 periods (long-term view)
Analysis Timeframe: Weekly
Index Weight: 70% (heavily favor indices)
Signal Threshold: 0.6% (very conservative)
### Entry Timing
Wait for clear LONG 🚀 or SHORT 🐻 signals
Avoid trading during NEUTRAL ⚪ periods
Look for signal confirmations on multiple timeframes
### Risk Management
Stronger signals (higher relative strength values) suggest higher probability trades
Use appropriate position sizing based on signal strength
Consider the trading style profile when setting stop losses and take profits
💡 Pro Tip: The indicator works best when combined with your existing technical analysis. Use currency strength to identify which pairs to trade, then use your favorite technical indicators to determine when to enter and exit.
## 🔧 Key Features
28+ Forex Pairs Analysis: Comprehensive coverage of major currency relationships
8 Currency Indices Integration: DXY, EXY, BXY, JXY, CXY, AXY, SXY, ZXY for enhanced accuracy
Smart Auto-Optimization: Automatically adapts to your trading style and timeframe
ATR Normalization: Fair comparison across different currency pairs and volatility levels
Real-Time Signals: Clear LONG/SHORT/NEUTRAL signals with visual markers
Performance Optimized: Efficient tuple-based data requests minimize external calls
User-Friendly Interface: Simplified settings with comprehensive tooltips
Multi-Timeframe Support: Works on any timeframe from 1-minute to monthly charts
Transform your forex trading with the power of currency strength analysis! 🚀

Previous Day Liquidity ZonesThis indicator is designed for intraday liquidity-based trading strategies and helps traders identify high-probability reversal or breakout zones based on smart money concepts.
It automatically plots the:
🟥 Previous Day High Zone – potential buy-side liquidity trap
🟩 Previous Day Low Zone – potential sell-side liquidity trap
🟧 Previous Day Close Zone – potential rebalancing or indecision zone
These levels are critical areas where institutional stop-hunting, reversals, and fake breakouts often occur.
🎯 How to Use
Use this indicator on 1-minute or 5-minute charts for stocks, indices (like NIFTY, BANKNIFTY), or forex.
Watch for price entering these zones during live market hours.
Combine with price action confirmation:
Rejection wicks
Engulfing candles
Change of character (CHoCH) or BOS
Fair Value Gaps (FVG)
First 5-minute candle (9:15 AM in Indian market) is highlighted for breakout setups.
🧠 Smart Money Logic
These zones mimic the logic used by institutions to:
Trigger retail stop-losses
Reverse market direction near liquidity pools
Trap breakout traders around session extremes
⚙️ Features
Configurable zone width (%)
Visual fill zones with subtle shading
Support for all assets and timeframes
Highlights first candle of day to assist with pre-trade bias
✅ Ideal For:
Smart money traders
ICT / Wyckoff / SMC followers
Breakout trap or reversal strategy users
Anyone who trades key session levels
⚠️ Disclaimer
This is an informational tool. Always use confirmation and sound risk management before executing any trade.

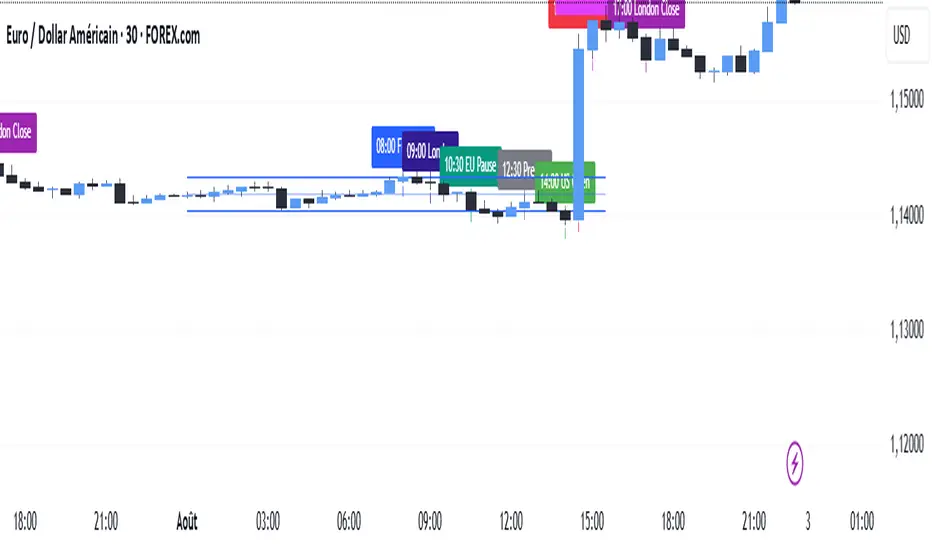
SMC TimingThis indicator (“SMC Timing”) visually marks the exact moments when the market typically experiences large liquidity injections—moments that often trigger strong directional moves. By plotting dashed vertical lines and labels at key session boundaries and news events (Frankfurt open, London open, EU mid-session pause, Pre-US, US open, 14:30 U.S. news releases, 15:00 breakout window, and the London close), it draws your attention to the times when stop-runs and institutional orders tend to pile into the market.
Traders can use these timing zones to:
Anticipate liquidity sweeps where smart-money often liquidates weak positions or hunts stops.
Plan higher-probability entries just before or directly after these injections, reducing slippage and improving execution.
Improve win-rate consistency by aligning your trades with the natural ebb and flow of institutional flow rather than fading it.
With customizable session toggles, a “today-only” filter, and a small vertical offset to keep markers clear of price bars, this tool seamlessly integrates into any chart. Positioning yourself around these highlighted times helps you capture the bulk of intraday moves and avoids getting caught in low-liquidity chop.
Time-Price Velocity [QuantAlgo]🟢 Overview
The Time-Price Velocity indicator uses advanced velocity-based analysis to measure the rate of price change normalized against typical market movement, creating a dynamic momentum oscillator that identifies market acceleration patterns and momentum shifts. Unlike traditional momentum indicators that focus solely on price change magnitude, this indicator incorporates time-weighted displacement calculations and ATR normalization to create a sophisticated velocity measurement system that adapts to varying market volatility conditions.
This indicator displays a velocity signal line that oscillates around zero, with positive values indicating upward price velocity and negative values indicating downward price velocity. The signal incorporates acceleration background columns and statistical normalization to help traders identify momentum shifts and potential reversal or continuation opportunities across different timeframes and asset classes.
🟢 How It Works
The indicator's key insight lies in its time-price velocity calculation system, where velocity is measured using the fundamental physics formula:
velocity = priceChange / timeWeight
The system normalizes this raw velocity against typical price movement using Average True Range (ATR) to create market-adjusted readings:
normalizedVelocity = typicalMove > 0 ? velocity / typicalMove : 0
where "typicalMove = ta.atr(lookback)" provides the baseline for normal price movement over the specified lookback period.
The Time-Price Velocity indicator calculation combines multiple sophisticated components. First, it calculates acceleration as the change in velocity over time:
acceleration = normalizedVelocity - normalizedVelocity
Then, the signal generation applies EMA smoothing to reduce noise while preserving responsiveness:
signal = ta.ema(normalizedVelocity, smooth)
This creates a velocity-based momentum indicator that combines price displacement analysis with statistical normalization, providing traders with both directional signals and acceleration insights for enhanced market timing.
🟢 How to Use
1. Signal Interpretation and Threshold Zones
Positive Values (Above Zero): Time-price velocity indicating bullish momentum with upward price displacement relative to normalized baseline
Negative Values (Below Zero): Time-price velocity indicating bearish momentum with downward price displacement relative to normalized baseline
Zero Line Crosses: Velocity transitions between bullish and bearish regimes, indicating potential trend changes or momentum shifts
Upper Threshold Zone: Area above positive threshold (default 1.0) indicating strong bullish velocity and potential reversal point
Lower Threshold Zone: Area below negative threshold (default -1.0) indicating strong bearish velocity and potential reversal point
2. Acceleration Analysis and Visual Features
Acceleration Columns: Background histogram showing velocity acceleration (the rate of change of velocity), with green columns indicating accelerating velocity and red columns indicating decelerating velocity. The interpretation depends on trend context: red columns in downtrends indicate strengthening bearish momentum, while red columns in uptrends indicate weakening bullish momentum
Acceleration Column Height: The height of each column represents the magnitude of acceleration, with taller columns indicating stronger acceleration or deceleration forces
Bar Coloring: Optional price bar coloring matches velocity direction for immediate visual trend confirmation
Info Table: Real-time display of current velocity and acceleration values with trend arrows and change indicators
3. Additional Features:
Confirmed vs Live Data: Toggle between confirmed (closed) bar analysis for stable signals or current bar inclusion for real-time updates
Multi-timeframe Adaptability: Velocity normalization ensures consistent readings across different chart timeframes and asset volatilities
Alert System: Built-in alerts for threshold crossovers and direction changes
🟢 Examples with Preconfigured Settings
Default : Balanced configuration suitable for most timeframes and general trading applications, providing optimal balance between sensitivity and noise filtering for medium-term analysis.
Scalping : High sensitivity setup with shorter lookback period and reduced smoothing for ultra-short-term trades on 1-15 minute charts, optimized for capturing rapid momentum shifts and frequent trading opportunities.
Swing Trading : Extended lookback period with enhanced smoothing and higher threshold for multi-day positions, designed to filter market noise while capturing significant momentum moves on 1-4 hour and daily timeframes.

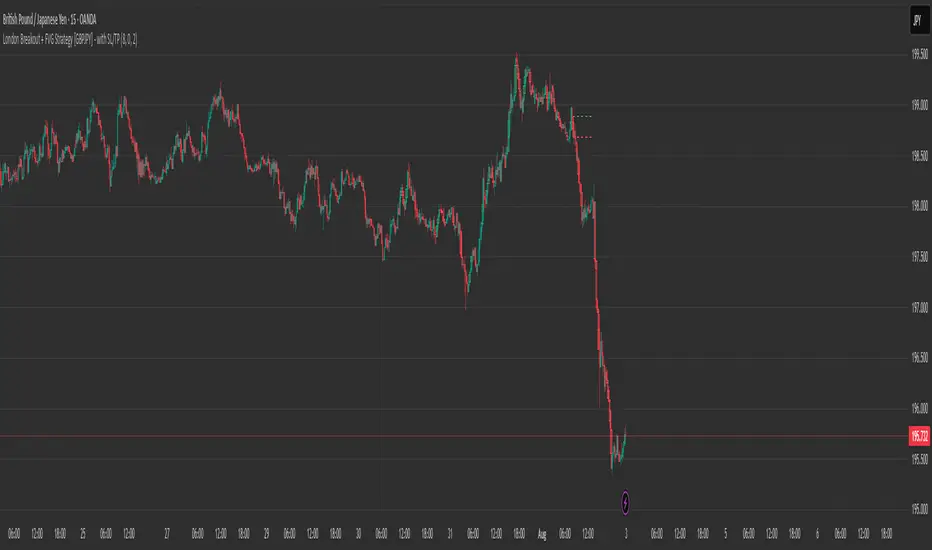
London Breakout + FVG Strategy [GBPJPY] - with SL/TPMarks the London open high and low on 15 min time frame, ads fvg on 5 min for orders
TZtraderTZtrader
This is a TrendZones version with features to set stoploss and targets in short and long positions meant for use in intraday charts. It aims to provide signals for opening and closing long and short positions. In the comments under the TrendZones publication several people expressed a need for features for a short position similar to those for a long position as implemented in TrendZones, some want to use it for scalping, some asked for alerts. When I proposed to create a version for day trading with target lines based on ATR, several people liked the idea.
Full disclosure: I don’t do day trading, because, after I lost a lot of money, I had to promise my wife to stay away from it. I restrict myself to long term investing in stocks which are in uptrend. However I understand what a day trader needs. I gather from my experience that day trading or scalping is an attempt to earn something by opening a position in the morning and close, reopen and close it again during the day with a profit. It is usually done with leveraged instruments like CFD’s, futures, options, and what have you. Opening and closing positions is done within minutes, so the trader needs a quick and efficient way to set proper stoploss and target. TZtrader supports this by showing only three or four numbers on the price bar: The price of the instrument, The logical stop level (gray or green or maroon dots), and the target level (navy). All other numbers are suppressed to prevent mistakes. Also a clear feedback for current settings at the top-center of the pane and an alert feedback at bottom that flashes alerts during the development of the current bar and gives suppression status.
The script
First I made a bare bones version of TrendZones to which I added code for long and short trading setups and a bare setup for no position. The code for the logical stops in long setup had to be reviewed, after which this became the basis for stops in short setup.
Then I added code for 10 alert messages, which was a hassle, because this is the first time I coded alerts and the first time I used an array as a stack to avoid a complicated if-then construction. During testing the array caused a runtime error which I solved by adding ‘array.clear’ to the code, also I discovered that in TradingView separate alerts have to be created for all three setups - short, long and bare. Flipping setups is done in the inputs with a dropdown menu because Pine Script has no function for a clickable button.
One visual with three setups.
The visual has the TrendZones structure: Three near parallel very smooth curves, which border the moderate uptrend (green) and downtrend (orange) zone over and under the curve in the middle, the COG (Center Of Gravity). Where the price breaks out of these curves, strong trend zones show up over and under the curves, respectively strong uptrend (blue) and strong downtrend (red).
Three setups were made clearly different to avoid confusion and to provide oversight in case of multiple trades going on simultaneously which I imagine are monitored in one screen. You have to see which one is long, which short and which have no position. The long setup should not trigger short signals, nor should the short trigger long signals nor the bare setup exclusive long or short signals.
The Long setup is default, shown on the example chart. In this setup the Stoploss suggestions (green, gray and maroon dots) are under the price bars and the target line (navy) at a set distance above the High Border. A zone with a width of 1 ATR is drawn under the Low Border. In this setup 5 specific alerts are provided
The Short setup has the Stoploss suggestions over the price bars, the target line at a set distance under the Low Border. A zone with a width of 1 ATR is drawn above the High Border. This setup also has 5 specific alerts.
The Bare setup has no Stoploss suggestions, no target line and supports 4 alerts, 2 in common with the Long setup and 2 with Short.
The table below gives a summary of scripted alerts:
Setup = Where = When = Purpose
Long, Bare = Green Zone = Bars come from lower zones = Uptrend starts
Long, Bare = Green Zone = Sideways ends in uptrend = Uptrend resumes
Long = COG = First crossing = Uptrend might end warning
Long = Orange Zone = Bars come from higher zones = Uptrend ended take care
Long = Red Zone = Bars come from higher zones = Strong downtrend->close Long
Short, Bare = Orange Zone = Bars come from higher zones = Downtrend starts
Short, Bare = Orange Zone = Sideways ends in downtrend = Downtrend resumes
Short = COG = First crossing = Downtrend might end warning
Short = Green Zone = Bars come from lower zones = Downtrend ended take care
Short = Blue Zone = Bars come from lower zones = Strong uptrend -> close short
You can use script alerts in TradingView by clicking the clock in the sidebar, then ‘create alert’ or plus, as condition you choose ‘Tztrader’ in the dialog box, then the “Any alert() function call” option (the first item in the list). The script lets the valid alert trigger by TradingView after the bar is completed, this can differ from the flashed messages during its formation.
When you create alerts in Tradingview, I advice to do that for each setup, then to make only the alert active which matches the current setup, pause the other ones.
Suppressing false and annoying signals
The script has two ways to suppress such signals, which have to do with the numbers in the alert feedback. The numbers left and right of the message with a colored background, depict the zones in which the previous (left) and current (right) bar move. 1 is the strong downtrend zone (red), 2 the moderate downtrend zone (orange), 3 the sideways zones (gray), 4 the COG (gray), 5 the moderate uptrend zone (green), 6 the strong uptrend zone (blue), 7 something went wrong with assigning a zone (black). In extensive testing the number 7 never occurs, because I catch that error in the code. The idea is that an alert is only triggered if the previous bar was in a different zone. When the bars are in the same zone, no alert is possible. This way all annoying signals are suppressed and long, short and bare get the appropriate alerts.
The third number is a counter. It counts how often the COG is crossed without touching the outer curves. The counter will reset to zero when the upper or lower curve is touched. When the count is 1 you have zone situation 4 and appropriate alerts are flashed. When the count is 2 or higher, a sideways situation (3) is called and while the recrossings are going on, no alerts can be flashed. This suppresses false signals. The ATR zone and curves are brownish-gray where sideways happens(ed). When the channel is narrowed down to just the three curves, some false signals still might occur.
Inputs
“Setup”, default is long, drop down menu provides long, short and bare.
“Target ATR”, default is 2, sets the amount of ATR for the target line. In 1 minute charts 4 seems an appropriate setting, you have to learn by experience which setting works.
“show feedback …” default is on, This creates two feedback labels, a Setup feedback on top of the pane, which shows charted instrument, Setup type, Trend and timeframe of the chart. Background color of Trend feedback is green when it matches the setup, red when mismatches and gray when no match. The alert feedback at the bottom of the pane shows a number, a message and two numbers. The numbers will be explained in the chapter about false and annoying signals below. During formation of the bar, valid alerts are flashed with a blue background, otherwise the message ‘alerts for current bar suppressed’.
Logical Stops
The curves are the logical place to put stops, because, as these are averages of the high and low border of a Donchian channel, they signify the ‘natural’ current highest, lowest and main level in the lookback period that fit the monitored trend setup. A downtrend turns into an uptrend when a breakout of the upper curve occurs. If you are short, that is where you want to close position, so the logical place for the stoploss is the upper curve. Vice versa, when you are long, the logical stop is on the lower curve. The stops show up as green or gray dots on the curves, the green dots signify a nice entry level, the gray stops are there to suggest levels where unrealized profits might be secured, the maroon dots indicate that the trend mismatches the setup.
COG versus other lines
Any line used to identify a trend, be it some MA or some other line, is interpreted the same way: When the bars move above the line there is an uptrend and when below, a downtrend. COG is not different in that sense. If you put such a line in the same chart as TZtrader, you can see situations in which the other line shows uptrend or downtrend earlier than COG, also some other lines, e.g. Hull MA, are very good at showing tops and bottoms, while COG ignores these. On the other hand the other lines are usually a little nervous and let you shake out of position too soon. Just like the other lines, COG gives false signals when it is near horizontal. The advantage of the placement COG is the tolerance for pull backs. This way TZtrader keeps you longer in the trend. Such pull backs are often ‘flags’ which are interpreted in TA as confirming the trend. Tztrader aims to get you in position reasonably soon when a trend begins and out of position as soon as the trend turns against you. The placement of COG is done with a fundamentally different algorithm than other lines as it is not an average of prices, but the middle of two averages of borders of a Donchian channel. This gives the two zones between the curves the same quality as the two zones above and below the middle line of a standard Donchian Channel.
A multi timeframe application.
In this scenario you put a 5 minutes and 1 minute chart with Tztrader side by side. If the 5 minutes shows uptrend, set the 1 minute on long trading and open positions when the trend matches uptrend en close when it mismatches. Don’t open short positions. Once the 5 minute changes to downtrend, set Tztrader in the 1 minute to short trading and open positions when the trend matches downtrend and close when it mismatches.
The idea is that in a long ‘context’, provided by the 5 minutes, the uptrends in the 1 minute will last longer and go further, vice versa for the short ‘context’. This way you do swing trading in the 5 minute in a smart way, maximizing profits.
You can do this with any timeframe pairs with a proportion of around 5:1, 4:1, 6:1, like e.g. 60 minutes and 15 minutes or weeks and days (5 trading days in a week).
Dear day-traders, may this tool be helpful and may your days be blessed.
Take care

EMA Trend Confirmation with Alerts此脚本是基于EMA 200周期 50周期 20周期加以合并并进行改进的一个脚本指标,主要作用是用于观察趋势走向,其中有上升下降和震荡趋势,经过多数测试,此指标适用于短线交易,推荐周期为20或15,大周期和长线交易详见RSI+EMA结合指标
This script is an improved script indicator based on the EMA 200 period, 50 period, and 20 period. Its main function is to observe the trend direction, including up, down, and oscillating trends. After many tests, this indicator is suitable for short-term trading, and the recommended period is 20 or 15. For large-cycle and long-term trading, please refer to the RSI+EMA combination indicator.
GTrader-ICT All In One-Comumnity VersionMeet the **GTrader-ICT All In One **, a comprehensive toolkit designed to integrate key Inner Circle Trader (ICT) concepts directly onto your chart. This powerful overlay indicator consolidates multiple essential tools, streamlining your technical analysis and helping you identify key temporal and price-based events.
📚 References & Inspiration
This indicator stands on the shoulders of giants. With the help of **tradeforopp** and **LuxAlgo**. The concepts and some implementation details were referenced from the following excellent, publicly available scripts:
ICT Killzones: The session drawing and pivot logic is adapted from tradeforopp
ICT Macros: The macro detection and plotting functionality is inspired by the work of Lux Algo , particularly their widely-used indicators covering ICT concepts.
🎯 Core Features
* **ICT Killzones:** Visualize critical trading sessions with customizable boxes. You can easily toggle and style the **Asia**, **London**, and **New York (AM, Lunch, PM)** sessions to focus on the liquidity and volatility that matter most to your strategy.
* Fully customizable session times and colors.
* Timezone support to align sessions with your local or preferred trading time (defaults to `America/New_York`).
* **ICT Macros:** Automatically identify and plot specific, short-duration time windows where institutional algorithms are known to be active (e.g., `09:50-10:10`, `14:50-15:10`, etc.).
* Plots the high/low range of the macro, providing clear levels of interest.
* Utilizes 1-minute data for precision, even when viewing on 3-minute or 5-minute charts.
📚 Optimization over the other original indicators
We add the custom input for macros session, users just need to input the from/to hour: minute format, and they will be converted into session objects in pinescript
The macro draws function is optimized, removing redundant draws, leading to better performance
Add "Distance from Macro Line to Chart" option
Add "Session Drawings Limit" for better performance
⚠️ Notes on TradingView Warnings
You may encounter some warnings from TradingView when using this script. These are generally expected due to the script's advanced, event-driven nature:
1. **Function Call Consistency:** The function 'box.new' should be called on each calculation for consistency, which may appear. This happens because drawing elements (like session boxes) are intentionally created only on the *first bar* of a new session, not on every single bar. This is a necessary design choice for performance and to prevent duplicate drawings.
2. **Potential for Repainting/Slow Load:** The **Macro** feature uses the `request.security_lower_tf()` function to get accurate 1-minute data. This can trigger warnings about performance or slow loading times. This is a known trade-off for achieving the precision required for the feature.

Dynamic S/R System - Pivot + ChannelDynamic S/R System - Pivot + Channel
A comprehensive Support & Resistance indicator combining dual methodologies for institutional-grade price level analysis
📊 CORE FEATURES
Dual Detection System
• Pivot-Based Levels - Historical turning points with intelligent touch counting
• Dynamic Channel S/R - Trend-aware linear regression boundaries
• Smart Level Management - Auto-merges similar levels, removes weak/outdated ones
Volume Integration
• Multi-timeframe volume analysis using EMA oscillator and spike detection
• Volume confirmation for all breakout signals to filter false moves
• Real-time volume status (Normal/High/Spike) in live information panel
Intelligent Touch Counting
• Automatic level validation through touch frequency analysis
• Strength classification with visual differentiation (colors/thickness)
• Level labels showing exact touch count (S3, R5, etc.)
━━━━━━━━━━━━━━━━━━━━━━━━━━━━━━━━━━━━━━━━━━━━━━━━━━━━━━━━━━━━━━━━━━━━━━━━━━━━━━━
🎨 VISUAL ELEMENTS
Line System
Solid Lines: Pivot-based S/R levels
Dashed Lines: Dynamic channel boundaries
Color Coding:
• 🔵 Blue/🔴 Red: Standard support/resistance
• 🟠 Orange: Strong levels (multiple touches)
• 🟣 Purple: Channel S/R levels
Signal Labels
• "B" - Pivot S/R breakout with volume confirmation
• "CB" - Channel boundary breakout
• "Bull/Bear Wick" - False breakout detection (wick rejections)
Information Panel
Real-time analysis displays:
• Total resistance/support levels detected
• Closest S/R levels to current price
• Volume status and position relative to levels
• Current market position assessment
━━━━━━━━━━━━━━━━━━━━━━━━━━━━━━━━━━━━━━━━━━━━━━━━━━━━━━━━━━━━━━━━━━━━━━━━━━━━━━━
✅ KEY ADVANTAGES
Multi-Method Validation
Combines historical pivot analysis with dynamic trend channels for comprehensive market view
False Breakout Protection
• Volume confirmation requirements
• Wick analysis to identify failed attempts
• Multiple validation criteria before signal generation
Adaptive Level Management
• Automatically updates as new pivots form
• Removes outdated/weak levels
• Maintains clean, relevant level display
Institutional-Grade Analysis
• Touch counting reveals institutional respect levels
• Volume integration shows smart money activity
• Strength classification identifies high-probability zones
━━━━━━━━━━━━━━━━━━━━━━━━━━━━━━━━━━━━━━━━━━━━━━━━━━━━━━━━━━━━━━━━━━━━━━━━━━━━━━━
⏰ OPTIMAL USE CASES
Best Timeframes
• Daily - Primary recommendation for swing trading
• 4-Hour - Intraday analysis and entries
• Weekly - Long-term position planning
Ideal Markets
• Crypto pairs (especially ETH/BTC, BTC/USD)
• Forex majors with good volume data
• Large-cap stocks with institutional participation
Trading Applications
• Entry/exit planning around key S/R levels
• Breakout confirmation with volume validation
• Risk management using nearest S/R for stops
• Trend analysis through channel dynamics
━━━━━━━━━━━━━━━━━━━━━━━━━━━━━━━━━━━━━━━━━━━━━━━━━━━━━━━━━━━━━━━━━━━━━━━━━━━━━━━
⚙️ CONFIGURATION GUIDELINES
Conservative Setup (Higher Confidence)
Min Pivot Strength: 3-4
Volume Threshold: 25-30%
Max Levels: 6-8
Aggressive Setup (More Signals)
Min Pivot Strength: 2
Volume Threshold: 15-20%
Max Levels: 10-12
🔔 ALERT SYSTEM
Breakout Alerts
• Resistance/Support breaks with volume confirmation
• Channel boundary violations
• Approaching strong S/R levels
Advanced Notifications
• Strong level approaches (within 0.5% of price)
• False breakout detection
• Volume spike confirmations
📈 TRADING STRATEGY GUIDE
Entry Strategy
1. Wait for price to approach identified S/R level
2. Confirm with volume analysis (spike/high volume preferred)
3. Watch for wick formations indicating rejection
4. Enter on confirmed breakout with volume or bounce with rejection
Risk Management
• Use nearest S/R level for stop placement
• Scale position size based on level strength (touch count)
• Monitor volume confirmation for exit signals
Market Context
• Combine with higher timeframe trend analysis
• Consider overall market sentiment and volatility
• Use channel direction for bias confirmation
Transform complex S/R analysis into actionable trading intelligence with institutional-level insights for professional trading decisions.

TPC Strategy XAUUSD - M5 with Fixed SL/TPThis script implements a trend-following strategy for XAUUSD on the 5-minute chart, using 200 EMA and 21 EMA to filter direction. Entries are triggered based on RSI, MACD crossovers, and price action alignment. It includes fixed Stop Loss (15 pips) and Take Profit (22.5 pips) with visual SL/TP lines, BUY/SELL labels, and alert conditions for automated notifications. Designed for intraday scalping and low-risk entries during trending conditions.
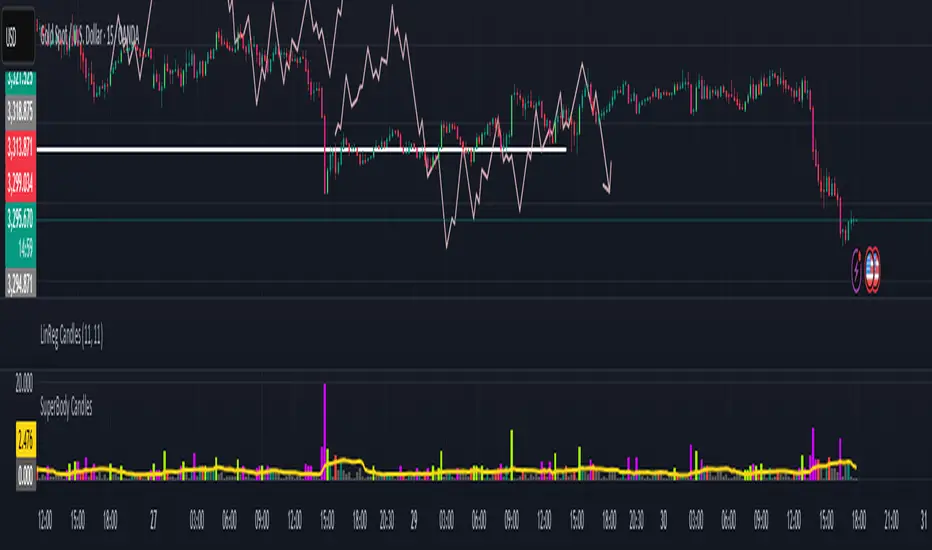
SuperBody CandlesInspired by the original script by Gautam_Dixit.
Updated to the latest Pine Script v6, now featuring fully customizable color settings so users can tailor hues to their preference.
Description:
The Momentum Candle indicator highlights bars whose real body significantly exceeds the 15-period average. 'Super' bullish and bearish candles (body ≥ 1.5× avg) receive standout colors, while above-average and below-average bars are tinted differently to reflect momentum strength.