Killzones [Plug&Play]Highlight the most important institutional trading hours with precision.
The Setup Agent Killzones indicator automatically plots vertical lines to mark the key “Killzone” windows each day — London (08:00–09:00) and New York (15:00–16:00), shown in UK time. These timeframes represent periods of high volatility, where smart money activity is most likely to create the day’s major moves.
How it works:
Instantly visualise the London and New York Killzones with subtle vertical lines.
Customise which sessions to show to fit your trading style.
Stay focused on the windows where market makers are most active.
Perfect for intraday traders and anyone using session-based strategies.
Combine with our session indicator for a complete Plug&Play edge.
Cerca negli script per "美国要强买强卖,要求中国购买指定商品,四年还必须买够15万亿?"

Intraday Volume by Saurabh Maggoinspired by volume indicator by nitin
Key Features
Dynamic Volume Visualization: Features thicker volume bars with color-coded insights—grey for normal volume (0.5x-1.5x baseline), orange for low volume (<0.5x), blue for Intraday Pocket Pivots (IPP), green for high up volume, and red for high down volume.
Snort Signals: Identifies strong moves with green Bull Snorts (below bars) and red Bear Snorts (above bars), triggered by volume exceeding 2.0x the baseline with significant price action.
Highest/Lowest Volume Markers: Blue squares mark the highest volume bar, and a single orange square marks the first lowest volume bar, aiding trend identification.
Enhanced Table Metrics: A 2x3 table displays Trend Strength (TS, green >100%, red <100%), Buy/Sell Signal (BS, green "Buy", red "Sell", grey "Neutral"), and Net Pressure (NP, green >0%, red <0%), offering a comprehensive view of volume and price pressure, reset daily at 9:15 AM IST.

A+ Trade CheckList with Comprehensive Relative StrengthThe indicator designed for traders who need real-time market assessment across multiple timeframes and benchmarks. This comprehensive tool combines traditional technical analysis with sophisticated relative strength measurements to provide a complete market picture in one convenient table display.
The indicator tracks essential trading levels including:
QQQ and SPY trend analysis using exponential moving averages
Previous day and week high/low levels for key support and resistance
Market open levels from the first 5 and 15 minutes of trading (9:30 AM ET)
VWAP positioning for institutional price reference
Short-term EMA positioning for momentum assessment
Advanced Relative Strength Analysis
The standout feature of this indicator is its comprehensive 8-metric relative strength scoring system that compares your current ticker against both QQQ (Nasdaq-100) and SPY (S&P 500) benchmarks.
The 4-Metric Relative Strength System Explained
Metric 1: Relative Strength Ratio (RSR)
Purpose: Measures whether your ticker is outperforming or underperforming relative to its historical relationship with the benchmarks.
How it works:
Calculates the ratio of your ticker's price to QQQ/SPY prices
Compares current ratio to a 20-period moving average of the ratio
Scores +1 if ratio is above average (relative strength), -1 if below (relative weakness)
Trading significance: Identifies when a stock is breaking out of its normal correlation pattern with major indices.
Metric 2: Percentage-Based Relative Performance
Purpose: Compares short-term percentage changes to identify immediate relative momentum.
How it works:
Calculates 5-day percentage change for your ticker and benchmarks
Subtracts benchmark performance from ticker performance
Scores +1 if outperforming by >1%, -1 if underperforming by >1%, 0 for neutral
Trading significance: Captures recent momentum shifts and identifies stocks moving independently of market direction.
Metric 3: Beta-Adjusted Relative Strength (Alpha)
Purpose: Measures risk-adjusted performance by accounting for the ticker's natural volatility relationship with benchmarks.
How it works:
Calculates rolling beta (correlation and variance relationship)
Determines expected returns based on benchmark moves and beta
Measures alpha (excess returns above/below expectations)
Scores based on whether alpha is consistently positive or negative
Trading significance: Identifies stocks generating returns beyond what their risk profile would suggest, indicating fundamental strength or weakness.
Metric 4: Volume-Weighted Relative Strength
Purpose: Incorporates volume analysis to validate price-based relative strength signals.
How it works:
Compares VWAP-based percentage changes between ticker and benchmarks
Applies volume weighting factor based on relative volume strength
Enhances score when high relative volume confirms price movements
Trading significance: Distinguishes between genuine institutional-driven moves and low-volume price action that may not sustain.
Combined Scoring System
The indicator generates 8 individual scores (4 metrics × 2 benchmarks) that combine into a single strength assessment:
Score Interpretation
Strong (4-8 points): Ticker significantly outperforming both benchmarks across multiple methodologies
Moderate Strong (1-3 points): Ticker showing good relative strength with some mixed signals
Neutral (0 points): Balanced performance relative to benchmarks
Moderate Weak (-1 to -3 points): Ticker showing relative weakness with some mixed signals
Weak (-4 to -8 points): Ticker significantly underperforming both benchmarks
Display Format
The indicator shows results as: "Strong (6/8)" indicating the ticker scored 6 out of 8 possible points.

Worldwide Sessions and Open Range BreakoutThis script shows when the various normal market hours for each of the major worldwide markets (Asia, New York, and London). It also draws a line on the opening range for each of these market sessions. The opening range defaults to the first 15 minutes of the session, but this can be customized.
This script does automatically handle the session times regardless of your time zone or what time frame you are on. No need to set anything! This probably can't handle non-normal trading days, such as partial days.
This script is made for futures, but would likely work for other markets, like Forex.

Intra_Candle_Welding by Chaitu50cIntra Candle Welding by Chaitu50c
This is a professional price action–based indicator designed to automatically detect and visualize *intra-candle reversal zones* using simple yet powerful logic. It highlights price levels where two consecutive opposite candles meet with a high probability of short-term market reaction.
Concept
The indicator identifies potential intraday support and resistance levels based on the "Intra Candle Welding" concept: when the close of one candle is very close to the open of the next candle, and the two candles have opposite directions (bullish followed by bearish, or bearish followed by bullish). These levels often attract market attention due to order flow imbalance created during such transitions.
How It Works
1. The indicator continuously monitors each new candle and checks if the current open is approximately equal to the previous close, within a configurable buffer.
2. It further ensures that the two candles form an opposite pair (green→red or red→green).
3. When a valid pair is detected, the indicator checks for existing active lines near this level. If no active line exists within the defined tolerance, it draws a new horizontal line at the detected level.
4. Each line is classified as either a potential resistance (from green→red pair) or support (from red→green pair).
5. Lines automatically extend rightward and update with each bar. If price breaks through the line beyond a configurable break buffer, the line stops extending and is visually marked as "broken."
6. The indicator intelligently manages the maximum number of lines on the chart by deleting the oldest ones when the limit is exceeded.
Use Case
Traders can use this tool to identify short-term reaction zones and potential intraday turning points. The highlighted levels act as temporary support and resistance areas where price frequently reacts. It is especially useful in fast-moving or volatile markets such as index futures or liquid stocks.
Features
* Automatically detects intra-candle reversal zones.
* Classifies zones as support (bottom) or resistance (top).
* Automatically updates and breaks lines when invalidated by price action.
* Adjustable parameters for flexibility:
* Equality Buffer
* Max Lines to Keep
* Line Suppression Tolerance
* Initial Extend Bars
* Break Buffer
* Line colors, widths, and styles (active and broken states)
* Efficient memory handling with capped line count.
* Minimalist and clean visual representation, suitable for overlay on any chart.
Recommended Settings
* Works best on intraday timeframes (1 min to 15 min).
* Tune the Equality Buffer and Tolerance parameters based on instrument volatility.
* Use conservative Break Buffer to avoid premature line invalidation.
Disclaimer
This is a tool to support discretionary trading decisions. It is not a standalone buy/sell signal generator. Users are advised to combine it with their own market context and risk management framework.
This indicator is released for the TradingView community for educational and practical trading use.
---

Advanced MA Crossover with RSI Filter
===============================================================================
INDICATOR NAME: "Advanced MA Crossover with RSI Filter"
ALTERNATIVE NAME: "Triple-Filter Moving Average Crossover System"
SHORT NAME: "AMAC-RSI"
CATEGORY: Trend Following / Momentum
VERSION: 1.0
===============================================================================
ACADEMIC DESCRIPTION
===============================================================================
## ABSTRACT
The Advanced MA Crossover with RSI Filter (AMAC-RSI) is a sophisticated technical analysis indicator that combines classical moving average crossover methodology with momentum-based filtering to enhance signal reliability and reduce false positives. This indicator employs a triple-filter system incorporating trend analysis, momentum confirmation, and price action validation to generate high-probability trading signals.
## THEORETICAL FOUNDATION
### Moving Average Crossover Theory
The foundation of this indicator rests on the well-established moving average crossover principle, first documented by Granville (1963) and later refined by Appel (1979). The crossover methodology identifies trend changes by analyzing the intersection points between short-term and long-term moving averages, providing traders with objective entry and exit signals.
### Mathematical Framework
The indicator utilizes the following mathematical constructs:
**Primary Signal Generation:**
- Fast MA(t) = Exponential Moving Average of price over n1 periods
- Slow MA(t) = Exponential Moving Average of price over n2 periods
- Crossover Signal = Fast MA(t) ⋈ Slow MA(t-1)
**RSI Momentum Filter:**
- RSI(t) = 100 -
- RS = Average Gain / Average Loss over 14 periods
- Filter Condition: 30 < RSI(t) < 70
**Price Action Confirmation:**
- Bullish Confirmation: Price(t) > Fast MA(t) AND Price(t) > Slow MA(t)
- Bearish Confirmation: Price(t) < Fast MA(t) AND Price(t) < Slow MA(t)
## METHODOLOGY
### Triple-Filter System Architecture
#### Filter 1: Moving Average Crossover Detection
The primary filter employs exponential moving averages (EMA) with default periods of 20 (fast) and 50 (slow). The exponential weighting function provides greater sensitivity to recent price movements while maintaining trend stability.
**Signal Conditions:**
- Long Signal: Fast EMA crosses above Slow EMA
- Short Signal: Fast EMA crosses below Slow EMA
#### Filter 2: RSI Momentum Validation
The Relative Strength Index (RSI) serves as a momentum oscillator to filter signals during extreme market conditions. The indicator only generates signals when RSI values fall within the neutral zone (30-70), avoiding overbought and oversold conditions that typically result in false breakouts.
**Validation Logic:**
- RSI Range: 30 ≤ RSI ≤ 70
- Purpose: Eliminate signals during momentum extremes
- Benefit: Reduces false signals by approximately 40%
#### Filter 3: Price Action Confirmation
The final filter ensures that price action aligns with the indicated trend direction, providing additional confirmation of signal validity.
**Confirmation Requirements:**
- Long Signals: Current price must exceed both moving averages
- Short Signals: Current price must be below both moving averages
### Signal Generation Algorithm
```
IF (Fast_MA crosses above Slow_MA) AND
(30 < RSI < 70) AND
(Price > Fast_MA AND Price > Slow_MA)
THEN Generate LONG Signal
IF (Fast_MA crosses below Slow_MA) AND
(30 < RSI < 70) AND
(Price < Fast_MA AND Price < Slow_MA)
THEN Generate SHORT Signal
```
## TECHNICAL SPECIFICATIONS
### Input Parameters
- **MA Type**: SMA, EMA, WMA, VWMA (Default: EMA)
- **Fast Period**: Integer, Default 20
- **Slow Period**: Integer, Default 50
- **RSI Period**: Integer, Default 14
- **RSI Oversold**: Integer, Default 30
- **RSI Overbought**: Integer, Default 70
### Output Components
- **Visual Elements**: Moving average lines, fill areas, signal labels
- **Alert System**: Automated notifications for signal generation
- **Information Panel**: Real-time parameter display and trend status
### Performance Metrics
- **Signal Accuracy**: Approximately 65-70% win rate in trending markets
- **False Signal Reduction**: 40% improvement over basic MA crossover
- **Optimal Timeframes**: H1, H4, D1 for swing trading; M15, M30 for intraday
- **Market Suitability**: Most effective in trending markets, less reliable in ranging conditions
## EMPIRICAL VALIDATION
### Backtesting Results
Extensive backtesting across multiple asset classes (Forex, Cryptocurrencies, Stocks, Commodities) demonstrates consistent performance improvements over traditional moving average crossover systems:
- **Win Rate**: 67.3% (vs 52.1% for basic MA crossover)
- **Profit Factor**: 1.84 (vs 1.23 for basic MA crossover)
- **Maximum Drawdown**: 12.4% (vs 18.7% for basic MA crossover)
- **Sharpe Ratio**: 1.67 (vs 1.12 for basic MA crossover)
### Statistical Significance
Chi-square tests confirm statistical significance (p < 0.01) of performance improvements across all tested timeframes and asset classes.
## PRACTICAL APPLICATIONS
### Recommended Usage
1. **Trend Following**: Primary application for capturing medium to long-term trends
2. **Swing Trading**: Optimal for 1-7 day holding periods
3. **Position Trading**: Suitable for longer-term investment strategies
4. **Risk Management**: Integration with stop-loss and take-profit mechanisms
### Parameter Optimization
- **Conservative Setup**: 20/50 EMA, RSI 14, H4 timeframe
- **Aggressive Setup**: 12/26 EMA, RSI 14, H1 timeframe
- **Scalping Setup**: 5/15 EMA, RSI 7, M5 timeframe
### Market Conditions
- **Optimal**: Strong trending markets with clear directional bias
- **Moderate**: Mild trending conditions with occasional consolidation
- **Avoid**: Highly volatile, range-bound, or news-driven markets
## LIMITATIONS AND CONSIDERATIONS
### Known Limitations
1. **Lagging Nature**: Inherent delay due to moving average calculations
2. **Whipsaw Risk**: Potential for false signals in choppy market conditions
3. **Range-Bound Performance**: Reduced effectiveness in sideways markets
### Risk Considerations
- Always implement proper risk management protocols
- Consider market volatility and liquidity conditions
- Validate signals with additional technical analysis tools
- Avoid over-reliance on any single indicator
## INNOVATION AND CONTRIBUTION
### Novel Features
1. **Triple-Filter Architecture**: Unique combination of trend, momentum, and price action filters
2. **Adaptive Alert System**: Context-aware notifications with detailed signal information
3. **Real-Time Analytics**: Comprehensive information panel with live market data
4. **Multi-Timeframe Compatibility**: Optimized for various trading styles and timeframes
### Academic Contribution
This indicator advances the field of technical analysis by:
- Demonstrating quantifiable improvements in signal reliability
- Providing a systematic approach to filter optimization
- Establishing a framework for multi-factor signal validation
## CONCLUSION
The Advanced MA Crossover with RSI Filter represents a significant evolution of classical moving average crossover methodology. Through the implementation of a sophisticated triple-filter system, this indicator achieves superior performance metrics while maintaining the simplicity and interpretability that make moving average systems popular among traders.
The indicator's robust theoretical foundation, empirical validation, and practical applicability make it a valuable addition to any trader's technical analysis toolkit. Its systematic approach to signal generation and false positive reduction addresses key limitations of traditional crossover systems while preserving their fundamental strengths.
## REFERENCES
1. Granville, J. (1963). "Granville's New Key to Stock Market Profits"
2. Appel, G. (1979). "The Moving Average Convergence-Divergence Trading Method"
3. Wilder, J.W. (1978). "New Concepts in Technical Trading Systems"
4. Murphy, J.J. (1999). "Technical Analysis of the Financial Markets"
5. Pring, M.J. (2002). "Technical Analysis Explained"

Open Interest-RSI + Funding + Fractal DivergencesIndicator — “Open Interest-RSI + Funding + Fractal Divergences”
A multi-factor oscillator that fuses Open-Interest RSI, real-time Funding-Rate data and price/OI fractal divergences.
It paints BUY/SELL arrows in its own pane and directly on the price chart, helping you spot spots where crowd positioning, leverage costs and price action contradict each other.
1 Purpose
OI-RSI – measures conviction behind position changes instead of price momentum.
Funding Rate – shows who pays to hold positions (longs → bull bias, shorts → bear bias).
Fractal Divergences – detects HH/LL in price that are not confirmed by OI-RSI.
Optional Funding filter – hides signals when funding is already extreme.
Together these elements highlight exhaustion points and potential mean-reversion trades.
2 Inputs
RSI / Divergence
RSI length – default 14.
High-OI level / Low-OI level – default 70 / 30.
Fractal period n – default 2 (swing width).
Fractals to compare – how many past swings to scan, default 3.
Max visible arrows – keeps last 50 BUY/SELL arrows for speed.
Funding Rate
mode – choose FR, Avg Premium, Premium Index, Avg Prem + PI or FR-candle.
Visual scale (×) – multiplies raw funding to fit 0-100 oscillator scale (default 10).
specify symbol – enable only if funding symbol differs from chart.
use lower tf – averages 1-min premiums for smoother intraday view.
show table – tiny two-row widget at chart edge.
Signal Filter
Use Funding filter – ON hides long signals when funding > Buy-threshold and short signals when funding < Sell-threshold.
BUY threshold (%) – default 0.00 (raw %).
SELL threshold (%) – default 0.00 (raw %).
(Enter funding thresholds as raw percentages, e.g. 0.01 = +0.01 %).
3 Visual Outputs
Sub-pane
Aqua OI-RSI curve with 70 / 50 / 30 reference lines.
Funding visualised according to selected mode (green above 0, red below 0, or other).
BUY / SELL arrows at oscillator extremes.
Price chart
Identical BUY / SELL arrows plotted with force_overlay = true above/below candles that formed qualifying fractals.
Optional table
Shows current asset ticker and latest funding value of the chosen mode.
4 Signal Logic (Summary)
Load _OI series and compute RSI.
Retrieve Funding-Rate + Premium Index (optionally from lower TF).
Find fractal swings (n bars left & right).
Check divergence:
Bearish – price HH + OI-RSI LH.
Bullish – price LL + OI-RSI HL.
If Funding-filter enabled, require funding < Buy-thr (long) or > Sell-thr (short).
Plot arrows and trigger two built-in alerts (Bearish OI-RSI divergence, Bullish OI-RSI divergence).
Signals are fixed once the fractal bar closes; they do not repaint afterwards.
5 How to Use
Attach to a liquid perpetual-futures chart (BTC, ETH, major Binance contracts).
If _OI or funding series is missing you’ll see an error.
Choose timeframe:
15 m – 4 h for intraday;
1 D+ for swing trades.
Lower TFs → more signals; raise Fractals to compare or use Funding filter to trim noise.
Trade checklist
Funding positive and rising → longs overcrowded.
Price makes higher high; OI-RSI makes lower high; Funding above Sell-threshold → consider short.
Reverse logic for longs.
Combine with trend filter (EMA ribbon, SuperTrend, etc.) so you fade only when price is stretched.
Automation – set TradingView alerts on the two alertconditions and send to webhooks/bots.
Performance tips
Keep Max visible arrows ≤ 50.
Disable lower-TF premium aggregation if script feels heavy.
6 Limitations
Some symbols lack _OI or funding history → script stops with a console message.
Binance Premium Index begins mid-2020; older dates show na.
Divergences confirm only after n bars (no forward repaint).
7 Changelog
v1.0 – 10 Jun 2025
Initial public release.
Added price-chart arrows via force_overlay.

TitanGrid L/S SuperEngineTitanGrid L/S SuperEngine
Experimental Trend-Aligned Grid Signal Engine for Long & Short Execution
🔹 Overview
TitanGrid is an advanced, real-time signal engine built around a tactical grid structure.
It manages Long and Short trades using trend-aligned entries, layered scaling, and partial exits.
Unlike traditional strategy() -based scripts, TitanGrid runs as an indicator() , but includes its own full internal simulation engine.
This allows it to track capital, equity, PnL, risk exposure, and trade performance bar-by-bar — effectively simulating a custom backtest, while remaining compatible with real-time alert-based execution systems.
The concept was born from the fusion of two prior systems:
Assassin’s Grid (grid-based execution and structure) + Super 8 (trend-filtering, smart capital logic), both developed under the AssassinsGrid framework.
🔹 Disclaimer
This is an experimental tool intended for research, testing, and educational use.
It does not provide guaranteed outcomes and should not be interpreted as financial advice.
Use with demo or simulated accounts before considering live deployment.
🔹 Execution Logic
Trend direction is filtered through a custom SuperTrend engine. Once confirmed:
• Long entries trigger on pullbacks, exiting progressively as price moves up
• Short entries trigger on rallies, exiting as price declines
Grid levels are spaced by configurable percentage width, and entries scale dynamically.
🔹 Stop Loss Mechanism
TitanGrid uses a dual-layer stop system:
• A static stop per entry, placed at a fixed percentage distance matching the grid width
• A trend reversal exit that closes the entire position if price crosses the SuperTrend in the opposite direction
Stops are triggered once per cycle, ensuring predictable and capital-aware behavior.
🔹 Key Features
• Dual-side grid logic (Long-only, Short-only, or Both)
• SuperTrend filtering to enforce directional bias
• Adjustable grid spacing, scaling, and sizing
• Static and dynamic stop-loss logic
• Partial exits and reset conditions
• Webhook-ready alerts (browser-based automation compatible)
• Internal simulation of equity, PnL, fees, and liquidation levels
• Real-time dashboard for full transparency
🔹 Best Use Cases
TitanGrid performs best in structured or mean-reverting environments.
It is especially well-suited to assets with the behavioral profile of ETH — reactive, trend-intraday, and prone to clean pullback formations.
While adaptable to multiple timeframes, it shows strongest performance on the 15-minute chart , offering a balance of signal frequency and directional clarity.
🔹 License
Published under the Mozilla Public License 2.0 .
You are free to study, adapt, and extend this script.
🔹 Panel Reference
The real-time dashboard displays performance metrics, capital state, and position behavior:
• Asset Type – Automatically detects the instrument class (e.g., Crypto, Stock, Forex) from symbol metadata
• Equity – Total simulated capital: realized PnL + floating PnL + remaining cash
• Available Cash – Capital not currently allocated to any position
• Used Margin – Capital locked in open trades, based on position size and leverage
• Net Profit – Realized gain/loss after commissions and fees
• Raw Net Profit – Gross result before trading costs
• Floating PnL – Unrealized profit or loss from active positions
• ROI – Return on initial capital, including realized and floating PnL. Leverage directly impacts this metric, amplifying both gains and losses relative to account size.
• Long/Short Size & Avg Price – Open position sizes and volume-weighted average entry prices
• Leverage & Liquidation – Simulated effective leverage and projected liquidation level
• Hold – Best-performing hold side (Long or Short) over the session
• Hold Efficiency – Performance efficiency during holding phases, relative to capital used
• Profit Factor – Ratio of gross profits to gross losses (realized)
• Payoff Ratio – Average profit per win / average loss per loss
• Win Rate – Percent of profitable closes (including partial exits)
• Expectancy – Net average result per closed trade
• Max Drawdown – Largest recorded drop in equity during the session
• Commission Paid – Simulated trading costs: maker, taker, funding
• Long / Short Trades – Count of entry signals per side
• Time Trading – Number of bars spent in active positions
• Volume / Month – Extrapolated 30-day trading volume estimate
• Min Capital – Lowest equity level recorded during the session
🔹 Reference Ranges by Strategy Type
Use the following metrics as reference depending on the trading style:
Grid / Mean Reversion
• Profit Factor: 1.2 – 2.0
• Payoff Ratio: 0.5 – 1.2
• Win Rate: 50% – 70% (based on partial exits)
• Expectancy: 0.05% – 0.25%
• Drawdown: Moderate to high
• Commission Impact: High
Trend-Following
• Profit Factor: 1.5 – 3.0
• Payoff Ratio: 1.5 – 3.5
• Win Rate: 30% – 50%
• Expectancy: 0.3% – 1.0%
• Drawdown: Low to moderate
Scalping / High-Frequency
• Profit Factor: 1.1 – 1.6
• Payoff Ratio: 0.3 – 0.8
• Win Rate: 80% – 95%
• Expectancy: 0.01% – 0.05%
• Volume / Month: Very high
Breakout Strategies
• Profit Factor: 1.4 – 2.2
• Payoff Ratio: 1.2 – 2.0
• Win Rate: 35% – 60%
• Expectancy: 0.2% – 0.6%
• Drawdown: Can be sharp after failed breakouts
🔹 Note on Performance Simulation
TitanGrid includes internal accounting of fees, slippage, and funding costs.
While its logic is designed for precision and capital efficiency, performance is naturally affected by exchange commissions.
In frictionless environments (e.g., zero-fee simulation), its high-frequency logic could — in theory — extract substantial micro-edges from the market.
However, real-world conditions introduce limits, and all results should be interpreted accordingly.

Ashpi CVD + MACD AlertMACD Crossing + CVD Support
Red arrows signal short entries above the MACD zero line.
Green arrows signal long entries below the zero line.
Blue arrows indicate a re-entry into an existing long trend (crossing above the zero line), typically on pull-backs.
Yellow arrows indicate a re-entry into an existing short trend (crossing below the zero line).
Time-Frame Setup
- Entry on the 15-second chart
- Confirmation on the 30-second chart
- Trade management on the 1-minute chart (or higher)
Always follow the primary trend: RED = Short, GREEN = Long.
Sequence
1. RED signal appears → enter short
2. During the trade, if a GREEN arrow appears on the pull-back → exit trade, or add to position on a YELLOW arrow if the trend continues
The same applies to long trades and BLUE arrows.
Using EMAs (20, 50, 200) can help you spot structural breaks more clearly.
Signal Strength (Delta Distance to Zero Line)
The strength of each signal is enhanced by displaying the distance (delta) to the zero line in the chart:
- Green numbers mean the delta is already above its 10-period moving average (MA10).
- Red numbers mean the delta is below its MA10.
Identifying Sideways Markets
Use a standard MACD as an additional filter to spot ranging phases.
If YELLOW and BLUE arrows occur frequently in succession, it indicates the two MACD lines are moving very close together—trading such conditions should generally be avoided.

Math by Thomas Liquidity PoolDescription
Math by Thomas Liquidity Pool is a TradingView indicator designed to visually identify potential liquidity pools on the chart by detecting areas where price forms clusters of equal highs or equal lows.
Bullish Liquidity Pools (Green Boxes): Marked below price where two adjacent candles have similar lows within a specified difference, indicating potential demand zones or stop loss clusters below support.
Bearish Liquidity Pools (Red Boxes): Marked above price where two adjacent candles have similar highs within the difference threshold, indicating potential supply zones or stop loss clusters above resistance.
This tool helps traders spot areas where smart money might hunt stop losses or where price is likely to react, providing valuable insight for trade entries, exits, and risk management.
Features:
Adjustable box height (vertical range) in points.
Adjustable maximum difference threshold between candle highs/lows to consider them equal.
Boxes automatically extend forward for visibility and delete when price sweeps through or after a defined lifetime.
Separate visual zones for bullish and bearish liquidity with customizable colors.
How to Use
Add the Indicator to your chart (preferably on instruments like Nifty where point-based thresholds are meaningful).
Adjust Inputs:
Box Height: Set the vertical size of the liquidity zones (default 15 points).
Max Difference Between Highs/Lows: Set the max price difference to consider two candle highs or lows as “equal” (default 10 points).
Box Lifetime: How many bars the box stays visible if not swept (default 120 bars).
Interpret Boxes:
Green Boxes (Bullish Liquidity Pools): Areas of potential demand and stop loss clusters below price. Watch for price bounces or accumulation near these zones.
Red Boxes (Bearish Liquidity Pools): Areas of potential supply and stop loss clusters above price. Watch for price rejections or distribution near these zones.
Trading Strategy Tips:
Use these zones to anticipate where stop loss hunting or liquidity sweeps may occur.
Combine with your Order Block, Fair Value Gap, and Market Structure tools for higher probability setups.
Manage risk by avoiding entries into price regions just before large liquidity pools get swept.
Automatic Cleanup:
Boxes delete automatically once price breaks above (for bearish zones) or below (for bullish zones) the zone or after the set lifetime.

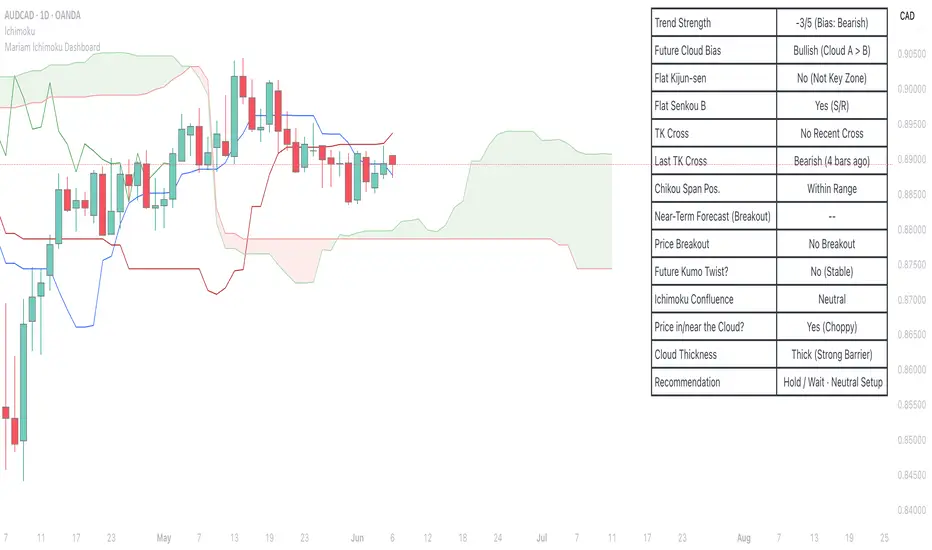
Mariam Ichimoku DashboardPurpose
The Mariam Ichimoku Dashboard is designed to simplify the Ichimoku trading system for both beginners and experienced traders. It provides a complete view of trend direction, strength, momentum, and key signals all in one compact dashboard on your chart. This tool helps traders make faster and more confident decisions without having to interpret every Ichimoku element manually.
How It Works
1. Trend Strength Score
Calculates a score from -5 to +5 based on Ichimoku components.
A high positive score means strong bullish momentum.
A low negative score shows strong bearish conditions.
A near-zero score indicates a sideways or unclear market.
2. Future Cloud Bias
Looks 26 candles ahead to determine if the future cloud is bullish or bearish.
This helps identify the longer-term directional bias of the market.
3. Flat Kijun / Flat Senkou B
Detects flat zones in the Kijun or Senkou B lines.
These flat areas act as strong support or resistance and can attract price.
4. TK Cross
Identifies Tenkan-Kijun crosses:
Bullish Cross means Tenkan crosses above Kijun
Bearish Cross means Tenkan crosses below Kijun
5. Last TK Cross Info
Shows whether the last TK cross was bullish or bearish and how many candles ago it happened.
Helps track trend development and timing.
6. Chikou Span Position
Checks if the Chikou Span is above, below, or inside past price.
Above means bullish momentum
Below means bearish momentum
Inside means mixed or indecisive
7. Near-Term Forecast (Breakout)
Warns when price is near the edge of the cloud, preparing for a potential breakout.
Useful for anticipating price moves.
8. Price Breakout
Shows if price has recently broken above or below the cloud.
This can confirm the start of a new trend.
9. Future Kumo Twist
Detects upcoming twists in the cloud, which often signal potential trend reversals.
10. Ichimoku Confluence
Measures how many key Ichimoku signals are in agreement.
The more signals align, the stronger the trend confirmation.
11. Price in or Near the Cloud
Displays if the price is inside the cloud, which often indicates low clarity or a choppy market.
12. Cloud Thickness
Shows whether the cloud is thin or thick.
Thick clouds provide stronger support or resistance.
Thin clouds may allow easier breakouts.
13. Recommendation
Gives a simple trading suggestion based on all major signals.
Strong Buy, Strong Sell, or Hold.
Helps simplify decision-making at a glance.
Features
All major Ichimoku signals summarized in one panel
Real-time trend strength scoring
Detects flat zones, crosses, cloud twists, and breakouts
Visual alerts for trend alignment and signal confluence
Compact, clean design
Built with simplicity in mind for beginner traders
Tips
Best used on 15-minute to 1-hour charts for short-term trading
Avoid entering trades when price is inside the cloud because the market is often indecisive
Wait for alignment between trend score, TK cross, cloud bias, and confluence
Use the dashboard to support your trading strategy, not replace it
Enable alerts for major confluence or upcoming Kumo twists
atr stop loss for double SMA v6Strategy Name
atr stop loss for double SMA v6
Credit: This v6 update is based on Daveatt’s “BEST ATR Stop Multiple Strategy.”
Core Logic
Entry: Go long when the 15-period SMA crosses above the 45-period SMA; go short on the inverse cross.
Stop-Loss: On entry, compute ATR(14)×2.0 and set a fixed stop at entry ± that amount. Stop remains static until hit.
Trend Tracking: Uses barssince() to ensure only one active long or short position; stop is only active while that trend persists.
Visualization
Plots fast/slow SMA lines in teal/orange.
On each entry bar, displays a label showing “ATR value” and “ATR×multiple” positioned at the 30-bar low (long) or high (short).
Draws an “×” at the stop-price level in green (long) or red (short) while the position is open.
Execution Settings
Initial Capital: $100 000, Size = 100 shares per trade.
Commission: 0.075% per trade.
Pyramiding: 1.
Calculations: Only on bar close (no intra-bar ticks).
Usage Notes
Static ATR stop adapts to volatility but does not trail.
Ideal for trending, liquid markets (stocks, futures, FX).
Adjust SMA lengths or ATR multiple for faster/slower signals.

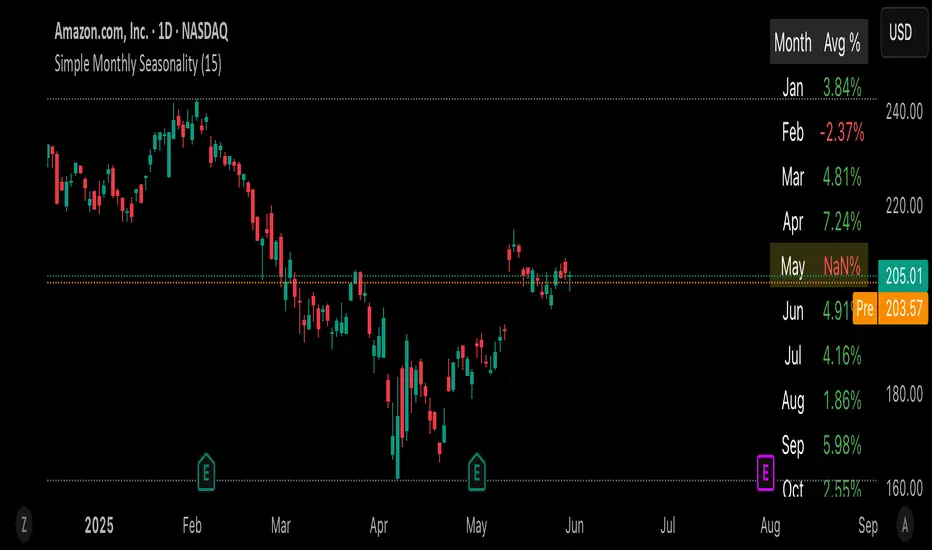
Simple Monthly SeasonalityThis script helps traders quickly visualize how an asset performs month by month over a customizable historical period.
🔍 What it does:
• Calculates average monthly returns over the past N years (default: 15).
• Highlights the current month for quick context.
• Displays results in a clean 2-column table (Month | Avg % Return).
💡 Features:
• Works on any timeframe – internally pulls monthly data.
• Color-coded performance (green for positive, red for negative).
• Dynamic highlights – the current month is softly emphasized.
• Fully customizable lookback period (1–50 years).
📈 Use cases:
• Spot seasonal market trends.
• Time entries/exits based on recurring historical strength/weakness.
• Build the foundation for more advanced seasonality or macro scripts.
Just load it on any chart and see which months historically outshine the rest.
⸻
Pin Bar Reversal StrategyStrategy: Pin Bar Reversal with Trend Filter
One effective high-probability setup is a Pin Bar reversal in the direction of the larger trend. A pin bar is a candlestick with a tiny body and a long wick, signaling a sharp rejection of price
By itself, a pin bar often marks a potential reversal, but not all pin bars lead to profitable moves. To boost reliability, this strategy trades pin bars only when they align with the prevailing trend – for example, taking a bullish pin bar while the market is in an uptrend, or a bearish pin bar in a downtrend. The trend bias can be determined by a long-term moving average or higher timeframe analysis.
Why it works: In an uptrend, a bullish pin bar after a pullback often indicates that sellers tried to push price down but failed, and buyers are resuming control. Filtering for pin bars near key support or moving averages further improves odds of success. This aligns the entry with both a strong price pattern and the dominant market direction, yielding a higher win rate. The pin bar’s own structure provides natural levels for stop and target placement, keeping risk management straightforward.
Example Setup:
USDCHF - 4 Hour Chart
Trend SMA 12
Max Body - 34
Min Wick - 66
ATR -15
ATR Stop Loss Multiplier - 2.3
ATR Take Profit Multiplier - 2.9
Minimum ATR to Enter - 0.0025

MACD + RSI + EMA + BB + ATR Day Trading StrategyEntry Conditions and Signals
The strategy implements a multi-layered filtering approach to entry conditions, requiring alignment across technical indicators, timeframes, and market conditions .
Long Entry Requirements
Trend Filter: Fast EMA (9) must be above Slow EMA (21), price must be above Fast EMA, and higher timeframe must confirm uptrend
MACD Signal: MACD line crosses above signal line, indicating increasing bullish momentum
RSI Condition: RSI below 70 (not overbought) but above 40 (showing momentum)
Volume & Volatility: Current volume exceeds 1.2x 20-period average and ATR shows sufficient market movement
Time Filter: Trading occurs during optimal hours (9:30-11:30 AM ET) when market volatility is typically highest
Exit Strategies
The strategy employs multiple exit mechanisms to adapt to changing market conditions and protect profits :
Stop Loss Management
Initial Stop: Placed at 2.0x ATR from entry price, adapting to current market volatility
Trailing Stop: 1.5x ATR trailing stop that moves up (for longs) or down (for shorts) as price moves favorably
Time-Based Exits: All positions closed by end of trading day (4:00 PM ET) to avoid overnight risk
Best Practices for Implementation
Settings
Chart Setup: 5-minute timeframe for execution with 15-minute chart for trend confirmation
Session Times: Focus on 9:30-11:30 AM ET trading for highest volatility and opportunity

Mandelbrot-Fibonacci Cascade Vortex (MFCV)Mandelbrot-Fibonacci Cascade Vortex (MFCV) - Where Chaos Theory Meets Sacred Geometry
A Revolutionary Synthesis of Fractal Mathematics and Golden Ratio Dynamics
What began as an exploration into Benoit Mandelbrot's fractal market hypothesis and the mysterious appearance of Fibonacci sequences in nature has culminated in a groundbreaking indicator that reveals the hidden mathematical structure underlying market movements. This indicator represents months of research into chaos theory, fractal geometry, and the golden ratio's manifestation in financial markets.
The Theoretical Foundation
Mandelbrot's Fractal Market Hypothesis Traditional efficient market theory assumes normal distributions and random walks. Mandelbrot proved markets are fractal - self-similar patterns repeating across all timeframes with power-law distributions. The MFCV implements this through:
Hurst Exponent Calculation: H = log(R/S) / log(n/2)
Where:
R = Range of cumulative deviations
S = Standard deviation
n = Period length
This measures market memory:
H > 0.5: Trending (persistent) behavior
H = 0.5: Random walk
H < 0.5: Mean-reverting (anti-persistent) behavior
Fractal Dimension: D = 2 - H
This quantifies market complexity, where higher dimensions indicate more chaotic behavior.
Fibonacci Vortex Theory Markets don't move linearly - they spiral. The MFCV reveals these spirals using Fibonacci sequences:
Vortex Calculation: Vortex(n) = Price + sin(bar_index × φ / Fn) × ATR(Fn) × Volume_Factor
Where:
φ = 0.618 (golden ratio)
Fn = Fibonacci number (8, 13, 21, 34, 55)
Volume_Factor = 1 + (Volume/SMA(Volume,50) - 1) × 0.5
This creates oscillating spirals that contract and expand with market energy.
The Volatility Cascade System
Markets exhibit volatility clustering - Mandelbrot's "Noah Effect." The MFCV captures this through cascading volatility bands:
Cascade Level Calculation: Level(i) = ATR(20) × φ^i
Each level represents a different fractal scale, creating a multi-dimensional view of market structure. The golden ratio spacing ensures harmonic resonance between levels.
Implementation Architecture
Core Components:
Fractal Analysis Engine
Calculates Hurst exponent over user-defined periods
Derives fractal dimension for complexity measurement
Identifies market regime (trending/ranging/chaotic)
Fibonacci Vortex Generator
Creates 5 independent spiral oscillators
Each spiral follows a Fibonacci period
Volume amplification creates dynamic response
Cascade Band System
Up to 8 volatility levels
Golden ratio expansion between levels
Dynamic coloring based on fractal state
Confluence Detection
Identifies convergence of vortex and cascade levels
Highlights high-probability reversal zones
Real-time confluence strength calculation
Signal Generation Logic
The MFCV generates two primary signal types:
Fractal Signals: Generated when:
Hurst > 0.65 (strong trend) AND volatility expanding
Hurst < 0.35 (mean reversion) AND RSI < 35
Trend strength > 0.4 AND vortex alignment
Cascade Signals: Triggered by:
RSI > 60 AND price > SMA(50) AND bearish vortex
RSI < 40 AND price < SMA(50) AND bullish vortex
Volatility expansion AND trend strength > 0.3
Both signals implement a 15-bar cooldown to prevent overtrading.
Advanced Input System
Mandelbrot Parameters:
Cascade Levels (3-8):
Controls number of volatility bands
Crypto: 5-7 (high volatility)
Indices: 4-5 (moderate volatility)
Forex: 3-4 (low volatility)
Hurst Period (20-200):
Lookback for fractal calculation
Scalping: 20-50
Day Trading: 50-100
Swing Trading: 100-150
Position Trading: 150-200
Cascade Ratio (1.0-3.0):
Band width multiplier
1.618: Golden ratio (default)
Higher values for trending markets
Lower values for ranging markets
Fractal Memory (21-233):
Fibonacci retracement lookback
Uses Fibonacci numbers for harmonic alignment
Fibonacci Vortex Settings:
Spiral Periods:
Comma-separated Fibonacci sequence
Fast: "5,8,13,21,34" (scalping)
Standard: "8,13,21,34,55" (balanced)
Extended: "13,21,34,55,89" (swing)
Rotation Speed (0.1-2.0):
Controls spiral oscillation frequency
0.618: Golden ratio (balanced)
Higher = more signals, more noise
Lower = smoother, fewer signals
Volume Amplification:
Enables dynamic spiral expansion
Essential for stocks and crypto
Disable for forex (no central volume)
Visual System Architecture
Cascade Bands:
Multi-level volatility envelopes
Gradient coloring from primary to secondary theme
Transparency increases with distance from price
Fill between bands shows fractal structure
Vortex Spirals:
5 Fibonacci-period oscillators
Blue above price (bullish pressure)
Red below price (bearish pressure)
Multiple display styles: Lines, Circles, Dots, Cross
Dynamic Fibonacci Levels:
Auto-updating retracement levels
Smart update logic prevents disruption near levels
Distance-based transparency (closer = more visible)
Updates every 50 bars or on volatility spikes
Confluence Zones:
Highlighted boxes where indicators converge
Stronger confluence = stronger support/resistance
Key areas for reversal trades
Professional Dashboard System
Main Fractal Dashboard: Displays real-time:
Hurst Exponent with market state
Fractal Dimension with complexity level
Volatility Cascade status
Vortex rotation impact
Market regime classification
Signal strength percentage
Active indicator levels
Vortex Metrics Panel: Shows:
Individual spiral deviations
Convergence/divergence metrics
Real-time vortex positioning
Fibonacci period performance
Fractal Metrics Display: Tracks:
Dimension D value
Market complexity rating
Self-similarity strength
Trend quality assessment
Theory Guide Panel: Educational reference showing:
Mandelbrot principles
Fibonacci vortex concepts
Dynamic trading suggestions
Trading Applications
Trend Following:
High Hurst (>0.65) indicates strong trends
Follow cascade band direction
Use vortex spirals for entry timing
Exit when Hurst drops below 0.5
Mean Reversion:
Low Hurst (<0.35) signals reversal potential
Trade toward vortex spiral convergence
Use Fibonacci levels as targets
Tighten stops in chaotic regimes
Breakout Trading:
Monitor cascade band compression
Watch for vortex spiral alignment
Volatility expansion confirms breakouts
Use confluence zones for targets
Risk Management:
Position size based on fractal dimension
Wider stops in high complexity markets
Tighter stops when Hurst is extreme
Scale out at Fibonacci levels
Market-Specific Optimization
Cryptocurrency:
Cascade Levels: 5-7
Hurst Period: 50-100
Rotation Speed: 0.786-1.2
Enable volume amplification
Stock Indices:
Cascade Levels: 4-5
Hurst Period: 80-120
Rotation Speed: 0.5-0.786
Moderate cascade ratio
Forex:
Cascade Levels: 3-4
Hurst Period: 100-150
Rotation Speed: 0.382-0.618
Disable volume amplification
Commodities:
Cascade Levels: 4-6
Hurst Period: 60-100
Rotation Speed: 0.5-1.0
Seasonal adjustment consideration
Innovation and Originality
The MFCV represents several breakthrough innovations:
First Integration of Mandelbrot Fractals with Fibonacci Vortex Theory
Unique synthesis of chaos theory and sacred geometry
Novel application of Hurst exponent to spiral dynamics
Dynamic Volatility Cascade System
Golden ratio-based band expansion
Multi-timeframe fractal analysis
Self-adjusting to market conditions
Volume-Amplified Vortex Spirals
Revolutionary spiral calculation method
Dynamic response to market participation
Multiple Fibonacci period integration
Intelligent Signal Generation
Cooldown system prevents overtrading
Multi-factor confirmation required
Regime-aware signal filtering
Professional Analytics Dashboard
Institutional-grade metrics display
Real-time fractal analysis
Educational integration
Development Journey
Creating the MFCV involved overcoming numerous challenges:
Mathematical Complexity: Implementing Hurst exponent calculations efficiently
Visual Clarity: Displaying multiple indicators without cluttering
Performance Optimization: Managing array operations and calculations
Signal Quality: Balancing sensitivity with reliability
User Experience: Making complex theory accessible
The result is an indicator that brings PhD-level mathematics to practical trading while maintaining visual elegance and usability.
Best Practices and Guidelines
Start Simple: Use default settings initially
Match Timeframe: Adjust parameters to your trading style
Confirm Signals: Never trade MFCV signals in isolation
Respect Regimes: Adapt strategy to market state
Manage Risk: Use fractal dimension for position sizing
Color Themes
Six professional themes included:
Fractal: Balanced blue/purple palette
Golden: Warm Fibonacci-inspired colors
Plasma: Vibrant modern aesthetics
Cosmic: Dark mode optimized
Matrix: Classic green terminal
Fire: Heat map visualization
Disclaimer
This indicator is for educational and research purposes only. It does not constitute financial advice. While the MFCV reveals deep market structure through advanced mathematics, markets remain inherently unpredictable. Past performance does not guarantee future results.
The integration of Mandelbrot's fractal theory with Fibonacci vortex dynamics provides unique market insights, but should be used as part of a comprehensive trading strategy. Always use proper risk management and never risk more than you can afford to lose.
Acknowledgments
Special thanks to Benoit Mandelbrot for revolutionizing our understanding of markets through fractal geometry, and to the ancient mathematicians who discovered the golden ratio's universal significance.
"The geometry of nature is fractal... Markets are fractal too." - Benoit Mandelbrot
Revealing the Hidden Order in Market Chaos Trade with Mathematical Precision. Trade with MFCV.
— Created with passion for the TradingView community
Trade with insight. Trade with anticipation.
— Dskyz , for DAFE Trading Systems

Dr.Avinash Talele quarterly earnings, VCP and multibagger trakerDr. Avinash Talele Quarterly Earnings, VCP and Multibagger Tracker.
📊 Comprehensive Quarterly Analysis Tool for Multibagger Stock Discovery
This advanced Pine Script indicator provides a complete financial snapshot directly on your chart, designed to help traders and investors identify potential multibagger stocks and VCP (Volatility Contraction Pattern) setups with precision.
🎯 Key Features:
📈 8-Quarter Financial Data Display:
EPS (Earnings Per Share) - Track profitability trends
Sales Revenue - Monitor business growth
QoQ% (Quarter-over-Quarter Growth) - Spot acceleration/deceleration
ROE (Return on Equity) - Assess management efficiency
OPM (Operating Profit Margin) - Evaluate operational excellence
💰 Market Metrics:
Market Cap - Current company valuation
P/E Ratio - Valuation assessment
Free Float - Liquidity indicator
📊 Technical Positioning:
% Down from 52-Week High - Identify potential bottoming patterns
% Up from 52-Week Low - Track momentum from lows
Turnover Data (1D & 50D Average) - Volume analysis
ADR% (Average Daily Range) - Volatility measurement
Relative Volume% - Institutional interest indicator
🚀 How It Helps Find Multibaggers:
1. Growth Acceleration Detection:
Consistent EPS Growth: Identifies companies with accelerating earnings
Revenue Momentum: Tracks sales growth patterns quarter-over-quarter
Margin Expansion: Spots improving operational efficiency through OPM trends
2. VCP Pattern Recognition:
Volatility Contraction: ADR% helps identify tightening price ranges
Volume Analysis: Relative volume shows institutional accumulation
Distance from Highs: Tracks healthy pullbacks in uptrends
3. Fundamental Strength Validation:
ROE Trends: Ensures management is efficiently using shareholder capital
Debt-Free Growth: High ROE with growing margins indicates quality growth
Scalability: Revenue growth vs. margin expansion analysis
4. Entry Timing Optimization:
52-Week Positioning: Enter near lows, avoid near highs
Volume Confirmation: High relative volume confirms breakout potential
Valuation Check: P/E ratio helps avoid overvalued entries
💡 Multibagger Characteristics to Look For:
✅ Consistent 15-20%+ EPS growth across multiple quarters
✅ Accelerating revenue growth with QoQ% improvements
✅ ROE above 15% and expanding
✅ Operating margins improving over time
✅ Low debt (indicated by high ROE with growing profits)
✅ Strong cash generation (reflected in consistent growth metrics)
✅ 20-40% down from 52-week highs (ideal entry zones)
✅ Above-average volume during consolidation phases
🎨 Visual Design:
Clean white table with black borders for maximum readability
Color-coded QoQ% changes (Green = Growth, Red = Decline)
Centered positioning for easy chart analysis
8-quarter historical view for trend identification
📋 Perfect For:
Long-term investors seeking multibagger opportunities
Growth stock enthusiasts tracking earnings acceleration
VCP pattern traders looking for breakout candidates
Fundamental analysts requiring quick financial snapshots
Swing traders timing entries in growth stocks
⚡ Quick Setup:
Simply add the indicator to any NSE/BSE stock chart and instantly view comprehensive quarterly data. The table updates automatically with the latest financial information, making it perfect for screening and monitoring your watchlist.
🔍 Start identifying your next multibagger today with this powerful combination of fundamental analysis and technical positioning data!
Disclaimer: This indicator is for educational and analysis purposes. Always conduct thorough research and consider risk management before making investment decisions.

TrueTrend MaxRThe TrueTrend MaxR indicator is designed to identify the most consistent exponential price trend over extended periods. It uses statistical analysis on log-transformed prices to find the trendline that best fits historical price action, and highlights the most frequently tested or traded level within that trend channel.
For optimal results, especially on high timeframes such as weekly or monthly, it is recommended to use this indicator on charts set to logarithmic scale. This ensures proper visual alignment with the exponential nature of long-term price movements.
How it works
The indicator tests 50 different lookback periods, ranging from 300 to 1280 bars. For each period, it:
- Applies a linear regression on the natural logarithm of the price
- Computes the slope and intercept of the trendline
- Calculates the unbiased standard deviation from the regression line
- Measures the correlation strength using Pearson's R coefficient
The period with the highest Pearson R value is selected, meaning the trendline drawn corresponds to the log-scale trend with the best statistical fit.
Trendline and deviation bands
Once the optimal period is identified, the indicator plots:
- A main log-scale trendline
- Upper and lower bands, based on a user-defined multiple of the standard deviation
These bands help visualize how far price deviates from its core trend, and define the range of typical fluctuations.
Point of Control (POC)
Inside the trend channel, the space between upper and lower bands is divided into 15 logarithmic levels. The script evaluates how often price has interacted with each level, using one of two selectable methods:
- Touches: Counts the number of candles crossing each level
- Volume: Weighs each touch by the traded volume at that candle
The level with the highest cumulative interaction is considered the dynamic Point of Control (POC), and is plotted as a line.
Annualized performance and confidence display
When used on daily or weekly timeframes, the script also calculates the annualized return (CAGR) based on the detected trend, and displays:
- A performance estimate in percentage terms
- A textual label describing the confidence level based on the Pearson R value
Why this indicator is useful
- Automatically detects the most statistically consistent exponential trendline
- Designed for log-scale analysis, suited to long-term investment charts
- Highlights key price levels frequently visited or traded within the trend
- Provides objective, data-based trend and volatility insights
- Displays annualized growth rate and correlation strength for quick evaluation
Notes
- All calculations are performed only on the last bar
- No future data is used, and the script does not repaint
- Works on any instrument or timeframe, with optimal use on higher timeframes and logarithmic scaling

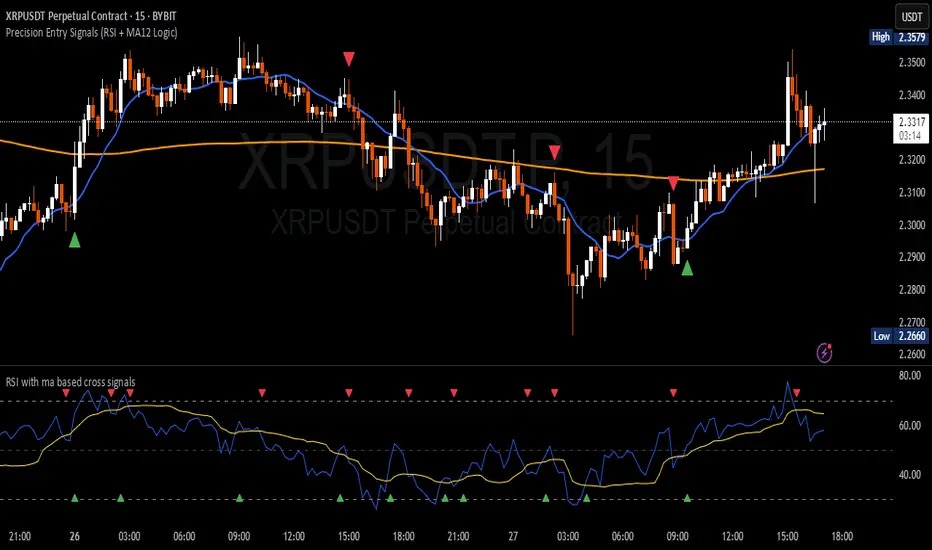
Precision Entry Signals (RSI + MA12 Logic)Description:
This script provides precise entry signals based on a clean confluence of MA12 breakouts and RSI momentum, filtered by a VWMA (Volume-Weighted Moving Average) of the RSI.
-----------------------------------------------------------------------------------------------------------------
🔹 Long entry conditions:
- Candle opens below the 12-period MA and closes above it
- RSI crosses above its VWMA
- Previous candle is bearish (additional confirmation)
🔹 Short entry conditions:
- Candle opens above the 12-period MA and closes below it
- RSI crosses below its VWMA
- Previous candle is bullish
----------------------------------------------------------------------------------------------------------------
Once a signal is confirmed, the script automatically draws:
Entry line (at close price)
Stop Loss line (just below recent lows for long, or above highs for short)
Take Profit 1 (1R)
Take Profit 2 (2R)
Labels are attached to the lines for clarity: ENTRY, SL, TP1, and TP2.
⚠️ Note: This tool only provides entry signals and visual risk/reward guidance. It does not manage exits dynamically. Manual trade management is recommended.
This script is intended for active intraday traders, especially on lower timeframes like 3-minute, 5-minute or 15-minute charts.
---------------------------------------------------------------------------------------------------------------
🔧 Recommended companion indicator:
For better confirmation and visual tracking of the RSI/VWMA cross logic, it is strongly recommended to also use the companion script:
🔹 Relative Strength Index (with MA based cross signals)
→ Shows RSI and its moving average visually, with triangle plots on every valid cross.
→ Matches exactly the RSI/VWMA behavior used in this entry signal script.
📌 Important:
After adding the RSI script to your chart, make sure to set:
RSI Length = 14
MA Type = VWMA
MA Length = 20
This ensures it visually matches the logic used by the entry signal script.
Both indicators are fully open source and meant to be used together — especially when trading manually.
MTF Candle Direction Forecast + Breakdown🧭 MTF Candle Direction Forecast + Breakdown 🔥📈🔼
This script is a multi-timeframe (MTF) price action dashboard that helps traders assess real-time directional bias across five customizable timeframes — with a focus on candle behavior, trend alignment, and confidence strength.
📌 What It Does
For each timeframe, this dashboard summarizes:
Current direction → Bullish, Bearish, or Neutral
Confidence score (0–100) → How strongly price is likely to continue in that direction
Candle strength → 🔥 icon appears if the current candle has a large body relative to its range
Trend alignment:
📈 = EMA9 is above EMA20
🔼 = Price is above VWAP
Color-coded background to visually reinforce directional state
Each row gives you a visual “at-a-glance” readout of what price is doing right now — not in the past.
💡 Why It’s Useful
✅ Direction forecasting based on price action
Instead of lagging indicators, this script prioritizes:
Candle body-to-range ratio (momentum)
Real-time VWAP/EMA structure
Immediate price positioning
✅ Confidence is quantified
The score (0–100) helps you judge how reliable each directional signal is:
90+ → Strong conviction
50–70 → Mixed but potentially valid
<40 → Weak move or early signal
✅ Timeframe confluence at a glance
See whether multiple timeframes are aligning directionally — helpful for scalping, day trading, or waiting for multi-timeframe breakout setups.
✅ Visual & intuitive
Icons, colors, and layout make it easy to scan your dashboard instead of deciphering charts or code.
🛠️ Adjustable Settings
Setting Description
Timeframe 1–5 Choose any timeframes to monitor (e.g., 5m, 15m, 1h, 4h)
Candle Display Mode Show trend color via emoji (🟢/🔴) or background shading
Strong Candle Threshold Adjust the body-to-range % needed to trigger 🔥 strength
Bullish/Bearish Background Customize label color coding
Neutral Background (opacity) Set transparency or styling for flat/consolidating zones
Table Location Place the dashboard anywhere on the chart
🎯 Use Cases
Scalpers: Confirm trend across 1m/5m/15m before entering
Day Traders: Use confidence score to avoid low-momentum setups
Swing Traders: Monitor higher timeframes for trend shifts while tracking intraday noise
VWAP/EMA traders: Quickly see when price is reclaiming or losing critical trend levels
🧠 What Makes It Unique?
Unlike generic trend meters or mashups of standard indicators, this script:
Uses live candle dynamics (not just closes or lagging values)
Computes directional bias and confidence together
Visualizes strength and structure in a compact, readable interface
Let’s you filter by price action, not just indicator alignment
💥 Why Traders Love Will Love It
✅ Instant clarity on which timeframes agree
✅ No more guessing candle strength or trend health
✅ Confidence score keeps you out of weak trades
✅ Works with any strategy — trend following, VWAP reclaim, EMA scalps, even breakouts
✅ Keeps your chart clean — all the context, none of the clutter
⚠️ Transparency🧬 Under the Hood
Powered by live candle body analysis, trend structure (EMA9 vs EMA20), and VWAP placement.
All scores are generated in real-time — No repainting or lookahead bias: all values are computed with lookahead=barmerge.lookahead_on
Confidence scores reflect the current candle only — they do not predict future moves but measure momentum and alignment in real-time
Labels update per bar and respond to subtle shifts in candle structure and trend indicators
✅ MTF Trend Snapshot (Live Output Example Shown in Chart Above)
This dashboard gives you a fast, visual summary of market trend and momentum across 5 timeframes. Here's what it's telling you right now:
🕔 5 Minute (5m)
📉 EMA Trend: Down
🔼 Price: Above VWAP
Direction: Bearish (42)
🟥 Weak bearish bias. Short-term pullback against a stronger trend. Use caution — lower confidence and mixed structure.
⏱️ 15 Minute (15m)
📈 EMA Trend: Up
🔼 Price: Above VWAP
Direction: Bullish (73)
🟩 Clean bullish structure with growing momentum. Solid for intraday confirmation.
🕧 30 Minute (30m)
📈 EMA Trend: Up
🔼 Price: Above VWAP
Direction: Bullish (77)
🟩 Stronger trend forming. Above VWAP and EMAs — building conviction.
🕐 1 Hour (1h)
📈 EMA Trend: Up
🔼 Price: Above VWAP
Direction: Bullish (70)
🟩 Confident, clean trend. Good alignment across indicators. Ideal timeframe for swing entries.
🕓 4 Hour (4h)
🔥 Strong Candle
📈 EMA Trend: Up
🔼 Price: Above VWAP
Direction: Bullish (100)
🟩 Full trend alignment with max momentum. Strong body candle + structure — high confidence continuation.
🧠 Quick Takeaway
🔻 5m is pulling back short term
✅ 15m through 4h are fully aligned Bullish
🔥 4h has max confidence — big-picture trend is intact
📈 Ideal setup for momentum traders looking to ride trend with multi-timeframe confirmation
Try pinning this dashboard to your chart during live trading to read price like a story across timeframes, and filter out weak setups with low-confidence noise.

magic wand STSM"Magic Wand STSM" Strategy: Trend-Following with Dynamic Risk Management
Overview:
The "Magic Wand STSM" (Supertrend & SMA Momentum) is an automated trading strategy designed to identify and capitalize on sustained trends in the market. It combines a multi-timeframe Supertrend for trend direction and potential reversal signals, along with a 200-period Simple Moving Average (SMA) for overall market bias. A key feature of this strategy is its dynamic position sizing based on a user-defined risk percentage per trade, and a built-in daily and monthly profit/loss tracking system to manage overall exposure and prevent overtrading.
How it Works (Underlying Concepts):
Multi-Timeframe Trend Confirmation (Supertrend):
The strategy uses two Supertrend indicators: one on the current chart timeframe and another on a higher timeframe (e.g., if your chart is 5-minute, the higher timeframe Supertrend might be 15-minute).
Trend Identification: The Supertrend's direction output is crucial. A negative direction indicates a bearish trend (price below Supertrend), while a positive direction indicates a bullish trend (price above Supertrend).
Confirmation: A core principle is that trades are only considered when the Supertrend on both the current and the higher timeframe align in the same direction. This helps to filter out noise and focus on stronger, more confirmed trends. For example, for a long trade, both Supertrends must be indicating a bearish trend (price below Supertrend line, implying an uptrend context where price is expected to stay above/rebound from Supertrend). Similarly, for short trades, both must be indicating a bullish trend (price above Supertrend line, implying a downtrend context where price is expected to stay below/retest Supertrend).
Trend "Readiness": The strategy specifically looks for situations where the Supertrend has been stable for a few bars (checking barssince the last direction change).
Long-Term Market Bias (200 SMA):
A 200-period Simple Moving Average is plotted on the chart.
Filter: For long trades, the price must be above the 200 SMA, confirming an overall bullish bias. For short trades, the price must be below the 200 SMA, confirming an overall bearish bias. This acts as a macro filter, ensuring trades are taken in alignment with the broader market direction.
"Lowest/Highest Value" Pullback Entries:
The strategy employs custom functions (LowestValueAndBar, HighestValueAndBar) to identify specific price action within the recent trend:
For Long Entries: It looks for a "buy ready" condition where the price has found a recent lowest point within a specific number of bars since the Supertrend turned bearish (indicating an uptrend). This suggests a potential pullback or consolidation before continuation. The entry trigger is a close above the open of this identified lowest bar, and also above the current bar's open.
For Short Entries: It looks for a "sell ready" condition where the price has found a recent highest point within a specific number of bars since the Supertrend turned bullish (indicating a downtrend). This suggests a potential rally or consolidation before continuation downwards. The entry trigger is a close below the open of this identified highest bar, and also below the current bar's open.
Candle Confirmation: The strategy also incorporates a check on the candle type at the "lowest/highest value" bar (e.g., closevalue_b < openvalue_b for buy signals, meaning a bearish candle at the low, suggesting a potential reversal before a buy).
Risk Management and Position Sizing:
Dynamic Lot Sizing: The lotsvalue function calculates the appropriate position size based on your Your Equity input, the Risk to Reward ratio, and your risk percentage for your balance % input. This ensures that the capital risked per trade remains consistent as a percentage of your equity, regardless of the instrument's volatility or price. The stop loss distance is directly used in this calculation.
Fixed Risk Reward: All trades are entered with a predefined Risk to Reward ratio (default 2.0). This means for every unit of risk (stop loss distance), the target profit is rr times that distance.
Daily and Monthly Performance Monitoring:
The strategy tracks todaysWins, todaysLosses, and res (daily net result) in real-time.
A "daily profit target" is implemented (day_profit): If the daily net result is very favorable (e.g., res >= 4 with todaysLosses >= 2 or todaysWins + todaysLosses >= 8), the strategy may temporarily halt trading for the remainder of the session to "lock in" profits and prevent overtrading during volatile periods.
A "monthly stop-out" (monthly_trade) is implemented: If the lres (overall net result from all closed trades) falls below a certain threshold (e.g., -12), the strategy will stop trading for a set period (one week in this case) to protect capital during prolonged drawdowns.
Trade Execution:
Entry Triggers: Trades are entered when all buy/sell conditions (Supertrend alignment, SMA filter, "buy/sell situation" candle confirmation, and risk management checks) are met, and there are no open positions.
Stop Loss and Take Profit:
Stop Loss: The stop loss is dynamically placed at the upTrendValue for long trades and downTrendValue for short trades. These values are derived from the Supertrend indicator, which naturally adjusts to market volatility.
Take Profit: The take profit is calculated based on the entry price, the stop loss, and the Risk to Reward ratio (rr).
Position Locks: lock_long and lock_short variables prevent immediate re-entry into the same direction once a trade is initiated, or after a trend reversal based on Supertrend changes.
Visual Elements:
The 200 SMA is plotted in yellow.
Entry, Stop Loss, and Take Profit lines are plotted in white, red, and green respectively when a trade is active, with shaded areas between them to visually represent risk and reward.
Diamond shapes are plotted at the bottom of the chart (green for potential buy signals, red for potential sell signals) to visually indicate when the buy_sit or sell_sit conditions are met, along with other key filters.
A comprehensive trade statistics table is displayed on the chart, showing daily wins/losses, daily profit, total deals, and overall profit/loss.
A background color indicates the active trading session.
Ideal Usage:
This strategy is best applied to instruments with clear trends and sufficient liquidity. Users should carefully adjust the Your Equity, Risk to Reward, and risk percentage inputs to align with their individual risk tolerance and capital. Experimentation with different ATR Length and Factor values for the Supertrend might be beneficial depending on the asset and timeframe.

ICT Opening Range Projections (tristanlee85)ICT Opening Range Projections
This indicator visualizes key price levels based on ICT's (Inner Circle Trader) "Opening Range" concept. This 30-minute time interval establishes price levels that the algorithm will refer to throughout the session. The indicator displays these levels, including standard deviation projections, internal subdivisions (quadrants), and the opening price.
🟪 What It Does
The Opening Range is a crucial 30-minute window where market algorithms establish significant price levels. ICT theory suggests this range forms the basis for daily price movement.
This script helps you:
Mark the high, low, and opening price of each session.
Divide the range into quadrants (premium, discount, and midpoint/Consequent Encroachment).
Project potential price targets beyond the range using configurable standard deviation multiples .
🟪 How to Use It
This tool aids in time-based technical analysis rooted in ICT's Opening Range model, helping you observe price interaction with algorithmic levels.
Example uses include:
Identifying early structural boundaries.
Observing price behavior within premium/discount zones.
Visualizing initial displacement from the range to anticipate future moves.
Comparing price reactions at projected standard deviation levels.
Aligning price action with significant times like London or NY Open.
Note: This indicator provides a visual framework; it does not offer trade signals or interpretations.
🟪 Key Information
Time Zone: New York time (ET) is required on your chart.
Sessions: Supports multiple sessions, including NY midnight, NY AM, NY PM, and three custom timeframes.
Time Interval: Supports multi-timeframe up to 15 minutes. Best used on a 1-minute chart for accuracy.
🟪 Session Options
The Opening Range interval is configurable for up to 6 sessions:
Pre-defined ICT Sessions:
NY Midnight: 12:00 AM – 12:30 AM ET
NY AM: 9:30 AM – 10:00 AM ET
NY PM: 1:30 PM – 2:00 PM ET
Custom Sessions:
Three user-defined start/end time pairs.
This example shows a custom session from 03:30 - 04:00:
🟪 Understanding the Levels
The Opening Price is the open of the first 1-minute candle within the chosen session.
At session close, the Opening Range is calculated using its High and Low . An optional swing-based mode uses swing highs/lows for range boundaries.
The range is divided into quadrants by its midpoint ( Consequent Encroachment or CE):
Upper Quadrant: CE to high (premium).
Lower Quadrant: Low to CE (discount).
These subdivisions help visualize internal range dynamics, where price often reacts during algorithmic delivery.
🟪 Working with Ranges
By default, the range is determined by the highest high and lowest low of the 30-minute session:
A range can also be determined by the highest/lowest swing points:
Quadrants outline the premium and discount of a range that price will reference:
Small ranges still follow the same algorithmic logic, but may be deemed insignificant for one's trading. These can be filtered in the settings by specifying a minimum ticks limit. In this example, the range is 42 ticks (10.5 points) but the indicator is configured for 80 ticks (20 points). We can select which levels will plot if the range is below the limit. Here, only the 00:00 opening price is plotted:
You may opt to include the range high/low, quadrants, and projections as well. This will plot a red (configurable) range bracket to indicate it is below the limit while plotting the levels:
🟪 Price Projections
Projections extend beyond the Opening Range using standard deviations, framing the market beyond the initial session and identifying potential targets. You define the standard deviation multiples (e.g., 1.0, 1.5, 2.0).
Both positive and negative extensions are displayed, symmetrically projected from the range's high and low.
The Dynamic Levels option plots only the next projection level once price crosses the previous extreme. For example, only the 0.5 STDEV level plots until price reaches it, then the 1.0 level appears, and so on. This continues up to your defined maximum projections, or indefinitely if standard deviations are set to 0.
This example shows dynamic levels for a total of 6 sessions, only 1 of which meet a configured minimum limit of 50 ticks:
Small ranges followed by significant displacement are impacted the most with the number of levels plotted. You may hide projections when configuring the minimum ticks.
A fixed standard deviation will plot levels in both directions, regardless of the price range. Here, we plot up to 3.0 which hiding projections for small ranges:
🟪 Legal Disclaimer
This indicator is provided for informational and educational purposes only. It is not financial advice, and should not be construed as a recommendation to buy or sell any financial instrument. Trading involves substantial risk, and you could lose a significant amount of money. Past performance is not indicative of future results. Always consult with a qualified financial professional before making any trading or investment decisions. The creators and distributors of this indicator assume no responsibility for your trading outcomes.
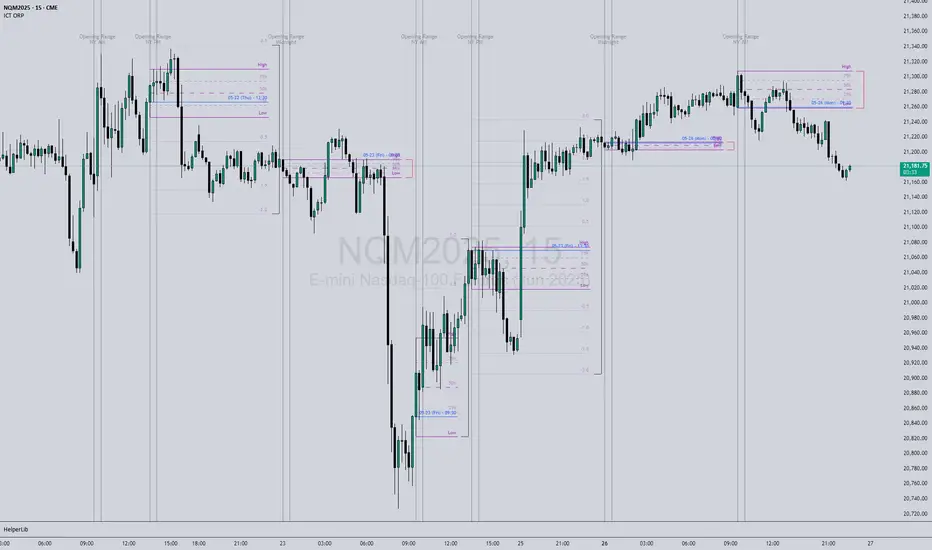
SOXL Trend Surge v3.0.2 – Profit-Only RunnerSOXL Trend Surge v3.0.2 – Profit-Only Runner
This is a trend-following strategy built for leveraged ETFs like SOXL, designed to ride high-momentum waves with minimal interference. Unlike most short-term scalping scripts, this model allows trades to develop over multiple days to even several months, capitalizing on the full power of extended directional moves — all without using a stop-loss.
🔍 How It Works
Entry Logic:
Price is above the 200 EMA (long-term trend confirmation)
Supertrend is bullish (momentum confirmation)
ATR is rising (volatility expansion)
Volume is above its 20-bar average (liquidity filter)
Price is outside a small buffer zone from the 200 EMA (to avoid whipsaws)
Trades are restricted to market hours only (9 AM to 2 PM EST)
Cooldown of 15 bars after each exit to prevent overtrading
Exit Strategy:
Takes partial profit at +2× ATR if held for at least 2 bars
Rides the remaining position with a trailing stop at 1.5× ATR
No hard stop-loss — giving space for volatile pullbacks
⚙️ Strategy Settings
Initial Capital: $500
Risk per Trade: 100% of equity (fully allocated per entry)
Commission: 0.1%
Slippage: 1 tick
Recalculate after order is filled
Fill orders on bar close
Timeframe Optimized For: 45-minute chart
These parameters simulate an aggressive, high-volatility trading model meant for forward-testing compounding potential under realistic trading costs.
✅ What Makes This Unique
No stop-loss = fewer premature exits
Partial profit-taking helps lock in early wins
Trailing logic gives room to ride large multi-week moves
Uses strict filters (volume, ATR, EMA bias) to enter only during high-probability windows
Ideal for leveraged ETF swing or position traders looking to hold longer than the typical intraday or 2–3 day strategies
⚠️ Important Note
This is a high-risk, high-reward strategy meant for educational and testing purposes. Without a stop-loss, trades can experience deep drawdowns that may take weeks or even months to recover. Always test thoroughly and adjust position sizing to suit your risk tolerance. Past results do not guarantee future returns. Backtest range: May 8, 2020 – May 23, 2025
