Impulse Volume Oscillator [Alpha Extract]Impulse Volume Oscillator
A sophisticated indicator designed to identify market impulse moves and volume-based momentum shifts, helping traders capture significant price movements with precision.
Combining price deviations with volume analysis, this oscillator dynamically measures market strength and weakness, providing clear signals for potential trend continuations and reversals.
🔶 Volume-Adjusted Normalization
Utilizes a unique normalization technique that incorporates volume impact to enhance signal quality. This approach ensures the indicator responds more strongly to high-volume price movements while filtering out low-volume noise.
vol_ratio = ta.rsi(volume, 14) / 50
vol_factor = vol_impact > 0 ? 1 + (vol_ratio - 1) * vol_impact : 1
raw_normalized = dev / (ta.stdev(source, bars) * mult)
vol_adjusted = raw_normalized * vol_factor
normalized = ta.sma(vol_adjusted, smooth)
🔶 Adaptive Regime Detection
Incorporates threshold-based regime identification that clearly distinguishes between trending and mean-reverting market conditions. The customizable threshold system allows traders to adapt to different market volatilities and timeframes.
🔶 Customizable Parameters
Fine-tune detection sensitivity with adjustable inputs for lookback period, standard deviation multiplier, volume impact, and signal smoothing. These parameters enable traders to optimize the indicator for various trading styles and market conditions.
❓How It Works
🔶 Impulse Calculation
The oscillator measures price deviation from a moving average baseline, normalized by standard deviation, and then adjusts the signal based on relative volume strength. This creates a responsive yet stable indicator that accurately reflects market momentum.
// Calculate the basis using the selected MA
basis = get_ma(source, bars)
// Calculate the normalized value with volume impact
dev = source - basis
🔶 Dynamic Visualization
The histogram changes color based on signal strength, providing instant visual cues about market conditions. Green bars indicate positive momentum while red bars represent negative momentum, with color intensity reflecting signal strength.
🔶 Trend Confirmation
Built-in trend direction analysis provides confluence with the primary signal, helping traders distinguish between counter-trend bounces and genuine trend reversals. This dual-confirmation approach significantly reduces false signals.
🔶 Visual Alerts & Boundary Tracking
Monitors signal extremes and dynamically adjusts visualization transparency based on signal strength. The indicator highlights particularly strong impulse moves with background shading, making potential trading opportunities immediately apparent.
🔶 Custom Candle Coloring
Optional candle coloring applies the same color logic as the histogram directly to price candles, providing a unified visual framework that helps traders correlate indicator signals with price action.
🔶 Momentum Shift Detection
Automatically identifies important zero-line crossovers that often signify the beginning of new impulse moves. These transition points frequently offer favorable risk/reward entry opportunities.
🔶 Snapshot samples
1 Week
1 Day
15 Min
🔶 Why Choose AE - Impulse Volume Oscillator?
This indicator provides a comprehensive approach to identifying significant market moves by combining volume analysis with price momentum. By offering clear visual signals for both trend continuation and reversal scenarios, it empowers traders to make more informed decisions across various market conditions and timeframes.
Cerca negli script per "美国要强买强卖,要求中国购买指定商品,四年还必须买够15万亿?"

Global M2 Liquidity [TheAlchimist]🌍 Global M2 Liquidity – Navigating the Quantum Field of Markets 🌍
Category: Macroeconomic Indicators 📊
"In quantum physics, the observer effect states that the mere act of observation changes the system being observed. Similarly, in financial markets, global liquidity acts as a quantum field that permeates all market states simultaneously. Just as Heisenberg’s uncertainty principle suggests we cannot precisely measure both position and momentum, the M2 money supply’s influence on market dynamics creates a complex web of cause and effect across multiple timeframes."
📈 Overview
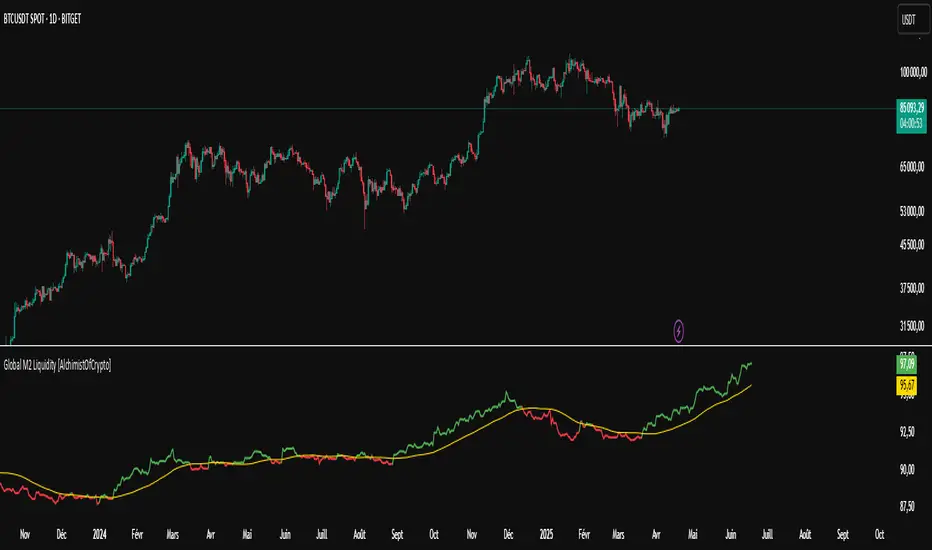
The Global M2 Liquidity indicator is a powerful tool that tracks the combined M2 money supply from five major economies (US, EU, China, Japan, UK), converted to USD 💵, offering a panoramic view of global liquidity conditions. With multi-timeframe analysis and a customizable forward-shift feature, it empowers traders to anticipate market movements driven by liquidity trends.
✨ Features
- Global Coverage 🌎: Monitors M2 money supply from 5 major economic regions (US, EU, China, Japan, UK).
- Real-Time Conversion 💱: Converts all data to USD for consistent analysis.
- Multi-Timeframe Analysis ⏰: Tracks liquidity from 15-minute to weekly charts.
- Forward-Shift Capability 🔮: Aligns M2 data with future price action for predictive insights.
- Color-Coded Trends 🎨: Visualizes liquidity trends (🟢 Expansion, 🔴 Contraction).
🚀 How to Use
1. Main Line 📉: Displays total global M2 liquidity in trillions of USD.
2. Golden Moving Average ⭐: Identifies the overall trend direction.
3. Trend Colors 🟢🔴:
- Green: Liquidity expanding above the moving average (bullish for risk assets).
- Red: Liquidity contracting below the moving average (bearish signal).
4. Forward Shift ⏩: Use the shift parameter to align M2 data with price action for predictive analysis.
5. Combine with Price Action 🔍: Correlate liquidity trends with assets like Bitcoin, stocks, or forex for strategic entries/exits.
⚙️ Settings
- MA Period 📏: Length of the moving average (default: 50).
- Shift ⏳: Number of days to shift data forward (default: 60).
🏷️ Tags
#Trading #Macroeconomic #M2Liquidity #GlobalLiquidity #MoneySupply #MultiTimeframe #TrendAnalysis #PredictiveAnalysis #Forex #Stocks #Crypto #Bitcoin #RiskAssets #CentralBanks #USD #TheAlchimist #QuantumTrading #AlgoTrading #DayTrading #SwingTrading
RSI HeartHere's an introduction you can use for your RSI Heart indicator:
---
### RSI Heart Indicator
The **RSI Heart Indicator** provides a visually engaging way to monitor and track the **Relative Strength Index (RSI)** across multiple timeframes (10m, 15m, 30m, and 1H). It not only shows the RSI value but also uses heart-shaped symbols to reflect the current market condition based on RSI levels, making it easier to understand the strength and momentum of a given asset at a glance.
### Key Features:
- **Multi-Timeframe Support**: The indicator pulls the RSI values from multiple timeframes (10 minutes, 15 minutes, 30 minutes, and 1 hour) so you can analyze market strength at different intervals in one view.
- **Heart Symbols**: RSI values are displayed alongside heart emojis (❤️, 💛, 💚) that provide a visual cue for the market condition:
- **❤️ (Overbought or Oversold)**: When RSI is below 27 or above 73.
- **💛 (Near Oversold/Overbought)**: When RSI is between 27-30 or 70-73.
- **💚 (Neutral)**: When RSI is between 30 and 70.
- **Customizable Visibility**: Toggle visibility for each timeframe's RSI using simple on/off settings, giving you control over which timeframes are displayed in your chart.
### How it Can Help:
- **Quick Market Sentiment Analysis**: The heart symbols and RSI values allow you to quickly assess whether an asset is in an overbought or oversold condition.
- **Multi-Timeframe RSI**: By viewing RSI across multiple timeframes, you can gain a more comprehensive understanding of market momentum and strength.
- **Personalized to Your Preferences**: Adjust the settings to only show the timeframes that matter most to you, creating a customized and clean chart view.
This indicator helps traders make more informed decisions by providing a clear, easy-to-read representation of market conditions across various timeframes, all within one indicator.
---
This introduction explains what the indicator does, its features, and how it can benefit traders in a concise and easy-to-understand way.

HTF FibonacciThis indicator displays Fibonacci lines for the selected previous HTF candle.
You can set its Fibs levels and colors.
HTF options: 15 minutes, 30 minutes, 1 hour, 2 hours, 4 hours and 1 day

CSCMultiTimeframeToolsLibrary "CSCMultiTimeframeTools"
Calculates instant higher timeframe values for higher timeframe analysis with zero lag.
getAdjustedLookback(current_tf_minutes, higher_tf_minutes, length)
Calculate adjusted lookback period for higher timeframe conversion.
Parameters:
current_tf_minutes (int) : Current chart timeframe in minutes (e.g., 5 for 5m).
higher_tf_minutes (int) : Target higher timeframe in minutes (e.g., 15 for 15m).
length (int) : Base length value (e.g., 14 for RSI/MFI).
Returns: Adjusted lookback period (length × multiplier).
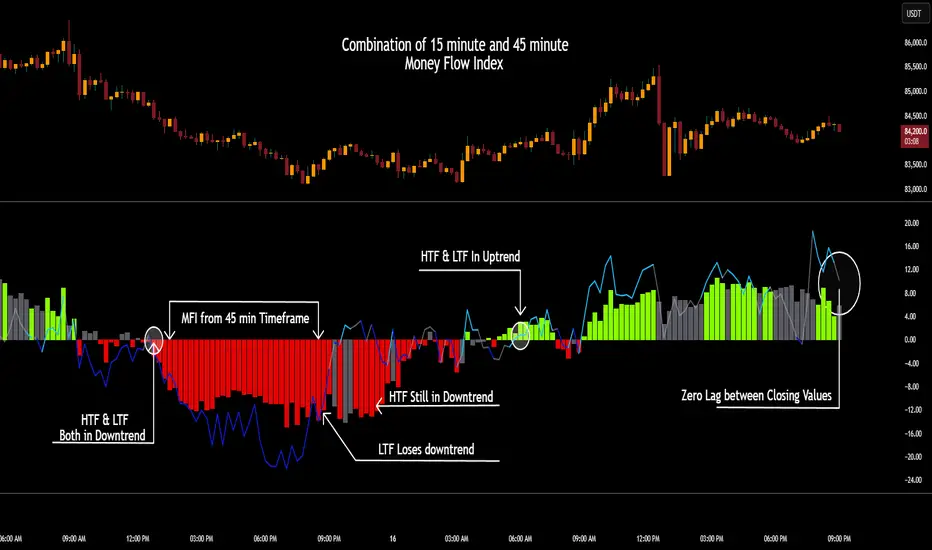
Purpose and Benefits of the TimeframeTools Library
This library is designed to solve a critical pain point for traders who rely on higher timeframe (HTF) indicator values while analyzing lower timeframe (LTF) charts. Traditional methods require waiting for multiple candles to close—for example, to see a 1-hour RSI on a 5-minute chart, you’d need 12 closed candles (5m × 12 = 60m) before the value updates. This lag means missed opportunities, delayed signals, and inefficient decision-making.
Why Traders Need This
Whether you’re scalping (5M/15M) or swing trading (1H/4H), this library bridges the gap between timeframes, giving you HTF context in real time—so you can act faster, with confidence.
How This Library Eliminates the Waiting Game
By dynamically calculating the adjusted lookback period, the library allows:
Real-time HTF values on LTF charts – No waiting for candle closes.
Accurate conversions – A 14-period RSI on a 1-hour chart translates to 168 periods (14 × 12) on a 5-minute chart, ensuring mathematical precision.
Flexible application – Works with common indicators like RSI, MFI, CCI, and moving averages (though confirmations should be done before publishing under your own secondary use).
Key Advantages Over Manual Methods
Speed: Instantly reflects HTF values without waiting for candle resolutions.
Adaptability: Adjusts automatically if the user changes timeframes or lengths.
Consistency: Removes human error in manual period calculations.
Limitations to Note
Not a magic bullet – While it solves the lag issue, traders should still:
Validate signals with price action or additional confirmations.
Be mindful of extreme lookback lengths (e.g., a 200-period daily SMA on a 1-minute chart requires 28,800 periods, which may strain performance).
RSI Oversold ScannerPine Script Description for TradingView Publication
Title: RSI Oversold Scanner (1m, 5m, 15m)
Description:
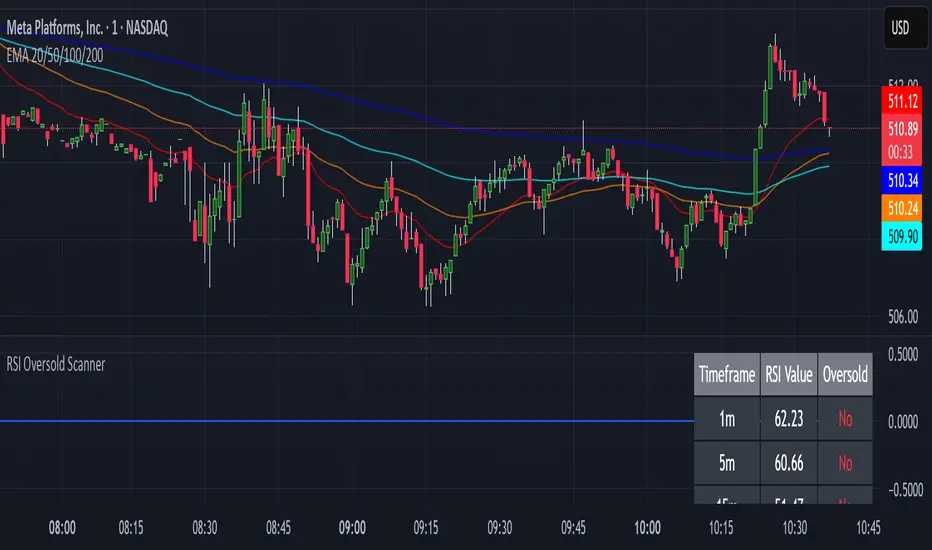
The RSI Oversold Scanner is a powerful tool designed to identify stocks that are simultaneously oversold on the 1-minute, 5-minute, and 15-minute timeframes, based on the Relative Strength Index (RSI). This script is ideal for traders seeking short-term reversal or momentum opportunities across multiple intraday timeframes.
Key Features:
Multi-Timeframe RSI Analysis: Calculates RSI (default length: 14) on the 1m, 5m, and 15m timeframes and checks if all are below the oversold threshold (default: 30).
Visual Output: Displays a table in the top-right corner showing RSI values and oversold status ("Yes" or "No") for each timeframe, making it easy to verify conditions.
Scan Result: Plots a value of 1 when all three timeframes are oversold, or 0 otherwise, enabling quick identification of matching stocks.
Alert Support: Includes an alert condition that triggers when a stock is oversold on all timeframes, with a customizable message for real-time notifications.
User-Friendly: Built with Pine Script v6 for compatibility and reliability, with clear visual feedback for traders of all levels.
How It Works:
The script uses ta.rsi to compute RSI on the current chart’s timeframe (1m) and request.security to fetch RSI data for the 5m and 15m timeframes.
It checks if RSI is below the oversold level (default: 30) on all three timeframes.
A table displays the RSI values and oversold status for easy debugging.
The Scan Result plot (1 or 0) indicates whether the stock meets the oversold criteria, which can be used for manual scanning or alerts.
Usage Instructions:
Add the script to your chart via Pine Editor.
Use a watchlist to switch between stocks and check the table or Scan Result for oversold conditions.
Set alerts by selecting the script’s Scan Result condition (value = 1) to get notified when a stock is oversold on all timeframes.
Customize the RSI length or oversold level in the script’s code if needed (e.g., change rsiLength or oversoldLevel).
Notes:
Best used on intraday charts (e.g., 1m or higher) with a watchlist for manual scanning, as TradingView’s Stock Screener does not directly support custom Pine Scripts.
Real-time alerts and intraday data may require a TradingView paid plan.
The script uses only two request.security calls, staying well within Pine Script’s limits.
Ideal For:
Day traders and swing traders looking for oversold stocks across multiple intraday timeframes.
Users who want to combine technical analysis with visual and alert-based confirmation.
VWAP + EMA Retracement Indicator SwiftEdgeVWAP + EMA Retracement Indicator
Overview
The VWAP + EMA Retracement Indicator is a powerful and visually engaging tool designed to help traders identify high-probability buy and sell opportunities in trending markets. By combining the Volume Weighted Average Price (VWAP) with two Exponential Moving Averages (EMAs) and a unique retracement-based signal logic, this indicator pinpoints moments when the price pulls back to a key zone before resuming its trend. Its modern, AI-inspired visuals and customizable features make it both intuitive and adaptable for traders of all levels.
What It Does
This indicator generates buy and sell signals based on a sophisticated yet straightforward strategy:
Buy Signals: Triggered when the price is above VWAP, has recently retraced to the zone between two EMAs (default 12 and 21 periods), and a strong bullish candle closes above both EMAs.
Sell Signals: Triggered when the price is below VWAP, has retraced to the EMA zone, and a strong bearish candle closes below both EMAs.
Signal Filtering: A customizable cooldown period ensures that only the first signal in a sequence is shown, reducing noise while preserving opportunities for new trends.
Confidence Scores: Each signal includes an AI-inspired confidence score (0-100%), calculated from candle strength and price distance to VWAP, helping traders gauge signal reliability.
The indicator’s visuals enhance decision-making with dynamic gradient lines, a highlighted retracement zone, and clear signal labels, all customizable to suit your preferences.
How It Works
The indicator integrates several components that work together to create a cohesive trading tool:
VWAP: Acts as a dynamic support/resistance level, reflecting the average price weighted by volume. It filters signals to ensure buys occur in uptrends (price above VWAP) and sells in downtrends (price below VWAP).
Dual EMAs: Two EMAs (default 12 and 21 periods) define a retracement zone where the price is likely to consolidate before continuing its trend. Signals are generated only after the price exits this zone with conviction.
Retracement Logic: The indicator looks for price pullbacks to the EMA zone within a user-defined lookback window (default 5 candles), ensuring signals align with trend continuation patterns.
Candle Strength: Signals require strong candles (bullish for buys, bearish for sells) with a minimum body size based on the Average True Range (ATR), filtering out weak or indecisive moves.
Cooldown Mechanism: A unique feature that prevents signal clutter by allowing only the first signal within a user-defined period (default 3 candles), balancing responsiveness with clarity.
Confidence Score: Combines candle body size and price distance to VWAP to assign a score, giving traders an at-a-glance measure of signal strength without needing external analysis.
These components are carefully combined to capture high-probability setups while minimizing false signals, making the indicator suitable for both short-term and swing trading.
How to Use It
Add to Chart: Apply the indicator to a 15-minute chart (recommended) or your preferred timeframe.
Customize Settings:
VWAP Source: Choose the price source (default: hlc3).
EMA Periods: Adjust the fast and slow EMA periods (default: 12 and 21).
Retracement Window: Set how many candles to look back for retracement (default: 5).
ATR Period & Body Size: Define candle strength requirements (default: 14 ATR period, 0.3 multiplier).
Cooldown Period: Control the minimum candles between signals (default: 3; set to 0 to disable).
Candle Requirements: Toggle whether signals require bullish/bearish candles or entire candle above/below EMAs.
Visuals: Enable/disable gradient colors, retracement zone, confidence scores, and choose a color scheme (Neon, Light, or Dark).
Interpret Signals:
Buy: A green "Buy" label with a confidence score appears below the candle when conditions are met.
Sell: A red "Sell" label with a confidence score appears above the candle.
Use the confidence score to prioritize higher-probability signals (e.g., above 80%).
Trade Management: Combine signals with your risk management strategy, such as setting stop-loss below the retracement zone and targeting a 1:2 risk-reward ratio.
Why It’s Unique
The VWAP + EMA Retracement Indicator stands out due to its thoughtful integration of classic indicators with modern enhancements:
Balanced Signal Filtering: The cooldown mechanism ensures clarity without missing key opportunities, unlike many indicators that overwhelm with frequent signals.
AI-Inspired Confidence: The confidence score simplifies decision-making by quantifying signal strength, mimicking advanced analytical tools in an accessible way.
Elegant Visuals: Dynamic gradients, a highlighted retracement zone, and customizable color schemes (Neon, Light, Dark) create a sleek, futuristic interface that’s both functional and visually appealing.
Flexibility: Extensive customization options let traders tailor the indicator to their style, from conservative swing trading to aggressive scalping.

Volume Flow RatioVolume Flow Ratio (VFR) Indicator
Overview
The Volume Flow Ratio (VFR) is a sophisticated volume analysis tool that measures current trading volume relative to the maximum volume of the previous period. Unlike traditional volume indicators that show raw volume or simple moving averages, VFR provides context by comparing current activity to recent maximum activity levels.
Core Features
1. Split Period Analysis
- Multiple Timeframe Options:
- Daily: Compares to previous day's maximum
- Weekly: Week-to-week comparison
- NYSE Weekly: Specialized for stock market trading (Monday-Friday only)
- Monthly: Month-to-month analysis
- Quarterly: Quarter-to-quarter perspective
- Yearly: Year-over-year volume comparison
2. Ratio-Based Measurement
- Displays volume as a ratio (0 to 1+) rather than raw numbers
- 1.0 represents volume equal to previous period's maximum
- Example: If previous max was 50,000 contracts:
- Current volume of 25,000 shows as 0.5
- Current volume of 75,000 shows as 1.5
3. Triple Coloring Modes
- Moving Average Based:
- Compares current ratio to its moving average
- Customizable MA period
- Green: Above MA (higher than average activity)
- Red: Below MA (lower than average activity)
- Previous Candle Comparison:
- Simple increase/decrease from previous bar
- Green: Higher than previous bar
- Red: Lower than previous bar
- Candle Color Based:
- Syncs with price action
- Green: Bullish candles (close > open)
- Red: Bearish candles (close < open)
Primary Use Cases
1. Volume Profile Analysis
- Perfect for traders who need to understand when markets are most active
- Helps identify unusual volume spikes relative to recent history
- Useful for timing entries and exits based on market participation
2. Market Activity Traders
Ideal for traders who:
- Need to identify high-liquidity periods
- Want to avoid low-volume periods
- Look for volume breakouts or divergences
- Trade based on institutional participation levels
3. Mean Reversion Traders
Helps identify:
- Overextended volume conditions (potential reversals)
- Volume exhaustion points
- Return to normal volume levels after spikes
4. Momentum Traders
Useful for:
- Confirming trend strength through volume
- Identifying potential trend exhaustion
- Validating breakouts with volume confirmation
Advantages Over Traditional Volume Indicators
1. Contextual Analysis
- Shows relative strength rather than raw numbers
- Easier to compare across different time periods
- Automatically adjusts to changing market conditions
2. Period-Specific Insights
- Respects natural market cycles (daily, weekly, monthly)
- Special handling for NYSE trading days
- Eliminates weekend noise in stock market analysis
3. Flexible Visualization
- Three distinct coloring methods for different trading styles
- Clear reference line at 1.0 for quick analysis
- Histogram style for easy pattern recognition
Best Practices
For Day Traders
- Use Daily split for intraday volume patterns
- MA coloring mode with shorter periods (5-10)
- Focus on ratios during market hours
For Swing Traders
- Weekly or NYSE Weekly splits
- Longer MA periods (15-20)
- Look for sustained volume patterns
For Position Traders
- Monthly or Quarterly splits
- Candle color mode for trend confirmation
- Focus on major volume shifts
Limitations
- Requires one full period to establish baseline
- May be less effective in extremely low volume conditions
- NYSE Weekly mode specific to stock market hours
This indicator is particularly valuable for traders who understand that volume is a crucial component of price action but need a more sophisticated way to analyze it than simple volume bars. It's especially useful for those who trade based on market participation levels and need to quickly identify whether current volume is significant relative to recent history.

Moving average with different timeThis script allowing you to plot up to 6 different types of moving averages (MAs) on the chart, each with customizable parameters such as type, length, source, color, and timeframe. It also allows you to set different timeframes for each moving average.
Key Features:
Multiple Moving Averages: You can add up to 6 different moving averages to your chart.
Each MA can be one of the following types: SMA, EMA, SMMA (RMA), WMA, or VWMA.
Custom Timeframes: Each moving average can be applied to a specific timeframe, giving you flexibility to compare different periods (e.g., a 50-period moving average on the 1-hour chart and a 200-period moving average on the 4-hour chart).
Customizable Inputs:
Type: Choose between SMA, EMA, SMMA, WMA, or VWMA for each MA.
Source: You can select the price data source (e.g., close, open, high, low).
Length: Set the number of periods (length) for each moving average.
Color: Each moving average can be assigned a specific color.
Timeframe: Customize the timeframe for each moving average individually (e.g., MA1 on 15-minute, MA2 on 1-hour).
User Interface:
The script includes a data window display for each moving average, allowing you to control whether to show each MA and configure its settings directly from the settings menu.
Flexible Use:
Toggle individual moving averages on and off with the show checkbox for each MA.
Customize each MA's parameters without affecting others.
Parameters:
MA Type: You can choose between different moving averages (SMA, EMA, etc.).
Source: Price data used for calculating the moving average (e.g., close, open, etc.).
Length: Defines the period (number of bars) for each moving average.
Color: Change the line color for each moving average for better visualization.
Timeframe: Set a different timeframe for each moving average (e.g., 1-day MA vs. 1-week MA).
Example Use Case:
You might use this indicator to track short-term, medium-term, and long-term trends by adding multiple MAs with different lengths and timeframes. For example:
MA1 (20-period) might be an SMA on a 1-hour chart.
MA2 (50-period) might be an EMA on a 4-hour chart.
MA3 (100-period) might be a WMA on a daily chart.
This setup allows you to visually track the market's behavior across different timeframes and better identify trends, crossovers, and other patterns.
How to Customize:
Show/Hide MAs: Enable or disable each moving average from the input menu.
Modify Parameters: Change the MA type, source, length, and color for each individual moving average.
Timeframes: Set different timeframes for each moving average for more detailed analysis.
With this Moving Average Ribbon, you get a versatile and visually rich tool to aid in technical analysis.

AllMA Trend Radar [trade_lexx]📈 AllMA Trend Radar is your universal trend analysis tool!
📊 What is AllMA Trend Radar?
AllMA Trend Radar is a powerful indicator that uses various types of Moving Averages (MA) to analyze trends and generate trading signals. The indicator allows you to choose from more than 30 different types of moving averages and adjust their parameters to suit your trading style.
💡 The main components of the indicator
📈 Fast and slow moving averages
The indicator uses two main lines:
- Fast MA (blue line): reacts faster to price changes
- Slow MA (red line): smoother, reflects a long-term trend
The combined use of fast and slow MA allows you to get trend confirmation and entry/exit points from the market.
🔄 Wide range of moving averages
There are more than 30 types of moving averages at your disposal:
- SMA: Simple moving average
- EMA: Exponential moving average
- WMA: Weighted moving average
- DEMA: double exponential MA
- TEMA: triple exponential MA
- HMA: Hull Moving Average
- LSMA: Moving average of least squares
- JMA: Eureka Moving Average
- ALMA: Arnaud Legoux Moving Average
- ZLEMA: moving average with zero delay
- And many others!
🔍 Indicator signals
1️⃣ Fast 🆚 Slow MA signals (intersection and ratio of fast and slow MA)
Up/Down signals (intersection)
- Buy (Up) signal:
- What happens: the fast MA crosses the slow MA from bottom to top
- What does the green triangle with the "Buy" label under the candle look
like - What does it mean: a likely upward trend reversal or an uptrend strengthening
- Sell signal (Down):
- What happens: the fast MA crosses the slow MA from top to bottom
- What does it look like: a red triangle with a "Sell" mark above the candle
- What does it mean: a likely downtrend reversal or an increase in the downtrend
Greater/Less signals (ratio)
- Buy signal (Greater):
- What happens: the fast MA becomes higher than the slow MA
- What does it look like: a green triangle with a "Buy" label under the candle
- What does it mean: the formation or confirmation of an uptrend
- Sell signal (Less):
- What happens: the fast MA becomes lower than the slow MA
- What does it look like: a red triangle with a "Sell" mark above the candle
- What does it mean: the formation or confirmation of a downtrend
2️⃣ Signals ⚡️ Fast MA (fast MA and price)
Up/Down signals (intersection)
- Buy signal (Up Fast):
- What happens: the price crosses the fast MA from bottom to top
- What does it look like: a green triangle with a "Buy" label under the candle
- What does it mean: a short-term price growth signal
- Sell signal (Down Fast):
- What happens: the price crosses the fast MA from top to bottom
- What does it look like: a red triangle with a "Sell" label above the candle
- What does it mean: a short-term price drop signal
Greater/Less signals (ratio)
- Buy signal (Greater Fast):
- What happens: the price is getting higher than the fast MA
- What does it look like: a green triangle with a "Buy" label under the candle
- What does it mean: the price is above the fast MA, which indicates an upward movement
- Sell signal (Less Fast):
- What happens: the price is getting lower than the fast MA
- What does it look like: a red triangle with a "Sell" mark above the candle
- What does it mean: the price is under the fast MA, which indicates a downward movement
3️⃣ Signals 🐢 Slow MA (slow MA and price)
Up/Down signals (intersection)
- Buy signal (Up Slow):
- What happens: the price crosses the slow MA from bottom to top
- What does it look like: a green triangle with a "Buy" label under the candle
- What does it mean: a potential medium-term upward trend reversal
- Sell signal (Down Slow):
- What happens: the price crosses the slow MA from top to bottom
- What does it look like: a red triangle with a "Sell" label above the candle
- What does it mean: a potential medium-term downward trend reversal
Greater/Less signals (ratio)
- Buy signal (Greater Slow):
- What happens: the price is getting above the slow MA
- What does it look like: a green triangle with a "Buy" label under the candle
- What does it mean: the price is above the slow MA, which indicates a strong upward movement
- Sell signal (Less Slow):
- What is happening: the price is getting below the slow MA
- What does it look like: a red triangle with a "Sell" mark above the candle
- What does it mean: the price is under the slow MA, which indicates a strong downward movement
🛠 Filters to filter out false signals
1️⃣ Minimum distance between the signals
- What it does: sets the minimum number of candles between signals of the same type
- Why it is needed: it prevents the appearance of too frequent signals, especially during periods of high volatility
- How to set it up: Set a different value for each signal type (default: 3-5 bars)
- Example: if the value is 3 for Up/Down signals, after the buy signal appears, the next buy signal may appear no earlier than 3 bars later
2️⃣ Advanced indicator filters
🔍 RSI Filter
- What it does: Checks the Relative Strength Index (RSI) value before generating a signal
- Why it is needed: it helps to avoid countertrend entries and catch reversal points
- How to set up:
- For buy signals (🔋 Buy): set the RSI range, usually in the oversold zone (for example, 1-30)
- For sell signals (🪫 Sell): set the RSI range, usually in the overbought zone (for example, 70-100)
- Example: if the RSI = 25 (in the range 1-30), the buy signal will be confirmed
📊 MFI Filter (Cash Flow Index)
- What it does: analyzes volumes and the direction of price movement
- Why it is needed: confirms signals with data on the activity of cash flows
- How to set up:
- For buy signals (🔋 Buy): set the MFI range in the oversold zone (for example, 1-25)
- For sell signals (🪫 Sell): set the MFI range in the overbought zone (for example, 75-100)
- Example: if MFI = 80 (in the range of 75-100), the sell signal will be confirmed
📈 Stochastic Filter
- What it does: analyzes the position of the current price relative to the price range
- Why it is needed: confirms signals based on overbought/oversold conditions
- How to configure:
- You can configure the K Length, D Length and Smoothing parameters
- For buy signals (🔋 Buy): set the stochastic range in the oversold zone (for example, 1-20)
- For sell signals (🪫 Sell): set the stochastic range in the overbought zone (for example, 80-100)
- Example: if stochastic = 15 (is in the range of 1-20), the buy signal will be confirmed
🔌 Connecting to trading strategies
The indicator provides various connectors to connect to your trading strategies.:
1️⃣ Individual connectors for each type of signal
- 🔌Fast vs Slow Up/Down MA Signal🔌: signals for the intersection of fast and slow MA
- 🔌Fast vs Slow Greater/Less MA Signal🔌: signals of the ratio of fast and slow MA
- 🔌Fast Up/Down MA Signal🔌: signals of the intersection of price and fast MA
- 🔌Fast Greater/Less MA Signal🔌: signals of the ratio of price and fast MA
- 🔌Slow Up/Down MA Signal🔌: signals of the intersection of price and slow MA
- 🔌Slow Greater/Less MA Signal🔌: Price versus slow MA signals
2️⃣ Combined connectors
- 🔌Combined Up/Down MA Signal🔌: combines all the crossing signals (Up/Down)
- 🔌Combined Greater/Less MA Signal🔌: combines all the signals of the ratio (Greater/Less)
- 🔌Combined All MA Signals🔌: combines all signals (Up/Down and Greater/Less)
❗️ All connectors return values:
- 1: buy signal
- -1: sell signal
- 0: no signal
📚 How to start using AllMA Trend Radar
1️⃣ Selection of types of moving averages
- Add an indicator to the chart
- Select the type and period for the fast MA (default: DEMA with a period of 14)
- Select the type and period for the slow MA (default: SMA with a period of 14)
- Experiment with different types of MA to find the best combination for your trading style
2️⃣ Signal settings
- Turn on the desired signal types (Up/Down, Greater/Less)
- Set the minimum distance between the signals
- Activate and configure the necessary filters (RSI, MFI, Stochastic)
3️⃣ Checking on historical data
- Analyze how the indicator works based on historical data
- Pay attention to the accuracy of the signals and the presence of false alarms
- Adjust the settings if necessary
4️⃣ Introduction to the trading strategy
- Decide which signals will be used to enter the position.
- Determine which signals will be used to exit the position.
- Connect the indicator to your trading strategy through the appropriate connectors
🌟 Practical application examples
Scalping strategy
- Fast MA: TEMA with a period of 8
- Slow MA: EMA with a period of 21
- Active signals: Fast MA Up/Down
- Filters: RSI (range 1-40 for purchases, 60-100 for sales)
- Signal spacing: 3 bars
Strategy for day trading
- Fast MA: TEMA with a period of 10
- Slow MA: SMA with a period of 20
- Active signals: Fast MA Up/Down and Fast vs Slow Greater/Less
- Filters: MFI (range 1-25 for purchases, 75-100 for sales)
- Signal spacing: 5 bars
Swing Trading Strategy
- Fast MA: DEMA with a period of 14
- Slow MA: VWMA with a period of 30
- Active signals: Fast vs Slow Up/Down and Slow MA Greater/Less
- Filters: Stochastic (range 1-20 for purchases, 80-100 for sales)
- Signal spacing: 8 bars
A strategy for positional trading
- Fast MA: HMA with a period of 21
- Slow MA: SMA with a period of 50
- Active signals: Slow MA Up/Down and Fast vs Slow Greater/Less
- Filters: RSI and MFI at the same time
- The distance between the signals: 10 bars
💡 Tips for using AllMA Trend Radar
1. Select the types of MA for market conditions:
- For trending markets: DEMA, TEMA, HMA (fast MA)
- For sideways markets: SMA, WMA, VWMA (smoothed MA)
- For volatile markets: KAMA, AMA, VAMA (adaptive MA)
2. Combine different types of signals:
- Up/Down signals work better when moving from a sideways trend to a directional
one - Greater/Less signals are optimal for fixing a stable trend
3. Use filters effectively:
- The RSI filter works great in trending markets
- MFI filter helps to confirm the strength of volume movement
- Stochastic filter works well in lateral ranges
4. Adjust the minimum distance between the signals:
- Small values (2-3 bars) for short-term trading
- Average values (5-8 bars) for medium-term trading
- Large values (10+ bars) for long-term trading
5. Use combination connectors:
- For more reliable signals, connect the indicator through the combined connectors
💰 With the AllMA Trend Radar indicator, you get a universal trend analysis tool that can be customized for any trading style and timeframe. The combination of different types of moving averages and advanced filters allows you to significantly improve the accuracy of signals and the effectiveness of your trading strategy!

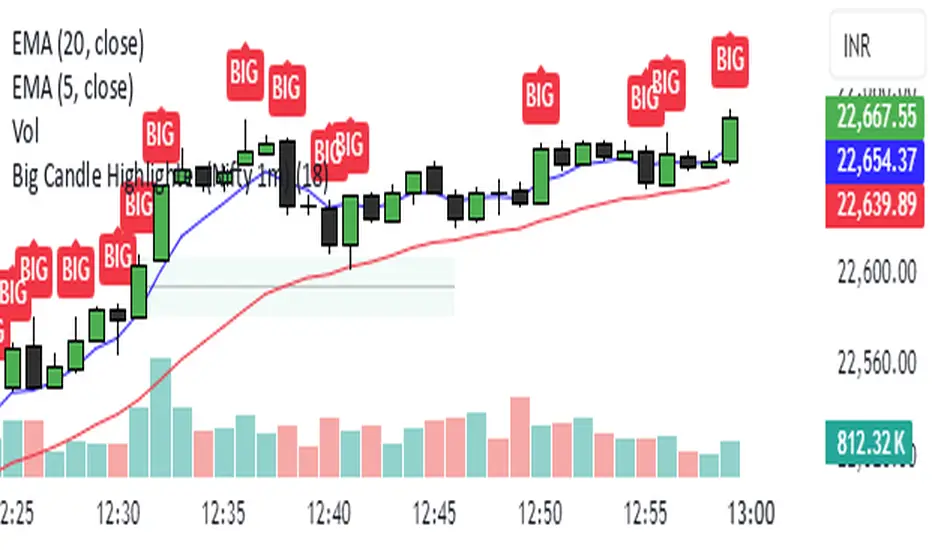
Big Candle Highlighter (Nifty 1m)This indicator will help option buyers to avoid taking trade in impulsive candles.
For Example :
Normal 1m candle: ~10–15 pts
Big candle (possible liquidity/impulse): >18 pts
Very large / avoid chasing: >25 pts
If you see a candle that breaks structure with a 25-30 point range and closes strong, it’s often:
A liquidity sweep
A news spike
Or the start of an impulsive leg — in which case entering at close can be risky without a retest
Quarterly Theory ICT 04 [TradingFinder] SSMT 4Quarter Divergence🔵 Introduction
Sequential SMT Divergence is an advanced price-action-based analytical technique rooted in the ICT (Inner Circle Trader) methodology. Its primary objective is to identify early-stage divergences between correlated assets within precise time structures. This tool not only breaks down market structure but also enables traders to detect engineered liquidity traps before the market reacts.
In simple terms, SMT (Smart Money Technique) occurs when two correlated assets—such as indices (ES and NQ), currency pairs (EURUSD and GBPUSD), or commodities (Gold and Silver)—exhibit different reactions at key price levels (swing highs or lows). This lack of alignment is often a sign of smart money manipulation and signals a lack of confirmation in the ongoing trend—hinting at an imminent reversal or at least a pause in momentum.
In its Sequential form, SMT divergences are examined through a more granular temporal lens—between intraday quarters (Q1 through Q4). When SMT appears at the transition from one quarter to another (e.g., Q1 to Q2 or Q3 to Q4), the signal becomes significantly more powerful, often aligning with a critical phase in the Quarterly Theory—a framework that segments market behavior into four distinct phases: Accumulation, Manipulation, Distribution, and Reversal/Continuation.
For instance, a Bullish SMT forms when one asset prints a new low while its correlated counterpart fails to break the corresponding low from the previous quarter. This usually indicates absorption of selling pressure and the beginning of accumulation by smart money. Conversely, a Bearish SMT arises when one asset makes a higher high, but the second asset fails to confirm, signaling distribution or a fake-out before a decline.
However, SMT alone is not enough. To confirm a true Market Structure Break (MSB), the appearance of a Precision Swing Point (PSP) is essential—a specific candlestick formation on a lower timeframe (typically 5 to 15 minutes) that reveals the entry of institutional participants. The combination of SMT and PSP provides a more accurate entry point and better understanding of premium and discount zones.
The Sequential SMT Indicator, introduced in this article, dynamically scans charts for such divergence patterns across multiple sessions. It is applicable to various markets including Forex, crypto, commodities, and indices, and shows particularly strong performance during mid-week sessions (Wednesdays and Thursdays)—when most weekly highs and lows tend to form.
Bullish Sequential SMT :
Bearish Sequential SMT :
🔵 How to Use
The Sequential SMT (SSMT) indicator is designed to detect time and structure-based divergences between two correlated assets. This divergence occurs when both assets print a similar swing (high or low) in the previous quarter (e.g., Q3), but in the current quarter (e.g., Q4), only one asset manages to break that swing level—while the other fails to reach it.
This temporal mismatch is precisely identified by the SSMT indicator and often signals smart money activity, a market phase transition, or even the presence of an engineered liquidity trap. The signal becomes especially powerful when paired with a Precision Swing Point (PSP)—a confirming candle on lower timeframes (5m–15m) that typically indicates a market structure break (MSB) and the entry of smart liquidity.
🟣 Bullish Sequential SMT
In the previous quarter, both assets form a similar swing low.
In the current quarter, one asset (e.g., EURUSD) breaks that low and trades below it.
The other asset (e.g., GBPUSD) fails to reach the same low, preserving the structure.
This time-based divergence reflects declining selling pressure, potential absorption, and often marks the end of a manipulation phase and the start of accumulation. If confirmed by a bullish PSP candle, it offers a strong long opportunity, with stop-losses defined just below the swing low.
🟣 Bearish Sequential SMT
In the previous quarter, both assets form a similar swing high.
In the current quarter, one asset (e.g., NQ) breaks above that high.
The other asset (e.g., ES) fails to reach that high, remaining below it.
This type of divergence signals weakening bullish momentum and the likelihood of distribution or a fake-out before a price drop. When followed by a bearish PSP candle, it sets up a strong shorting opportunity with targets in the discount zone and protective stops placed above the swing high.
🔵 Settings
⚙️ Logical Settings
Quarterly Cycles Type : Select the time segmentation method for SMT analysis.
Available modes include: Yearly, Monthly, Weekly, Daily, 90 Minute, and Micro.
These define how the indicator divides market time into Q1–Q4 cycles.
Symbol : Choose the secondary asset to compare with the main chart asset (e.g., XAUUSD, US100, GBPUSD).
Pivot Period : Sets the sensitivity of the pivot detection algorithm. A smaller value increases responsiveness to price swings.
Activate Max Pivot Back : When enabled, limits the maximum number of past pivots to be considered for divergence detection.
Max Pivot Back Length : Defines how many past pivots can be used (if the above toggle is active).
Pivot Sync Threshold : The maximum allowed difference (in bars) between pivots of the two assets for them to be compared.
Validity Pivot Length : Defines the time window (in bars) during which a divergence remains valid before it's considered outdated.
🎨 Display Settings
Show Cycle :Toggles the visual display of the current Quarter (Q1 to Q4) based on the selected time segmentation
Show Cycle Label : Shows the name (e.g., "Q2") of each detected Quarter on the chart.
Show Bullish SMT Line : Draws a line connecting the bullish divergence points.
Show Bullish SMT Label : Displays a label on the chart when a bullish divergence is detected.
Bullish Color : Sets the color for bullish SMT markers (label, shape, and line).
Show Bearish SMT Line : Draws a line for bearish divergence.
Show Bearish SMT Label : Displays a label when a bearish SMT divergence is found.
Bearish Color : Sets the color for bearish SMT visual elements.
🔔 Alert Settings
Alert Name : Custom name for the alert messages (used in TradingView’s alert system).
Message Frequency :
All: Every signal triggers an alert.
Once Per Bar: Alerts once per bar regardless of how many signals occur.
Per Bar Close: Only triggers when the bar closes and the signal still exists.
Time Zone Display : Choose the time zone in which alert timestamps are displayed (e.g., UTC).
Bullish SMT Divergence Alert : Enable/disable alerts specifically for bullish signals.
Bearish SMT Divergence Alert : Enable/disable alerts specifically for bearish signals
🔵 Conclusion
The Sequential SMT (SSMT) indicator is a powerful and precise tool for identifying structural divergences between correlated assets within a time-based framework. Unlike traditional divergence models that rely solely on sequential pivot comparisons, SSMT leverages Quarterly Theory, in combination with concepts like liquidity sweeps, market structure breaks (MSB) and precision swing points (PSP), to provide a deeper and more actionable view of market dynamics.
By using SSMT, traders gain not only the ability to identify where divergence occurs, but also when it matters most within the market cycle. This empowers them to anticipate major moves or traps before they fully materialize, and position themselves accordingly in high-probability trade zones.
Whether you're trading Forex, crypto, indices, or commodities, the true strength of this indicator is revealed when used in sync with the Accumulation, Manipulation, Distribution, and Reversal phases of the market. Integrated with other confluence tools and market models, SSMT can serve as a core component in a professional, rule-based, and highly personalized trading strategy.

GranDoc - Week, Day, Month, and Session Separator5Indicator Name: GranDoc's - Week, Day, Month, and Session Separator
Version: Pine Script v5
Author: Jonpaul Nnamdi Opara (GranDoc )
Description
The "GranDoc - Week, Day, Month, and Session Separator" is a highly customizable TradingView indicator designed to enhance chart analysis by visually marking critical time-based transitions. Developed by Jonpaul Nnamdi Opara, this tool plots vertical lines with labels or background highlights to denote the start and end of weeks, days, months, and major trading sessions (Frankfurt, London, NY Morning, NY Afternoon, Sydney, and Tokyo). Traders can tailor colors, line styles, widths, transparency, and session times to align with their strategies and timezones.
Ideal for forex, stocks, futures, and crypto traders, this indicator simplifies the identification of key market periods—such as session openings/closings or new weeks—that often signal increased volatility or trend shifts. It’s optimized for intraday timeframes for session separators but supports all timeframes for week, day, and month markers, making it a versatile addition to any trader’s toolkit.
Features
Week Separators: Marks Monday starts with customizable lines and "Week Start" labels.
Day Separators: Highlights daily openings with lines and "Day Start" labels.
Month Separators: Indicates new months with lines and "Month Start" labels.
Session Separators: Plots lines and labels for major trading sessions’ start and end:
Frankfurt (default: 07:00–15:00 UTC)
London (default: 08:00–16:00 UTC)
NY Morning (default: 13:00–16:00 UTC)
NY Afternoon (default: 16:00–21:00 UTC)
Sydney (default: 22:00–06:00 UTC)
Tokyo (default: 00:00–08:00 UTC)
Timezone Support: Adjusts session times with a UTC offset (±12 hours).
Display Flexibility : Toggle between labeled vertical lines or background highlights.
Customization: Fine-tune colors, line styles (solid, dashed, dotted), widths, and transparency.
Background Mode: Highlights periods with translucent backgrounds for cleaner charts.
[ i]Labeled Lines: Each line includes descriptive labels (e.g., "London Open", "Tokyo Closed") when not in background mode.
How to Use
Add to Chart:
Copy the script into TradingView’s Pine Editor.
Click "Add to Chart" to apply the indicator.
Customize Settings:
Open settings via double-click or the "Settings" gear icon.
Timezone Offset: Set your UTC offset (e.g., -5 for EST) to align sessions.
Toggles: Enable/disable week, day, month, or session separators.
Appearance: Adjust colors, line styles, widths, and transparency for each separator.
Session Times: Modify start/end hours and minutes if defaults don’t suit your market.
Background Mode: Enable "Show as Background" for colored backgrounds instead of lines, and tweak "Session Background Transparency."
Labels: Labeled lines (e.g., "Sydney Open") appear automatically unless background mode is active.
Chart Compatibility:
Session separators require intraday timeframes (e.g., 1-minute to 4-hour).
Week, day, and month separators work across all timeframes.
Confirm your chart’s timezone aligns with your analysis.
Analyze:
Use separators to pinpoint session transitions, daily openings, or weekly shifts for trade planning.
Labels make it easy to spot key periods on busy charts.
Pair with indicators like RSI, volume, or support/resistance for deeper insights.
Example Use Cases
Forex Trading: Highlight London and NY session opens/closes for high-liquidity entries.
Day Trading: Reset strategies at daily separators and monitor intraday volatility.
Swing Trading: Use week/month separators to track longer-term trends.
Session Focus: Isolate sessions like Tokyo for regional market analysis.
Chart Clarity: Background mode declutters charts while marking key times.
Notes
Session separators are disabled on daily+ timeframes to prevent clutter.
Verify timezone offset for accurate session alignment.
Background mode suits lower timeframes for readability.
Labels are visible only when background mode is disabled.
Feedback
Share your thoughts or suggestions to make this indicator even better! Reach out via TradingView or connect with the author for insights. Happy trading!
About the Author
Dr. Jonpaul Nnamdi Opara, a PhD graduate from Ehime University, Japan, is a researcher and developer specializing in AI and machine learning. His work on automated landslide mapping and defect detection, published in journals like GEOMATE, showcases his precision-driven approach. With the "GranDoc" indicator, Jonpaul brings intuitive, data-driven clarity to financial markets, reflecting his expertise in creating impactful tools.

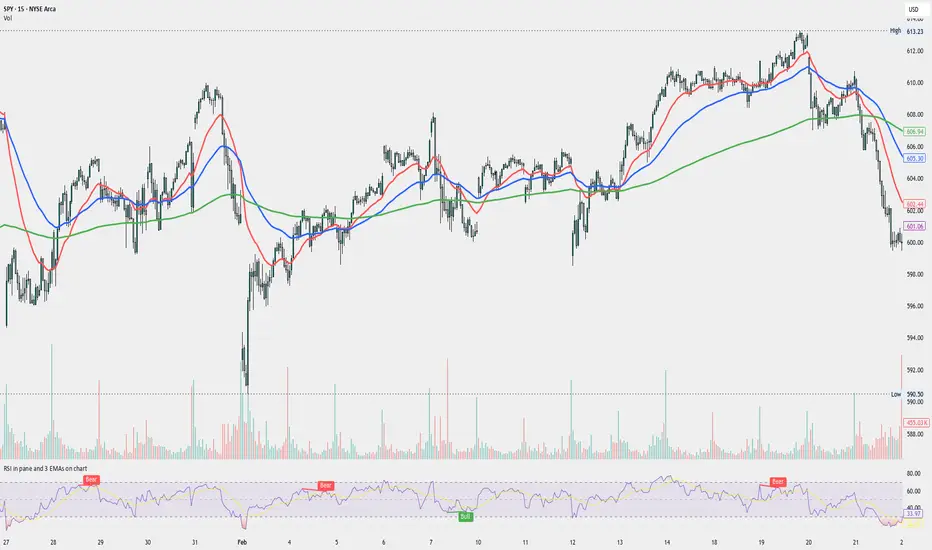
RSI in pane and 3 EMAs on chartCustom RSI in Pane + 3 EMAs on Chart — with Optional RSI Divergence Detection
Combines RSI in a separate pane with 3 EMAs on the chart and optional RSI-based divergence detection. Useful for analyzing both momentum and trend structure.
Features
RSI Pane
Custom RSI calculation (not built-in ta.rsi) with adjustable source and length
Overlay optional moving average (SMA, EMA, SMMA/RMA, WMA, VWMA, or Bollinger Bands) Overbought/oversold gradient fill for visual clarity (70 / 30 zones)
Midline (50) for neutral RSI territory
RSI Divergence Detection
Optional: toggle on/off with one input
Regular Bullish Divergence : Price makes a lower low, RSI makes a higher low
Regular Bearish Divergence : Price makes a higher high, RSI makes a lower high
Customizable lookback for pivot detection
Visual markers and labels plotted on RSI
Built-in alert conditions for both divergence types
3 EMA Trend Indicators on Price Chart
Three customizable EMAs (default: 20, 50, 200)
Color-coded and clearly plotted on main chart
Use to determine short/mid/long-term trend bias
No repainting or smoothing artifacts
Why use this script?
Gives a full view of trend + momentum without cluttering the main price chart, and it helps confirm entries and exits by observing RSI behavior alongside EMAs. The optional divergence detection can act as a signal for potential exhaustion or reversal (not entry signals on their own). It is a Good fit for traders who use RSI zones, divergences, and EMA structure in their decision-making, both for intra-day and swing trades (where it performs best).
How to use
Add this script to your chart. EMAs will appear on the main price chart; RSI and divergence will appear in a separate pane.
Adjust RSI and MA settings to fit your trading style (e.g., fast RSI for scalping, slower for swing)
Enable "Show Divergence" if you want visual alerts and markers
Use alerts to get notified when a divergence occurs without watching the chart
Always check the divergences on different time frames to validate the setup, and do not consider them valid on small time frames (<15 minutes).
Built for traders who want both momentum and trend context in a single tool — without clutter, repainting, or noise. I created this script to streamline my own analysis and avoid switching between multiple indicators. It's not meant to be a "signal generator" but a visual assistant for making better decisions. If you find it useful or have feedback, feel free to reach out.
Moving Average Shift WaveTrend StrategyMoving Average Shift WaveTrend Strategy
🧭 Overview
The Moving Average Shift WaveTrend Strategy is a trend-following and momentum-based trading system designed to be overlayed on TradingView charts. It executes trades based on the confluence of multiple technical conditions—volatility, session timing, trend direction, and oscillator momentum—to deliver logical and systematic trade entries and exits.
🎯 Strategy Objectives
Enter trades aligned with the prevailing long-term trend
Exit trades on confirmed momentum reversals
Avoid false signals using session timing and volatility filters
Apply structured risk management with automatic TP, SL, and trailing stops
⚙️ Key Features
Selectable MA types: SMA, EMA, SMMA (RMA), WMA, VWMA
Dual-filter logic using a custom oscillator and moving averages
Session and volatility filters to eliminate low-quality setups
Trailing stop, configurable Take Profit / Stop Loss logic
“In-wave flag” prevents overtrading within the same trend wave
Visual clarity with color-shifting candles and entry/exit markers
📈 Trading Rules
✅ Long Entry Conditions:
Price is above the selected MA
Oscillator is positive and rising
200-period EMA indicates an uptrend
ATR exceeds its median value (sufficient volatility)
Entry occurs between 09:00–17:00 (exchange time)
Not currently in an active wave
🔻 Short Entry Conditions:
Price is below the selected MA
Oscillator is negative and falling
200-period EMA indicates a downtrend
All other long-entry conditions are inverted
❌ Exit Conditions:
Take Profit or Stop Loss is hit
Opposing signals from oscillator and MA
Trailing stop is triggered
🛡️ Risk Management Parameters
Pair: ETH/USD
Timeframe: 4H
Starting Capital: $3,000
Commission: 0.02%
Slippage: 2 pips
Risk per Trade: 2% of account equity (adjustable)
Total Trades: 224
Backtest Period: May 24, 2016 — April 7, 2025
Note: Risk parameters are fully customizable to suit your trading style and broker conditions.
🔧 Trading Parameters & Filters
Time Filter: Trades allowed only between 09:00–17:00 (exchange time)
Volatility Filter: ATR must be above its median value
Trend Filter: Long-term 200-period EMA
📊 Technical Settings
Moving Average
Type: SMA
Length: 40
Source: hl2
Oscillator
Length: 15
Threshold: 0.5
Risk Management
Take Profit: 1.5%
Stop Loss: 1.0%
Trailing Stop: 1.0%
👁️ Visual Support
MA and oscillator color changes indicate directional bias
Clear chart markers show entry and exit points
Trailing stops and risk controls are transparently managed
🚀 Strategy Improvements & Uniqueness
In-wave flag avoids repeated entries within the same trend phase
Filtering based on time, volatility, and trend ensures higher-quality trades
Dynamic high/low tracking allows precise trailing stop placement
Fully rule-based execution reduces emotional decision-making
💡 Inspirations & Attribution
This strategy is inspired by the excellent concept from:
ChartPrime – “Moving Average Shift”
It expands on the original idea with advanced trade filters and trailing logic.
Source reference:
📌 Summary
The Moving Average Shift WaveTrend Strategy offers a rule-based, reliable approach to trend trading. By combining trend and momentum filters with robust risk controls, it provides a consistent framework suitable for various market conditions and trading styles.
⚠️ Disclaimer
This script is for educational purposes only. Trading involves risk. Always use proper backtesting and risk evaluation before applying in live markets.

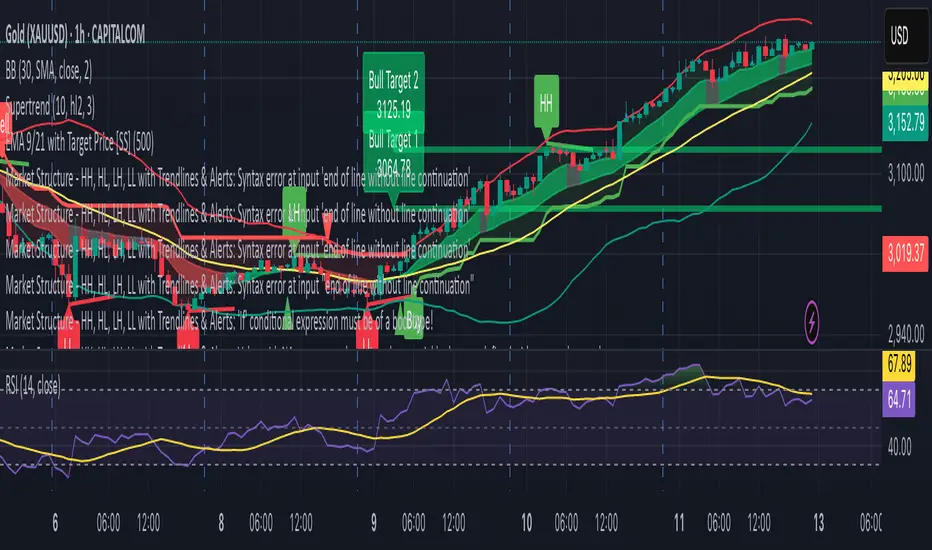
Market Structure - HH, HL, LH, LL with Trendlines & AlertsMarket Structure Script – HH, HL, LH, LL with Trendlines & Alerts
This Pine Script is designed to help identify key market structure patterns such as Higher Highs (HH), Higher Lows (HL), Lower Highs (LH), and Lower Lows (LL) on price charts. It also draws trendlines connecting the respective swing points and provides alerts when these important price patterns occur.
Key Features:
Swing High and Low Detection:
The script uses the ta.pivothigh and ta.pivotlow functions to identify significant swing highs and swing lows based on the pivot length (pivotLen). These points mark local peaks and troughs in the price action.
Dynamic Pivot Length:
The script adjusts the pivotLen (which defines the number of bars used to calculate swing points) based on the current timeframe of the chart. For example, for a 15-minute chart, it uses a pivot length of 5 bars, while for a daily chart, it uses 10 bars. This dynamic adjustment ensures that the script works across different timeframes.
Higher Highs (HH), Higher Lows (HL), Lower Highs (LH), Lower Lows (LL):
Higher High (HH): Identifies a price peak that is higher than the previous swing high, indicating an uptrend.
Higher Low (HL): Identifies a price trough that is higher than the previous swing low, supporting the idea of an ongoing uptrend.
Lower High (LH): Identifies a price peak that is lower than the previous swing high, suggesting a potential reversal or downtrend.
Lower Low (LL): Identifies a price trough that is lower than the previous swing low, indicating a downtrend.
Trendlines:
For each identified Higher High, Higher Low, Lower High, or Lower Low, the script automatically draws a trendline connecting the corresponding swing points. These trendlines provide a visual representation of the market’s price structure, showing support and resistance levels.
Labels:
The script places labels on the chart next to the respective swing points. These labels mark whether the point is a Higher High (HH), Higher Low (HL), Lower High (LH), or Lower Low (LL). This helps traders easily visualize the price pattern at a glance.
Alerts:
Alert conditions are set for when a Higher High (HH), Higher Low (HL), Lower High (LH), or Lower Low (LL) is detected. Users can set up alerts to be notified whenever one of these key market structure patterns forms. Alerts are an essential feature for traders who want to act quickly when important trend changes are happening.
RSI VWAP POC [Uncle Sam Trading]Category: Oscillators, Volume, Market Profile
Timeframe: Suitable for all timeframes
Markets: Crypto, Forex, Stocks, Commodities
Overview
The RSI VWAP POC indicator is a powerful and innovative oscillator that combines the Relative Strength Index (RSI), Volume-Weighted Average Price (VWAP), and Point of Control (POC) from market profile analysis. Designed to provide traders with clear, high-probability trading signals, this indicator helps you identify key market levels, spot overbought/oversold conditions, and time your entries and exits with precision. Whether you’re a day trader, swing trader, or scalper, this free tool adds significant value to your trading strategy by offering a unique blend of momentum, volume, and market profile insights.
How It Works
This indicator integrates three core components to deliver actionable insights:
RSI (Relative Strength Index): Measures momentum to identify overbought (above 70) and oversold (below 30) conditions, helping you anticipate potential reversals.
VWAP (Volume-Weighted Average Price): Calculates a volume-weighted price benchmark, which is used to compute a more accurate, volume-sensitive RSI. This ensures the indicator reflects true market dynamics.
POC (Point of Control): Derived from market profile analysis, the POC represents the price level with the highest traded volume in a session, acting as a critical support or resistance level.
The indicator plots a smoothed RSI based on VWAP, overlaid with market profile data on a user-defined higher timeframe (default: 4H). The POC is displayed as a red line, with aqua bars indicating the value area where the majority of trading volume occurred. When the RSI crosses the POC, the indicator generates clear buy and sell signals:
Strong Buy (SBU): RSI crosses above the POC in an oversold zone.
Strong Sell (SBD): RSI crosses below the POC in an overbought zone.
Additional features include:
Background colors to highlight bullish (green) or bearish (red) trends.
Shaded zones for overbought (70/60) and oversold (30/40) levels.
Customizable settings to fit your trading style and timeframe.
How This Indicator Adds Value
The RSI VWAP POC indicator offers several key benefits that enhance your trading performance:
High-Probability Signals: By combining RSI, VWAP, and POC, this indicator identifies trades at key market levels where price is likely to react, increasing your win rate.
Improved Timing: Clear buy and sell signals, such as ‘SBU’ and ‘SBD’, help you enter and exit trades at optimal points, maximizing profitability.
Risk Management: Overbought/oversold zones and trend confirmation via background colors help you avoid false signals, protecting your capital.
Versatility: Suitable for all markets (crypto, forex, stocks) and timeframes, making it a valuable tool for traders of all experience levels.
Time Efficiency: The indicator does the heavy lifting by analyzing momentum, volume, and market profile data, allowing you to focus on executing trades.
Real-World Performance Example: On a 1-hour Bitcoin chart with a 4-hour higher timeframe, this indicator identified a strong sell signal on April 6th at 12:00 ($82,000), leading to a 9% drop to $74,600. A subsequent strong buy signal on April 7th at 04:00 ($76,200) captured a 6% rise to $81,200 – a potential 25% profit with 5x leverage if exited at 5%.
How to Use
Add the Indicator: Search for “RSI VWAP POC ” in TradingView’s indicator library and add it to your chart.
Set Your Timeframe: The indicator works on any timeframe but is optimized for a 1-hour chart with a 4-hour higher timeframe (set in the settings).
Interpret Signals:
Look for ‘SBU’ (strong buy) labels when the RSI crosses above the POC in an oversold zone, indicating a potential buying opportunity.
Look for ‘SBD’ (strong sell) labels when the RSI crosses below the POC in an overbought zone, signaling a potential selling opportunity.
Use the background colors (green for bullish, red for bearish) to confirm the trend.
Combine with Your Strategy: Use the indicator alongside your existing analysis (e.g., support/resistance, candlestick patterns) for best results.
Settings and Customization
The indicator is highly customizable to suit your trading needs:
RSI Length (Default: 14): Adjust the sensitivity of the RSI. Use a shorter length (e.g., 10) for scalping, or a longer length (e.g., 20) for smoother signals.
EMA Smoothing Length (Default: 3): Smooths the RSI line. Increase to 5 or 7 for less choppy signals in volatile markets.
Higher Timeframe (Default: 240 minutes): Set to 240 (4 hours) for a 1-hour chart. Adjust based on your chart’s timeframe (e.g., 60 minutes for a 15-minute chart).
Value Area Percentage (Default: 100%): Defines the size of the value area around the POC. Lower to 70% for a tighter focus on key levels.
Overbought/Oversold Thresholds (Defaults: 70/30): Adjust these levels to match market conditions (e.g., 80/20 for trending markets).
Show POC Line (Default: True): Toggle the red POC line on or off.
Show Buy/Sell Signals: Enable ‘Show Strong Breakup Signals’ and ‘Show Strong Breakdown Signals’ to focus on high-probability trades.
Why Choose This Indicator?
The RSI VWAP POC indicator stands out by offering a unique combination of momentum, volume, and market profile analysis in a single, easy-to-use tool. It’s designed to help traders of all levels make informed decisions, reduce risk, and increase profitability. Whether you’re trading Bitcoin, forex pairs, or stocks, this indicator provides the clarity and precision you need to succeed.

SMC+The "SMC+" indicator is a comprehensive tool designed to overlay key Smart Money Concepts (SMC) levels, support/resistance zones, order blocks (OB), fair value gaps (FVG), and trap detection on your TradingView chart. It aims to assist traders in identifying potential areas of interest based on price action, swing structures, and volume dynamics across multiple timeframes. This indicator is fully customizable, allowing users to adjust lookback periods, colors, opacity, and sensitivity to suit their trading style.
Key Components and Functionality
1. Key Levels (Support and Resistance)
This section plots horizontal lines representing support and resistance levels based on highs and lows over three distinct lookback periods, plus daily nearest levels.
Short-Term Lookback Period (Default: 20 bars)
Plots the highest high (short_high) and lowest low (short_low) over the specified period.
Visualized as dotted lines with customizable colors (Short-Term Resistance Color, Short-Term Support Color) and opacity (Short-Term Resistance Opacity, Short-Term Support Opacity).
Adjustment Tip: Increase the lookback (e.g., to 30-50) for less frequent but stronger levels on higher timeframes, or decrease (e.g., to 10-15) for scalping on lower timeframes.
Long-Term Lookback Period (Default: 50 bars)
Plots broader support (long_low) and resistance (long_high) levels using a solid line style.
Customizable via Long-Term Resistance Color, Long-Term Support Color, and their respective opacity settings.
Adjustment Tip: Extend to 100-200 bars for swing trading or major trend analysis on daily/weekly charts.
Extra-Long Lookback Period (Default: 100 bars)
Identifies significant historical highs (extra_long_high) and lows (extra_long_low) with dashed lines.
Configurable with Extra-Long Resistance Color, Extra-Long Support Color, and opacity settings.
Adjustment Tip: Use 200-500 bars for monthly charts to capture macro-level key zones.
Daily Nearest Resistance and Support Levels
Dynamically calculates the nearest resistance (daily_res_level) and support (daily_sup_level) based on the current day’s price action relative to historical highs and lows.
Displayed with Daily Resistance Color and Daily Support Color (with opacity options).
Adjustment Tip: Works best on intraday charts (e.g., 15m, 1h) to track daily pivots; combine with volume profile for confirmation.
How It Works: These levels update dynamically as new highs/lows form, providing a visual guide to potential reversal or breakout zones.
2. SMC Inputs (Smart Money Concepts)
This section identifies swing structures, order blocks, fair value gaps, and entry signals based on SMC principles.
SMC Swing Lookback Period (Default: 12 bars)
Defines the period for detecting swing highs (smc_swing_high) and lows (smc_swing_low).
Adjustment Tip: Increase to 20-30 for smoother swings on higher timeframes; reduce to 5-10 for faster signals on lower timeframes.
Minimum Swing Size (%) (Default: 0.5%)
Filters out minor price movements to focus on significant swings.
Adjustment Tip: Raise to 1-2% for volatile markets (e.g., crypto) to avoid noise; lower to 0.2-0.3% for forex pairs with tight ranges.
Order Block Sensitivity (Default: 1.0)
Scales the size of detected order blocks (OBs) for bullish reversal (smc_ob_bull), bearish reversal (smc_ob_bear), and continuation (smc_cont_ob).
Visuals include customizable colors, opacity, border thickness, and blinking effects (e.g., SMC Bullish Reversal OB Color, SMC Bearish Reversal OB Blink Thickness).
Adjustment Tip: Increase to 1.5-2.0 for wider OBs in choppy markets; keep at 1.0 for precision in trending conditions.
Minimum FVG Size (%) (Default: 0.3%)
Sets the minimum gap size for Fair Value Gaps (fvg_high, fvg_low), displayed as boxes with Fair Value Gap Color and FVG Opacity.
Adjustment Tip: Increase to 0.5-1% for larger, more reliable gaps; decrease to 0.1-0.2% for scalping smaller inefficiencies.
How It Works:
Bullish Reversal OB: Detects a bearish candle followed by a bullish break, marking a potential demand zone.
Bearish Reversal OB: Identifies a bullish candle followed by a bearish break, marking a supply zone.
Continuation OB: Spots strong bullish momentum after a prior high, indicating a continuation zone.
FVG: Highlights bullish gaps where price may retrace to fill.
Entry Signals: Plots triangles (SMC Long Entry) when price retests an OB with a liquidity sweep or break of structure (BOS).
3. Trap Inputs
This section detects potential bull and bear traps based on price action, volume, and key level rejections.
Min Down Move for Bear Trap (%) (Default: 1.0%)
Sets the minimum drop required after a bearish OB to qualify as a trap.
Visualized with Bear Trap Color, Bear Trap Opacity, and blinking borders.
Adjustment Tip: Increase to 2-3% for stronger traps in trending markets; lower to 0.5% for ranging conditions.
Min Up Move for Bull Trap (%) (Default: 1.0%)
Sets the minimum rise required after a bullish OB to flag a trap.
Customizable with Bull Trap Color, Bull Trap Border Thickness, etc.
Adjustment Tip: Adjust similarly to bear traps based on market volatility.
Volume Lookback for Traps (Default: 5 bars)
Compares current volume to a moving average (avg_volume) to filter low-volume traps.
Adjustment Tip: Increase to 10-20 for confirmation on higher timeframes; reduce to 3 for intraday sensitivity.
How It Works:
Bear Trap: Triggers when price drops significantly after a bearish OB but reverses up with low volume or support rejection.
Bull Trap: Activates when price rises after a bullish OB but fails with low volume or resistance rejection.
Boxes highlight trap zones, resetting when price breaks out.
4. Visual Customization
Line Width (Default: 2)
Adjusts thickness of support/resistance lines.
Tip: Increase to 3-4 for visibility on cluttered charts.
Blink On (Default: Close)
Sets whether OB/FVG borders blink based on Open or Close price interaction.
Tip: Use "Open" for intraday precision; "Close" for confirmed reactions.
Colors and Opacity: Each element (OBs, FVGs, traps, key levels) has customizable colors, opacity (0-100), border thickness (1-5 or 1-7), and blink effects for dynamic visualization.
How to Use SMC+
Setup: Apply the indicator to any chart and adjust inputs based on your timeframe and market.
Key Levels: Watch for price reactions at short, long, extra-long, or daily levels for potential reversals or breakouts.
SMC Signals: Look for entry signals (triangles) near OBs or FVGs, confirmed by liquidity sweeps or BOS.
Traps: Avoid false breakouts by monitoring trap boxes, especially near key levels with low volume.
Notes:
This indicator is a visual aid and does not guarantee trading success. Combine it with other analysis tools and risk management strategies.
Performance may vary across markets and timeframes; test settings thoroughly before use.
For optimal results, experiment with lookback periods and sensitivity settings to match your trading style.
The default settings are optimal for 1 minute and 10 second time frames for small cap low float stocks.
Continuation OB are Blue.
Bullish Reversal OB color is Green
Bearish Reversal OB color is Red
FVG color is purple
Bear Trap OB is red with a green border and often appears with a Bearish Reversal OB signaling caution to a short position.
Bull trap OB is green with a Red border signaling caution to a long position.
All active OB area are highlighted and solid in color while other non active OB area are dimmed.
My personal favorite setups are when we have an active bullish reversal with an active FVG along with an active Continuation OB.
Another personal favorite is the Bearish reversal OB signaling an end to a recent uptrend.
The Trap OB detection are also a unique and Original helpful source of information.
The OB have a white boarder by default that are colored black giving a simulated blinking effect when price is acting in that zone.
The Trap OB border are colored with respect to direction of intended trap, all of which can be customized to personal style.
All vaild OB zones are shown compact in size ,a unique and original view until its no longer valid.

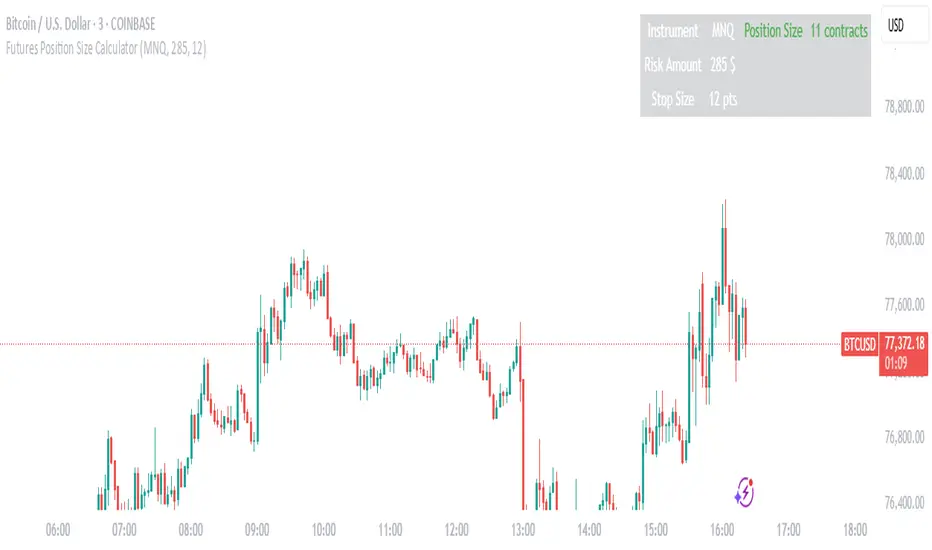
Futures Position Size CalculatorFutures Position Size Calculator by vmkhats
Streamline your futures trading risk management with this intuitive Pine Script utility designed for TradingView. Created by vmkhats, this tool automates position sizing calculations for popular futures contracts, ensuring precise risk control while eliminating manual errors.
Key Features:
Supports 15+ Instruments: Trade confidently with preconfigured settings for indices (ES, NQ, RTY), commodities (CL, GC), currencies (6E), and micro contracts (MES, MNQ, MCL).
Customizable Inputs: Set your risk amount (e.g., $1,000) and stop-loss size in points, tailored to your strategy.
Automatic Calculations: The script computes stop-loss size in ticks, risk per contract, and optimal position size using floor rounding to prevent over-leveraging.
Clear Visual Output: A table displays results (instrument, risk, stop size, contracts) with color-coded alerts for invalid configurations (e.g., zero position size).
Ideal for both novice and seasoned traders, this utility enforces disciplined risk management while saving time. Enhance your TradingView workspace with this essential tool and trade futures with confidence.
Created by vmkhats — ensuring traders stay precise, proactive, and risk-aware.
Dynamic Volume Profile PoC SwiftedgeOverview
The Dynamic Volume Profile PoC is a powerful and visually intuitive indicator designed to help traders identify key support and resistance levels using a unique combination of pivot points, volume analysis, and dynamic Point of Control (PoC) levels. This script overlays directly on your chart, providing clear visual cues for potential breakout and rejection zones, making it easier to spot high-probability trading opportunities.
What It Does
This indicator combines three core components to deliver actionable insights:
Pivot Points: Identifies significant swing highs and lows to establish potential support and resistance levels.
Volume Oscillator: Measures volume momentum to confirm the strength of price movements, ensuring that breakouts or rejections are backed by significant volume.
Dynamic Point of Control (PoC): Calculates the midpoint between consecutive pivot points to create dynamic PoC levels, which act as key areas where price is likely to either break through (breakout) or reverse (rejection).
These components work together to highlight critical price levels where the market is likely to react, giving traders a clear framework for decision-making.
How It Works
Pivot Detection: The script uses pivot highs and lows (based on user-defined Left Bars and Right Bars) to identify significant price levels. These pivots form the foundation for calculating PoC levels.
PoC Calculation: Each time a new pivot is detected, the script calculates the midpoint between the current pivot and the previous pivot, creating a dynamic PoC level. These levels are plotted as horizontal lines on the chart, with a maximum of Max PoC Lines to Show (default: 2) visible at any time.
Volume Confirmation: A volume oscillator (short EMA of volume minus long EMA of volume) is used to filter breakouts and rejections. Breakouts or rejections are only signaled if the volume oscillator exceeds the Volume Threshold (default: 20), ensuring that price movements are supported by strong volume.
Visual Cues:
PoC levels are drawn as cyan lines with optional semi-transparent zones (controlled by Show PoC Zones). These zones are colored green for potential breakouts (price above PoC) and red for potential rejections (price below PoC).
Labels above and below each PoC level indicate trading opportunities: "Long if breakout"/"Long if rejected" (green) and "Short if breakout"/"Short if rejected" (red), depending on the price's direction relative to the PoC.
Break signals ("B") are plotted above or below bars when price crosses a pivot level with sufficient volume, colored red for downward breaks and green for upward breaks.
How to Use
Add the Indicator: Add the "Dynamic Volume Profile PoC " to your chart in TradingView.
Adjust Settings:
Left Bars and Right Bars (default: 15): Control the sensitivity of pivot detection. Lower values make the script more sensitive to smaller price swings.
Volume Threshold (default: 20): Set the minimum volume oscillator value required to confirm breakouts or rejections. Increase this for stricter confirmation.
Max PoC Lines to Show (default: 2): Define how many PoC levels are displayed at once.
Show PoC Zones (default: true): Toggle semi-transparent zones around PoC levels for better visualization.
Label Spacing Factor (default: 0.5): Adjust the vertical spacing between labels and the PoC box. Increase this value (e.g., to 1.0 or 2.0) for more spacing, or decrease it (e.g., to 0.3) for less.
Interpret the Signals:
Look for PoC levels (cyan lines) as key areas of interest.
Use the labels to identify potential trades: "Long if breakout" indicates a buy opportunity if price breaks above the PoC, while "Short if rejected" suggests a sell if price fails to break through.
Watch for "B" signals to confirm breakouts or rejections with volume support.
Combine with Your Strategy: Use the PoC levels and break signals as part of your broader trading strategy, such as trend-following or mean-reversion setups.
Why This Script is Unique
The Dynamic Volume Profile PoC stands out by combining pivot points, volume analysis, and dynamic PoC levels into a single, cohesive tool. Unlike traditional volume profile indicators that require a fixed range, this script dynamically updates PoC levels based on recent price action, making it more responsive to current market conditions. The addition of volume confirmation ensures that signals are backed by market participation, reducing false breakouts. The visually appealing design, with customizable spacing and semi-transparent zones, makes it easy to interpret key levels at a glance, even for traders unfamiliar with Pine Script.
Notes
This script works best on timeframes where pivot points are meaningful (e.g., 1H, 4H, or daily charts).
Adjust the Label Spacing Factor to ensure labels are well-spaced for your chart's zoom level and instrument.
For instruments with high volatility, you may need to increase the Volume Threshold to filter out noise.

Simple Fundamental Analysis Fundamental Analysis
This indicator provides comprehensive fundamental analysis directly on your chart, displaying key financial metrics in a color-coded table format. It goes beyond basic metrics by calculating fair value estimates and generating buy/sell signals based on overall fundamental health.
Key features:
14 essential fundamental metrics including EPS, P/E Ratio, PEG Ratio, and valuation ratios
Fair value calculation (PE × EPS) showing potential under/overvaluation
Value gap percentage to quickly identify investment opportunities
Color-coded values (green for healthy, red for concerning)
Automatic buy/sell/neutral signals based on overall fundamental analysis
Percentage rating showing the strength of buy/sell signals
This tool helps traders and investors make informed decisions based on fundamental data rather than just technical indicators. Perfect for value investors looking to identify fundamentally sound companies trading at attractive prices.
Disclaimer
This indicator is provided for informational and educational purposes only. The buy/sell signals and fundamental analysis presented are not investment advice or recommendations to buy, sell, or hold any security.
The financial data used is sourced from TradingView's database and may not always be current or accurate. Some metrics may be unavailable for certain stocks, which could affect the overall rating. Different industries have different norms for "good" metrics - what's healthy for one sector may not be for another.
The fair value calculation uses a standard PE ratio of 15, which may not be appropriate for all companies or industries. High-growth companies typically command higher multiples, while mature companies may trade at lower multiples.
Past performance is not indicative of future results. Always conduct your own research and consider consulting a financial advisor before making investment decisions.

Smarter Money Concepts - OBs [PhenLabs]📊 Smarter Money Concepts - OBs
Version: PineScript™ v6
📌 Description
Smarter Money Concepts - OBs (Order Blocks) is an advanced technical analysis tool designed to identify and visualize institutional order zones on your charts. Order blocks represent significant areas of liquidity where smart money has entered positions before major moves. By tracking these zones, traders can anticipate potential reversals, continuations, and key reaction points in price action.
This indicator incorporates volume filtering technology to identify only the most significant order blocks, eliminating low-quality signals and focusing on areas where institutional participation is likely present. The combination of price structure analysis and volume confirmation provides traders with high-probability zones that may attract future price action for tests, rejections, or breakouts.
🚀 Points of Innovation
Volume-Filtered Block Detection : Identifies only order blocks formed with significant volume, focusing on areas with institutional participation
Advanced Break of Structure Logic : Uses sophisticated price action analysis to detect legitimate market structure breaks preceding order blocks
Dynamic Block Management : Intelligently tracks, extends, and removes order blocks based on price interaction and time-based expiration
Structure Recognition System : Employs technical analysis algorithms to find significant swing points for accurate order block identification
Dual Directional Tracking : Simultaneously monitors both bullish and bearish order blocks for comprehensive market structure analysis
🔧 Core Components
Order Block Detection : Identifies institutional entry zones by analyzing price action before significant breaks of structure, capturing where smart money has likely positioned before moves.
Volume Filtering Algorithm : Calculates relative volume compared to a moving average to qualify only order blocks formed with significant market participation, eliminating noise.
Structure Break Recognition : Uses price action analysis to detect legitimate breaks of market structure, ensuring order blocks are identified only at significant market turning points.
Dynamic Block Management : Continuously monitors price interaction with existing blocks, extending, maintaining, or removing them based on current market behavior.
🔥 Key Features
Volume-Based Filtering : Filter out insignificant blocks by requiring a minimum volume threshold, focusing only on zones with likely institutional activity
Visual Block Highlighting : Color-coded boxes clearly mark bullish and bearish order blocks with customizable appearance
Flexible Mitigation Options : Choose between “Wick” or “Close” methods for determining when a block has been tested or mitigated
Scan Range Adjustment : Customize how far back the indicator looks for structure points to adapt to different market conditions and timeframes
Break Source Selection : Configure which price component (close, open, high, low) is used to determine structure breaks for precise block identification
🎨 Visualization
Bullish Order Blocks : Blue-colored rectangles highlighting zones where bullish institutional orders were likely placed before upward moves, representing potential support areas.
Bearish Order Blocks : Red-colored rectangles highlighting zones where bearish institutional orders were likely placed before downward moves, representing potential resistance areas.
Block Extension : Order blocks extend to the right of the chart, providing clear visualization of these significant zones as price continues to develop.
📖 Usage Guidelines
Order Block Settings
Scan Range : Default: 25. Defines how many bars the indicator scans to determine significant structure points for order block identification.
Bull Break Price Source : Default: Close. Determines which price component is used to detect bullish breaks of structure.
Bear Break Price Source : Default: Close. Determines which price component is used to detect bearish breaks of structure.
Visual Settings
Bullish Blocks Color : Default: Blue with 85% transparency. Controls the appearance of bullish order blocks.
Bearish Blocks Color : Default: Red with 85% transparency. Controls the appearance of bearish order blocks.
General Options
Block Mitigation Method : Default: Wick, Options: Wick, Close. Determines how block mitigation is calculated - “Wick” uses high/low values while “Close” uses close values for more conservative mitigation criteria.
Remove Filled Blocks : Default: Disabled. When enabled, order blocks are removed once they’ve been mitigated by price action.
Volume Filter
Volume Filter Enabled : Default: Enabled. When activated, only shows order blocks formed with significant volume relative to recent average.
Volume SMA Period : Default: 15, Range: 1-50. Number of periods used to calculate the average volume baseline.
Min. Volume Ratio : Default: 1.5, Range: 0.5-10.0. Minimum volume ratio compared to average required to display an order block; higher values filter out more blocks.
✅ Best Use Cases
Identifying high-probability support and resistance zones for trade entries and exits
Finding optimal stop-loss placement behind significant order blocks
Detecting potential reversal areas where price may react after extended moves
Confirming breakout trades when price clears major order blocks
Building a comprehensive market structure map for medium to long-term trading decisions
Pinpointing areas where smart money may have positioned before major market moves
⚠️ Limitations
Most effective on higher timeframes (1H and above) where institutional activity is more clearly defined
Can generate multiple signals in choppy market conditions, requiring additional filtering
Volume filtering relies on accurate volume data, which may be less reliable for some securities
Recent market structure changes may invalidate older order blocks not yet automatically removed
Block identification is based on historical price action and may not predict future behavior with certainty
💡 What Makes This Unique
Volume Intelligence : Unlike basic order block indicators, this script incorporates volume analysis to identify only the most significant institutional zones, focusing on quality over quantity.
Structural Precision : Uses sophisticated break of structure algorithms to identify true market turning points, going beyond simple price pattern recognition.
Dynamic Block Management : Implements automatic block tracking, extension, and cleanup to maintain a clean and relevant chart display without manual intervention.
Institutional Focus : Designed specifically to highlight areas where smart money has likely positioned, helping retail traders align with institutional perspectives rather than retail noise.
🔬 How It Works
1. Structure Identification Process :
The indicator continuously scans price action to identify significant swing points and structure levels within the specified range, establishing a foundation for order block recognition.
2. Break Detection :
When price breaks an established structure level (crossing below a significant low for bearish breaks or above a significant high for bullish breaks), the indicator marks this as a potential zone for order block formation.
3. Volume Qualification :
For each potential order block, the algorithm calculates the relative volume compared to the configured period average. Only blocks formed with volume exceeding the minimum ratio threshold are displayed.
4. Block Creation and Management :
Valid order blocks are created, tracked, and managed as price continues to develop. Blocks extend to the right of the chart until they are either mitigated by price action or expire after the designated timeframe.
5. Continuous Monitoring :
The indicator constantly evaluates price interaction with existing blocks, determining when blocks have been tested, mitigated, or invalidated, and updates the visual representation accordingly.
💡 Note:
Order Blocks represent areas where institutional traders have likely established positions and may defend these zones during future price visits. For optimal results, use this indicator in conjunction with other confluent factors such as key support/resistance levels, trendlines, or additional confirmation indicators. The most reliable signals typically occur on higher timeframes where institutional activity is most prominent. Start with the default settings and adjust parameters gradually to match your specific trading instrument and style.

Bull Bear Pivot by RawstocksThe "Bull Bear Pivot" indicator is a custom Pine Script (v5) tool designed for TradingView to assist traders in identifying key price levels and pivot points on intraday charts (up to 1-hour timeframes). It combines time-based open price markers, pivot high/low detection, and candlestick visualization to provide a comprehensive view of potential support, resistance, and trend reversal levels. Below is a detailed description of the indicator’s functionality, features, and intended use.
Indicator Overview:
The "Bull Bear Pivot" indicator is tailored for intraday trading, focusing on specific times of the day to mark significant price levels (open prices) and detect pivot points. It plots horizontal lines at the open prices of user-defined sessions, identifies pivot highs and lows on the current chart timeframe, and overlays custom candlesticks to highlight price action. The indicator is designed to work on timeframes of 1 hour or less (e.g., 1-minute, 3-minute, 5-minute, 15-minute, 30-minute, 60-minute) and includes a warning mechanism for invalid timeframes.
Key Features:
Time-Based Open Price Markers:
The indicator allows users to define up to five time-based sessions (e.g., 4:00 AM, 8:30 AM, 9:30 AM, 10:00 AM, and a custom time) to capture the open price at the start of each session.
For each session, it plots a horizontal line at the 1-minute open price, extending from the session start to the market close at 4:00 PM EST.
Each line is accompanied by a label positioned 5 bars to the right of the market close (4:00 PM EST), with the text right-aligned and vertically centered on the line.
Users can enable/disable each marker, customize the session time, label text, line color, and text color via the indicator’s settings.
Pivot Highs and Lows:
The indicator calculates pivot highs and lows on the current chart timeframe using the ta.pivothigh and ta.pivotlow functions.
Pivot highs are marked with green triangles above the bars, and pivot lows are marked with red triangles below the bars.
The pivot period (lookback/lookforward) is user-configurable, allowing flexibility in detecting short-term or longer-term reversals.
Custom Candlesticks:
The indicator overlays custom candlesticks on the chart, colored green for bullish candles (close > open) and red for bearish candles (close < open).
This feature helps visualize price action alongside the open price markers and pivot points.
Timeframe Restriction:
The indicator is designed to work on timeframes of 1 hour or less. If the chart timeframe exceeds 1 hour (e.g., 4-hour, daily), a warning label ("Timeframe > 1H\nIndicator Disabled") is displayed, and no elements are plotted.
Customizable Appearance:
Users can customize the appearance of the open price marker lines, including the line style (solid, dashed, dotted) and line width.
Labels for the open price markers have no background (transparent) and use customizable text colors.
