Pure Morning 2.0 - Candlestick Pattern Doji StrategyThe new "Pure Morning 2.0 - Candlestick Pattern Doji Strategy" is a trend-following, intraday cryptocurrency trading system authored by devil_machine.
The system identifies Doji and Morning Doji Star candlestick formations above the EMA60 as entry points for long trades.
For best results we recommend to use on 15-minute, 30-minute, or 1-hour timeframes, and are ideal for high-volatility markets.
The strategy also utilizes a profit target or trailing stop for exits, with stop loss set at the lowest low of the last 100 candles. The strategy's configuration details, such as Doji tolerance, and exit configurations are adjustable.
In this new version 2.0, we've incorporated a new selectable filter. Since the stop loss is set at the lowest low, this filter ensures that this value isn't too far from the entry price, thereby optimizing the Risk-Reward ratio.
In the specific case of ALPINE, a 9% Take-Profit and and Stop-Loss at Lowest Low of the last 100 candles were set, with an activated trailing-stop percentage, Max Loss Filter is not active.
Name : Pure Morning 2.0 - Candlestick Pattern Doji Strategy
Author : @devil_machine
Category : Trend Follower based on candlestick patterns.
Operating mode : Spot or Futures (only long).
Trades duration : Intraday
Timeframe : 15m, 30m, 1H
Market : Crypto
Suggested usage : Short-term trading, when the market is in trend and it is showing high volatility .
Entry : When a Doji or Morning Doji Star formation occurs above the EMA60.
Exit : Profit target or Trailing stop, Stop loss on the lowest low of the last 100 candles.
Configuration :
- Doji Settings (tolerances) for Entry Condition
- Max Loss Filter (Lowest Low filter)
- Exit Long configuration
- Trailing stop
Backtesting :
⁃ Exchange: BINANCE
⁃ Pair: ALPINEUSDT
⁃ Timeframe: 30m
⁃ Fee: 0.075%
⁃ Slippage: 1
- Initial Capital: 10000 USDT
- Position sizing: 10% of Equity
- Start: 2022-02-28 (Out Of Sample from 2022-12-23)
- Bar magnifier: on
Disclaimer : Risk Management is crucial, so adjust stop loss to your comfort level. A tight stop loss can help minimise potential losses. Use at your own risk.
How you or we can improve? Source code is open so share your ideas!
Leave a comment and smash the boost button!
Thanks for your attention, happy to support the TradingView community.
Cerca negli script per "美联储议息会议12月时间"

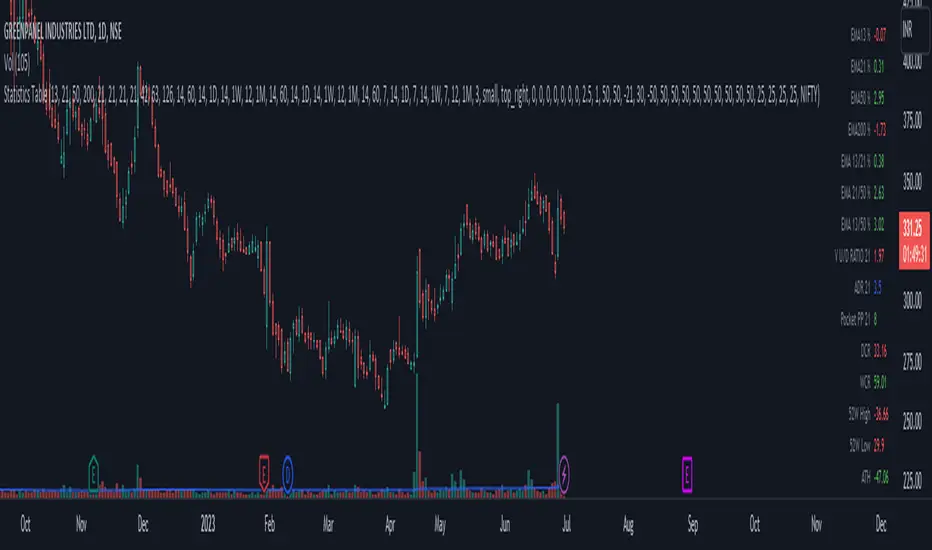
Statistics TableThis script display some useful Statistics data that can be useful in making trading decision.
Here the list of information this script is display in table format.
You can change each and every single ema and rs length as per your need from setting.
1) close difference from first ema
2) close difference from second ema
3) close difference from third ema
4) close difference from fourth ema
5) difference between first and second ema
6) difference between second and third ema
7) difference between first and third ema
8) volume up down ratio
9) ATR/ADR %
10) volume pocket pivot count
11) daily closing range
12) weekly closing range
13) close difference from 52week high
14) close difference from 52week low
15) close difference from All time high
16) close difference from All time low
17) rs line above or below first rs ema
18) rs line above or below second rs ema
19) rs line above or below third rs ema
20) rs line above or below fourth rs ema
21) first rs value
22) second rs value
23) third rs value
24) fourth rs value
25) difference between previous first rs length days change % and current first rs length days change %
26) difference between previous second rs length days change % and current second rs length days change %
27) difference between previous third rs length days change % and current third rs length days change %
ICT Commitment of Traders° by toodegreesDescription:
The Commitment of Traders (COT) is a valuable raw data report released weekly by the Commodity Futures Trading Commission (CFTC). This report offers insights into the current long and short positions of three key market entities:
Commercial Traders ( usually represented in red )
Large Traders ( typically depicted in green )
Small Speculator Traders ( commonly shown in blue )
The concept of utilizing the COT data as a strategic trading tool was first introduced by Larry Williams, who emphasized the importance of monitoring Commercial Speculators – large corporate producers or consumers of commodities.
The Inner Circle Trader (ICT) prompts us to delve deeper into this data. While we can easily determine their Net Position (also referred to as the Main Program) by subtracting Commercial Short Positions from the Commercial Long Positions, this calculation doesn't reveal their ongoing Hedge Program .
Merely following the Main Program won't provide a trading edge. Aligning with the Hedge Program can be an invaluable weapon in your trading arsenal.
The Commercial Speculators' Hedge Program can be unveiled by examining the highest and lowest reading of their Net Position over a chosen time period and setting a new "zero line" between these extremes. This process generates a novel "COT Graph" providing a detailed understanding of the Commercial Speculators' current market activity.
When the Hedge Program, Seasonality, and Open Interest are cross-referenced with Institutional Orderflow, a trader can construct a very clear medium-to-long-term market narrative.
Features:
Access COT Data for the Commercial Speculators via Tradingview's reliable data source
Automate calculations and display the 3-month, 6-month, 12-month, 2-year, and 3-year Hedge Program
Define your own Custom Time Range for the Hedge Program
Display the Main Program and all Hedge Programs in an easy-to-understand table format
Additionally, by following the included instructions, you can augment your table with COT data from multiple markets. This extra information can help monitor correlated markets and develop a more robust market narrative:

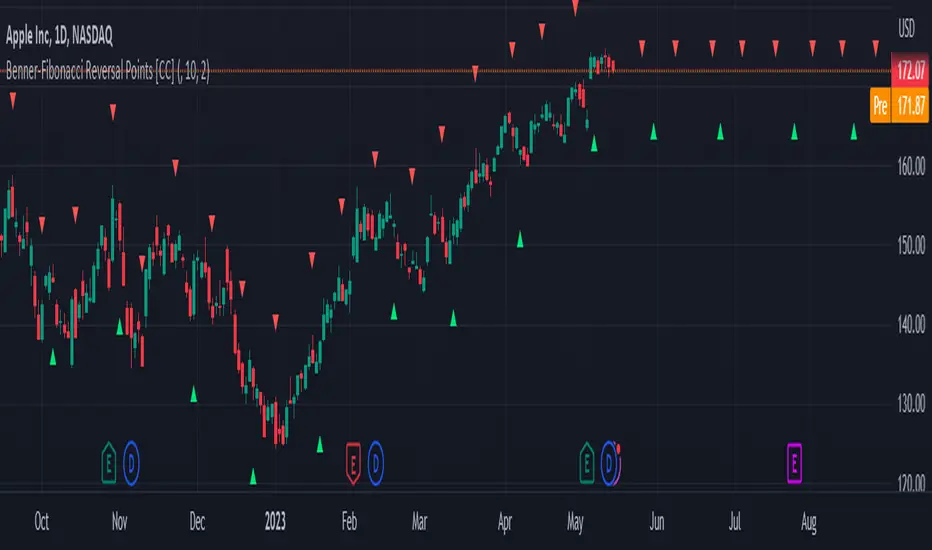
Benner-Fibonacci Reversal Points [CC]This is an original script based on a very old idea called the Benner Theory from the Civil War times. Benner discovered a pattern in pig iron prices (no clue what those are), and this turned out to be a parallel idea to indicators based on Fibonacci numbers. Because a year is 365 days (nearly 377, which is a Fibonacci number), made up of 52 weeks (nearly 55, which is another Fibonacci number), or 12 months (nearly 13, which is another Fibonacci number), Benner theorized that he could find both past and future turning points in the market by using a pattern he found. He discovered that peaks in prices seemed to follow a pattern of 8-9-10, meaning that after a recent peak, it would be 8 bars until the next peak, 9 bars until after that peak for the next, and 10 bars until the following peak. For past peaks, he would just need to reverse this pattern, and so the previous peak would be 10 bars before the most current peak, 9 bars before that peak, and 8 bars before the previous one, and these patterns seemed to repeat. For troughs, he found a pattern of 16,18,20 which follows the same logic, and this idea also seemed to work on long-term peaks and troughs as well.
This is my version of the Benner theory and the major difference between my version and his is that he would manually select a year or date and either work backwards or forwards from that point. I chose to go with an adaptive version that will automatically detect those points and plot those past and future points. I have included several options such as allowing the algorithm to be calculated in reverse which seems to work well for Crypto for some reason. I also have both short and long term options to only show one or both if you choose and of course the option to enable repainting or leave it disabled.
Big thanks to @HeWhoMustNotBeNamed and @RicardoSantos for helping me fix some bugs in my code and for @kerpiciwuasile for suggesting this idea in the first place.
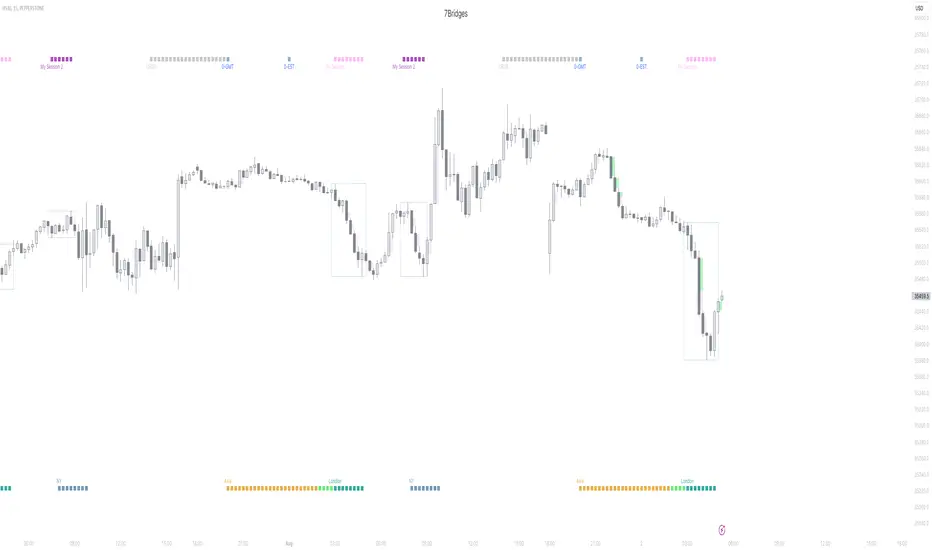
Session KillZones [7Bridges]Session Killzones by 7Bridges indicator display the killzones of asian, LND and NY sessions. There is also a custom session of your choice.
The times of each killzone are GMT time and you can adjust it in the settings.
You have also the beginning of the day, GMT and EST timezones.
By default the killzones are set like that on the GMT/UTC timezone :
-> Asia : 00:00 - 06:00
-> Pre London : 06:00 - 07:00
-> London : 07:00 - 10:00
-> New York : 12:00 - 15:00
-> Custom session : choose your own time
What makes the indicator very different is that the session is not overlapping the price but you have bars below and above the price.
Settings:
-> you can chose to display the Killzones (Asia, pre LND, LND and NY)
-> you can manages the time of the sessions
-> you can chose to display the start of the day (GMT/UTC and EST )
The indicator is displayed by default only for all the timeframes below 60min.
RSI, SRSI, MACD and DMI cross - Open source codeHello,
I'm a passionate trader who has spent years studying technical analysis and exploring different trading strategies. Through my research, I've come to realize that certain indicators are essential tools for conducting accurate market analysis and identifying profitable trading opportunities. In particular, I've found that the RSI, SRSI, MACD cross, and Di cross indicators are crucial for my trading success.
Detailed explanation:
The RSI is a momentum indicator that measures the strength of price movements. It is calculated by comparing the average of gains and losses over a certain period of time. In this indicator, the RSI is calculated based on the close price with a length of 14 periods.
The Stochastic RSI is a combination of the Stochastic Oscillator and the RSI. It is used to identify overbought and oversold conditions of the market. In this indicator, the Stochastic RSI is calculated based on the RSI with a length of 14 periods.
The MACD is a trend-following momentum indicator that shows the relationship between two moving averages of prices. It consists of two lines, the MACD line and the signal line, which are used to generate buy and sell signals. In this indicator, the MACD is calculated based on the close price with fast and slow lengths of 12 and 26 periods, respectively, and a signal length of 9 periods.
The DMI is a trend-following indicator that measures the strength of directional movement in the market. It consists of three lines, the Positive Directional Indicator (+DI), the Negative Directional Indicator (-DI), and the Average Directional Index (ADX), which are used to generate buy and sell signals. In this indicator, the DMI is calculated with a length of 14 periods and an ADX smoothing of 14 periods.
The indicator generates buy signals when certain conditions are met for each of these indicators.
1) For the RSI, a buy signal is generated when the RSI is below or equal to 35 and the Stochastic RSI %K is below or equal to 15, or when the RSI is below or equal to 28 the Stochastic RSI %K is below or equal to 15 or when the RSI is below or equal to 25 and the Stochastic RSI %K is below or equal to 10 or when the RSI is below or equal to 28.
2) For the MACD, a buy signal is generated when the MACD line is below 0, there is a change in the histogram from negative to positive, the MACD line and histogram are negative in the previous period, and the current histogram value is greater than 0.
3) For the DMI, a buy signal is generated when the Positive Directional Indicator (+DI) crosses above the Negative Directional Indicator (-DI), and the -DI is less than the +DI.
The indicator generates sell signals when certain conditions are met for each of these indicators:
1) For the RSI, a sell signal is generated when the RSI is above or equal to 75 and the Stochastic RSI %K is above or equal to 85, or when the RSI is above or equal to 80 and the Stochastic RSI %K is above or equal to 85, or when the RSI is above or equal to 85 and the Stochastic RSI %K is above or equal to 90 or when the RSI is above or equal to 82.
2)For the MACD, a sell signal is generated when the MACD line is above 0, there is a change in the histogram from positive to negative, the MACD line and histogram are positive in the previous period, and the current histogram value is less than the previous histogram value. On the other hand, a buy signal is generated when the MACD line is below 0, there is a change in the histogram from negative to positive, the MACD line and histogram are negative in the previous period, and the current histogram value is greater than the previous histogram value.
3)For the DMI a bearish signal is generated when plusDI crosses above minusDI, indicating that bulls are losing strength and bears are taking control.
The indicator uses a combination of these four indicators to generate potential buy and sell signals. The buy signals are generated when RSI and SRSI values are in oversold conditions, while sell signals are generated when RSI and SRSI values are in overbought conditions. The indicator also uses MACD crossovers and DMI crossovers to generate additional buy and sell signals.
When a signal is strong?
The use of multiple signals within a specific timeframe can increase the accuracy and reliability of the signals generated by this indicator. It is recommended to look for at least two signals within a range of 5-8 candles in order to increase the probability of a successful trade.
Why it's original?
1) There is no indicator in the library that combine all of these indicators and give you a 360 view
2)The combination of the RSI, Stochastic RSI, MACD, and DMI indicators in a single script it's unique and not available in the libray.
3)The specific parameters and conditions used to calculate the signals may be unique and not found in other scripts or libraries.
4)The use of plotshape() to plot the signals as shapes on the chart may be unique compared to other scripts that simply plot lines or bars to indicate signals.
5)The use of alertcondition() to trigger alerts based on the signals may be unique compared to other scripts that do not have custom alert functionality.
Keep attention!
It is important to note that no trading indicator or strategy is foolproof, and there is always a risk of losses in trading. While this indicator may provide useful information for making conclusions, it should not be used as the sole basis for making trading decisions. Traders should always use proper risk management techniques and consider multiple factors when making trading decisions.
Support me:)
If you find this new indicator helpful in your trading analysis, I would greatly appreciate your support! Please consider giving it a like, leaving feedback, or sharing it with your trading network. Your engagement will not only help me improve this tool but will also help other traders discover it and benefit from its features. Thank you for your support!

ICT Macros [LuxAlgo]The ICT Macros indicator aims to highlight & classify ICT Macros, which are time intervals where algorithmic trading takes place to interact with existing liquidity or to create new liquidity.
🔶 SETTINGS
🔹 Macros
Macro Time options (such as '09:50 AM 10:10'): Enable specific macro display.
Top Line , Mid Line , Bottom Line and Extending Lines options: Controls the lines for the specific macro.
🔹 Macro Classification
Length : A length to detect Market Structure Brakes and classify macro type based on detection.
Swing Area : Swing or Liquidity Area selection, highest/lowest of the wick or the candle bodies.
Accumulation , Manipulation and Expansion color options for the classified macros.
🔹 Others
Macro Texts : Controls both the size and the visibility of the macro text.
Alert Macro Times in Advance (Minutes) : This option will plot a vertical line presenting the start of the next macro time. The line will not appear all the time, but it will be there based on remaining minutes specified in the option.
Daylight Saving Time (DST) : Adjust time appropriate to Daylight Saving Time of the specific region.
🔶 USAGE
A macro is a way to automate a task or procedure which you perform on a regular basis.
In the context of ICT's teachings, a macro is a small program or set of instructions that unfolds within an algorithm, which influences price movements in the market. These macros operate at specific times and can be related to price runs from one level to another or certain market behaviors during specific time intervals. They help traders anticipate market movements and potential setups during specific time intervals.
To trade these effectively, it is important to understand the time of day when certain macros come into play, and it is strongly advised to introduce the concept of liquidity in your analysis.
Macros can be classified into three categories where the Macro classification is calculated based on the Market Structure prior to macro and the Market Structure during the macro duration:
Manipulation Macro
Manipulation macros are characterized by liquidity being swept both on the buyside and sellside.
Expansion Macro
Expansion macros are characterized by liquidity being swept only on the buyside or sellside. Prices within these macros are highly correlated with the overall trend.
Accumulation Macro
Accumulation macros are characterized by an accumulation of liquidity. Prices within these macros tend to range.
The script returns the maximum/minimum price values reached during the macro interval alongside the average between the maximum/minimum and extends them until a new macro starts. These levels can act as supports and resistances.
🔶 DETAILS
All required data for the macro detection and classification is retrieved using 1 minute data sets, this includes candles as well as pivot/swing highs and lows. This approach guarantees the visually presented objects are same (same highs/lows) on higher timeframes as well as the macro classification remain same as it is in 1 min charts.
8 Macros can be displayed by the script (4 are enabled by default):
02:33 AM 03:00 London Macro
04:03 AM 04:30 London Macro
08:50 AM 09:10 New York Macro
09:50 AM 10:10 New York Macro
10:50 AM 11:10 New York Macro
11:50 AM 12:10 New York Launch Macro
13:10 PM 13:40 New York Macro
15:15 PM 15:45 New York Macro
🔶 ALERTS
When an alert is configured, the user will have the ability to be notified in advance of the next Macro time, where the value specified in 'Alert Macro Times in Advance (Minutes)' option indicates how early to be notified.
🔶 LIMITATIONS
The script is supported on 1 min, 3 mins and 5 mins charts.
🔶 RELATED SCRIPTS

PSESS1 - Learn PineScript InputsThis is a script written exclusively for people who are trying to learn Pine Script.
PSESS stands for "Pine Script Educational Script Series" which is a series of scripts that helps Pine Script programmers in 2 ways:
1. Learn Pine Script at more depth by an interactive environment where they can immediately see the effects of any change in the pre-written code and also comparing different lines code having tiny differences so they can grasp the details.
2. Have this script open while coding in order to copy the line they find useful
Pine Script Library couldn't be used for this purpose since this script has educational aspect and needs to be executable individually.
This is Script 1 of PSESS and focuses on inputs in Pine Script.
The script is densly commented in order to make it understandable. here is the outline of the script:
1. Inputs that can be received through the indicator() function
2. 12 possible types of input
3. Input() function arguments: defval - title - tooltip - inline - group - confirm
4. The different display of tooltip when inputs are inline
5. Multiple price and time inputs (on single request or multiple requests)
6. What happens when title argument is not specified
7. References and key points from them

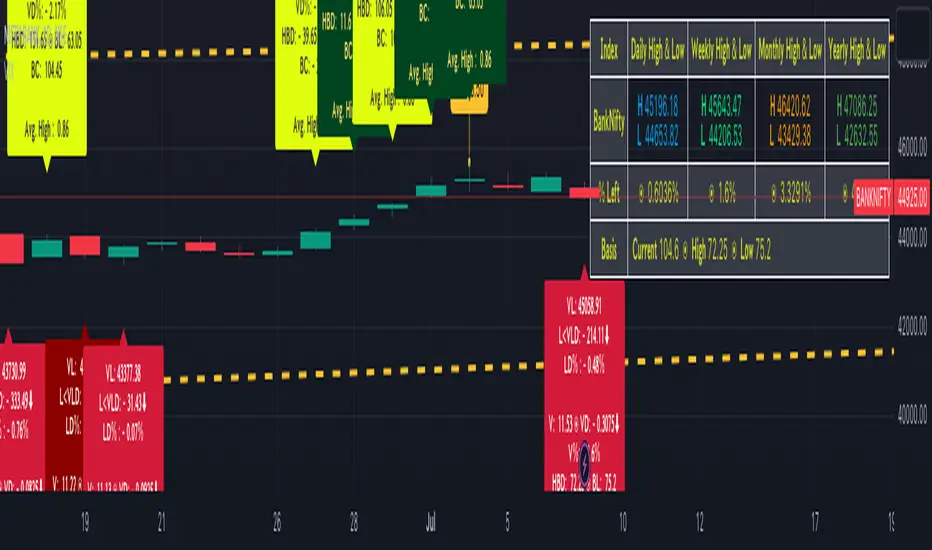
BankNifty targets using VIX Version 2Original Idea Credit: Verified Market Waves
Hi,
After watching different videos online on how to get targets of BankNifty & Nifty decided to write this small script using VIX.
Nothing great but I really like the concept of getting high and low targets for the day or weekly or monthly or yearly.
What does the script do
1. We get closing of India Vix & BankNifty and Nifty
2. We get square root of Daily (365 days) | Weekly (52) | Monthly (12) & Yearly (1)
3. We divide India Vix closing with different square root to get a decimal value.
4. We use the derived value from step 3 which is used as % to calculate high and low values on BankNifty close price.
Small explanation via below screen shot to understand how to use it.
As always it comes with source code so you can modify as per your requirement.
Hope it helps 👍
Financial Radar Chart by zdmreRadar chart is often used when you want to display data across several unique dimensions. Although there are exceptions, these dimensions are usually quantitative, and typically range from zero to a maximum value. Each dimension’s range is normalized to one another, so that when we draw our spider chart, the length of a line from zero to a dimension’s maximum value will be the similar for every dimension.
This Charts are useful for seeing which variables are scoring high or low within a dataset, making them ideal for displaying performance.
How is the score formed?
Debt Paying Ability
if Debt_to_Equity < %10 : 100
elif < 20% : 90
elif < 30% : 80
elif < 40% : 70
elif < 50% : 60
elif < 60% : 50
elif < 70% : 40
elif < 80% : 30
elif < 90% : 20
elif < 100% : 10
else: 0
ROIC
if Return_on_Invested_Capital > %50 : 100
elif > 40% : 90
elif > 30% : 80
elif > 20% : 70
elif > 10% : 50
elif > 5% : 20
else: 0
ROE
if Return_on_Equity > %50 : 100
elif > 40% : 90
elif > 30% : 80
elif > 20% : 70
elif > 10% : 50
elif > 5% : 20
else: 0
Operating Ability
if Operating_Margin > %50 : 100
elif > 30% : 90
elif > 20% : 80
elif > 15% : 60
elif > 10% : 40
elif > 0 : 20
else: 0
EV/EBITDA
if Enterprise_Value_to_EBITDA < 3 : 100
elif < 5 : 80
elif < 7 : 70
elif < 8 : 60
elif < 10 : 40
elif < 12 : 20
else: 0
FREE CASH Ability
if Price_to_Free_Cash_Flow < 5 : 100
elif < 7 : 90
elif < 10 : 80
elif < 16 : 60
elif < 18 : 50
elif < 20 : 40
elif < 22 : 30
elif < 30 : 20
elif < 40 : 15
elif < 50 : 10
elif < 60 : 5
else: 0
GROWTH Ability
if Revenue_One_Year_Growth > %20 : 100
elif > 16% : 90
elif > 14% : 80
elif > 12% : 70
elif > 10% : 50
elif > 7% : 40
elif > 4% : 30
elif > 2% : 20
elif > 0 : 10
else: 0

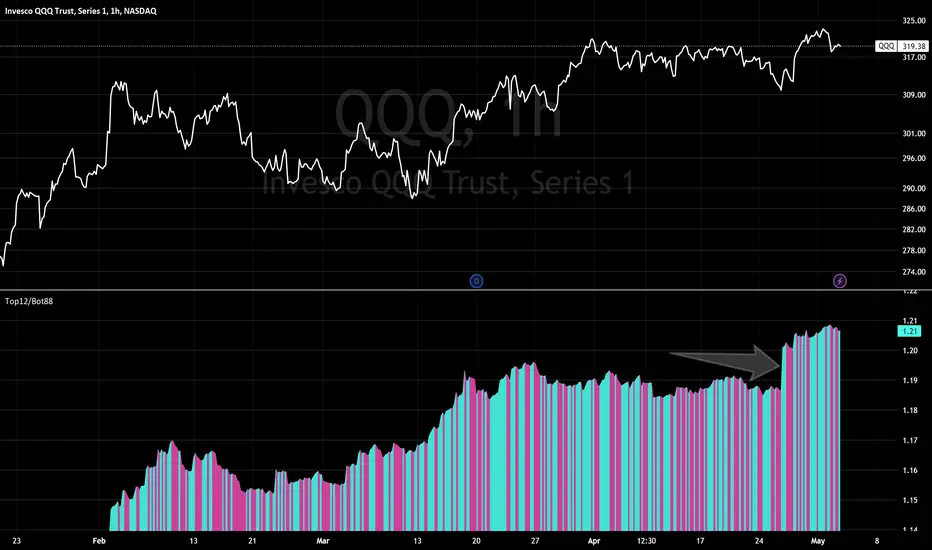
Top12/Bottom88 Weighted Ratio I multiplied the price of each of the top QQQ holdings by their percentage weight, and the bottom 88 holdings for a total of 100. I divide the top 12 weighted price by the bottom 88 weighted price. So I can see when money is flowing in and out of the megacaps. It needs to be updated every quarter, which I may need to do now....
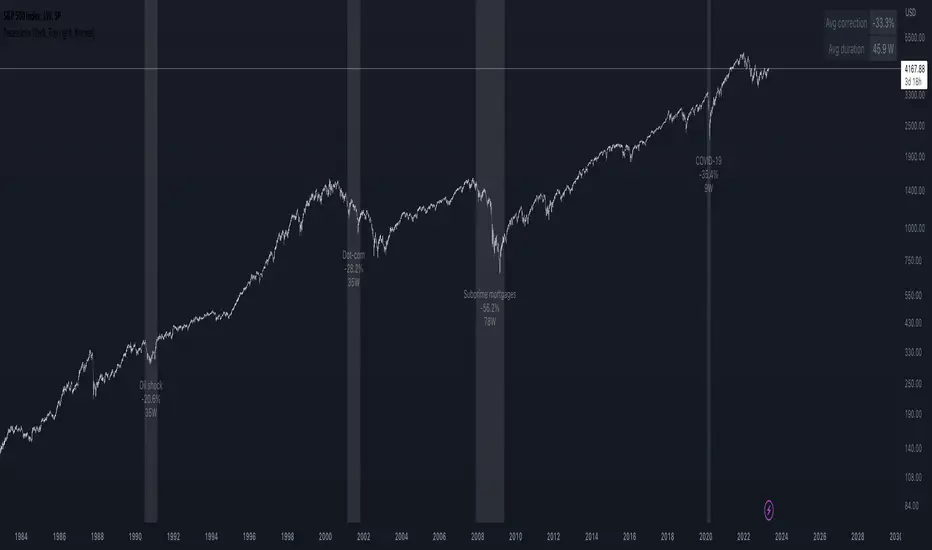
Recessions & crises shading (custom dates & stats)Shades your chart background to flag events such as crises or recessions, in similar fashion to what you see on FRED charts. The advantage of this indicator over others is that you can quickly input custom event dates as text in the menu to analyse their impact for your specific symbol. The script automatically labels, calculates and displays the peak to through percentage corrections on your current chart.
By default the indicator is configured to show the last 6 US recessions. If you have custom events which will benefit others, just paste the input string in the comments below so one can simply copy/paste in their indicator.
Example event input (No spaces allowed except for the label name. Enter dates as YYYY-MM-DD.)
2020-02-01,2020-03-31,COVID-19
2007-12-01,2009-05-31,Subprime mortgages
2001-03-01,2001-10-30,Dot-com bubble
1990-07-01,1991-03-01,Oil shock
1981-07-01,1982-11-01,US unemployment
1980-01-01,1980-07-01,Volker
1973-11-01,1975-03-01,OPEC
Bollinger Bands - Breakout StrategyThe Bollinger Bands - Breakout Strategy is a trend-following optimized for short-term trading in the crypto market. This strategy employs the Bollinger Bands, a widely recognized technical indicator, as its primary instrument for pinpointing potential trades. It is capable of executing both long and short positions, depending on whether the market is in a spot or futures, and is particularly effective in trending markets.
The strategy boasts a high degree of configurability, allowing users to set the Bollinger Bands period and deviation, trend filter, volatility filter, trade direction filter, rate of change filter, and date filter. Furthermore, it offers options for Take Profit, Stop Loss, and Trailing Stop for both long and short positions, ensuring a comprehensive risk management approach. The inclusion of a maximum intraday loss feature adds another layer of protection, making this strategy a valuable tool for traders seeking a professional and adaptable trading system.
Name : Bollinger Bands - Breakout Strategy
Category : Trend Follower based on Bollinger Bands
Operating mode : Long and Short on Futures or Long on Spot
Trade duration : Intraday
Timeframe : 2H, 3H, 4H, 5H
Market : Crypto
Suggested usage : Trending Markets
Entry : When the price crosses above or below the Bollinger Bands
Exit : Opposite Cross or Profit target, Trailing stop or Stop loss
Configuration :
- Bollinger Bands period and deviation
- Trend Filter
- Volatility Filter
- Trade direction filter
- Rate of Change filter
- Date Filter (for backtesting purposes)
- Take Profit, Stop Loss and Trailing Stop for long and short positions
- Risk Management: Max Intraday Loss
Backtesting :
⁃ Exchange: BINANCE
⁃ Pair: BTCUSDT.P
⁃ Timeframe: 4H
⁃ Fee: 0.025%
⁃ Slippage: 1
- Initial Capital: 10000 USDT
- Position sizing: 10% of Equity
- Start : 2019-09-19 (Out Of Sample from 2022-12-23)
- Bar magnifier: on
Credits :
- LucF of Pine Coders for f_security function to avoid repainting using security.
- QuantNomad for Monthly Table.
Disclaimer : Risk Management is crucial, so adjust stop loss to your comfort level. A tight stop loss can help minimise potential losses. Use at your own risk.
How you or we can improve? Source code is open so share your ideas!
Leave a comment and smash the boost button!
Thanks for your attention, happy to support the TradingView community.

Adaptive Price Channel StrategyThis strategy is an adaptive price channel strategy based on the Average True Range (ATR) indicator and the Average Directional Index (ADX). It aims to identify sideways markets and trends in the price movements and make trades accordingly.
The strategy uses a length parameter for the ATR and ADX indicators, which determines the length of the calculation for these indicators. The strategy also uses an ATR multiplier, which is multiplied by the ATR to determine the upper and lower bounds of the price channel.
The first step of the strategy is to calculate the highest high (HH) and lowest low (LL) over the specified length. The ATR is also calculated over the same length. Then the strategy calculates the positive directional indicator (+DI) and negative directional indicator (-DI) based on the up and down moves in the price, and uses these to calculate the ADX.
If the ADX is less than 25, the market is considered to be in a sideways phase. In this case, if the price closes above the upper bound of the price channel (HH - ATR multiplier * ATR), the strategy enters a long position, and if the price closes below the lower bound of the price channel (LL + ATR multiplier * ATR), the strategy enters a short position.
If the ADX is greater than or equal to 25 and the +DI is greater than the -DI, the market is considered to be in a bullish phase. In this case, if the price closes above the upper bound of the price channel, the strategy enters a long position. If the ADX is greater than or equal to 25 and the +DI is less than the -DI, the market is considered to be in a bearish phase. In this case, if the price closes below the lower bound of the price channel, the strategy enters a short position.
The strategy exits a position after a certain number of bars have passed since the entry, as specified by the exit_length input.
In summary, this strategy attempts to trade in accordance with the prevailing market conditions by identifying sideways markets and trends and making trades based on price movements within a dynamically-adjusted price channel.
This strategy takes a read on the market and either takes a channel strategy or trades volatility based on current trend. Works well on 2, 3 ,4, 12 hour for BTC. It’s my first attempt and creating a strategy. I am very interested in constructive criticism. I will look into better risk management, maybe a trailing stop loss. Other suggestions welcome. This is my first attempt at a strategy.
Here are the settings I used.
Inputs
Length 20
Exit 10
ATR 3.2
Dates I picked when I got into Crypto
Properties
Capital 1000
Order size 2 Contracts
Pyramiding 1
Commission .05

Yesterday’s High Breakout - Trend Following StrategyYesterday’s High Breakout it is a trading system based on the analysis of yesterday's highs, it works in trend-following mode therefore it opens a long position at the breakout of yesterday's highs even if they occur several times in one day.
There are several methods for exiting a trade, each with its own unique strategy. The first method involves setting Take-Profit and Stop-Loss percentages, while the second utilizes a trailing-stop with a specified offset value. The third method calls for a conditional exit when the candle closes below a reference EMA.
Additionally, operational filters can be applied based on the volatility of the currency pair, such as calculating the percentage change from the opening or incorporating a gap to the previous day's high levels. These filters help to anticipate or delay entry into the market, mitigating the risk of false breakouts.
In the specific case of NULS, a 9% Take-Profit and a 3% Stop-Loss were set, with an activated trailing-stop percentage. To postpone entry and avoid false breakouts, a 1% gap was added to the price of yesterday's highs.
Name : Yesterday's High Breakout - Trend Follower Strategy
Author : @tumiza999
Category : Trend Follower, Breakout of Yesterday's High.
Operating mode : Spot or Futures (only long).
Trade duration : Intraday.
Timeframe : 30M, 1H, 2H, 4H
Market : Crypto
Suggested usage : Short-term trading, when the market is in trend and it is showing high volatility.
Entry : When there is a breakout of Yesterday's High.
Exit : Profit target or Trailing stop, Stop loss or Crossunder EMA.
Configuration :
- Gap to anticipate or postpone the entry before or after the identified level
- Rate of Change for Entry Condition
- Take Profit, Stop Loss and Trailing Stop
- EMA length
Backtesting :
⁃ Exchange: BINANCE
⁃ Pair: NULSUSDT
⁃ Timeframe: 2H
⁃ Fee: 0.075%
⁃ Slippage: 1
- Initial Capital: 10000 USDT
- Position sizing: 10% of Equity
- Start : 2018-07-26 (Out Of Sample from 2022-12-23)
- Bar magnifier: on
Credits : LucF for Pine Coders (f_security function to avoid repainting using security)
Disclaimer : Risk Management is crucial, so adjust stop loss to your comfort level. A tight stop loss can help minimise potential losses. Use at your own risk.
How you or we can improve? Source code is open so share your ideas!
Leave a comment and smash the boost button!
Thanks for your attention, happy to support the TradingView community.

Simple ICT Market Structure by toodegreesThis Simple ICT Market Structure is based on the teachings of ICT, specifically in his episode 12 of the Public 2022 Mentorship.
The only omission here is the peculiar calculation of Intermediate Term points, for which I am not using the concept of repricing imbalances – this can be added later!
Feel free to use this tool, however it is quite simple and market structure is something we all know very well how to spot. In my opinion it is helpful to display the long term swing points to identify more mature pools of liquidity.
The reason for coding this tool is to help new coders understand PineScript (I have a video tutorial where I code this from start to finish), as well as fostering some algorithmic thinking in your trading of ICT Concepts and Algorithmic Delivery.
If you have any questions about the code, shoot me a message!
Hope you learn something and GLGT!

COT-index rangeA graph showing the commercials (part of COT-data) positioning in relation to its own range, X periods back. I usually choose the look-back period to equal approximately one year. This will be around 52 on a weekly chart and 250 on a daily chart.
In my opinion a high data-point for the commercials is bullish and vice versa. But instead of only looking att absolute values I now look more at how the commercials are positioned compared to the previous 12 och 6 months.
Example:
a) if COT-index range = 0.8, then the commercials are in the 80th percentile for this specific look-back period, i.e. the commercials has only been more bullish 20% of the time and more bearish 80% of the time.
b) a) if COT-index range = 0.5, then the commercials are in the 50th percentile for this specific look-back period, i.e. the commercials has been more bullish 50% of the time and more bearish 50% of the time.
c) if COT-index range = 0.2, then the commercials are in the 20th percentile for this specific look-back period, i.e. the commercials has been more bullish 80% of the time and more bearish 20% of the time.
In other words, a high reading is bullish and a low reading is bearish.

Trend Reversal System with SR levelsHello All,
This is the Trend Reversal System with Support/Resistance levels script. long time ago I published it as closed source but now I upgraded it and and published as open-source with a different name. I hope it would be useful for you all while trading/analyzing.
The script has some parts in it: Setup, Count, SR levels, Risk levels & Targets . Now lets check them:
Setup Part: it has two part, Buy or Sell Setup. one of them can be active only. Buy setup: if current close checks if current is lower/equal than the close of the 5. bar. if yes then the script increases number of buy setup. and if it reaches 9 then the script checks if current low is lower/equal than the lows of last 3. and 4. bars, or if the low of the last bar is lower/equal than the lows of last 3. and 4. bars. if yes then the script increases the buy setup by 1. if these conditions met then it puts the label 'S' , same for Sell setup. S labels on both setup are potential reversals.
Count Part: If buy or sell setup reaches the 9 then Count part starts from 1. lets see buy count: If current close is lower/equal than the low of the 3. bar and buy count is lower than 12 or low of the bar 13 is less than or equal to the close of bar 8 then buy count increase or it's completed. if it's completed then the script puts C label, and it's potential reversal. of course there are some conditions that can cancel the count buy/sell or recycle/restart.
By using Setup and Count levels the script can show Support/Resistance Levels, Risk levels & Targets. SR levels are potential reversal levels.
Lets see some example screenshots:
Support/Resistance levels:
Potential Reversal levels and how setup/counts are shown:
Count part can recycle and the script shows it as 'R' , ( you can see the conditions for Recycle in the script ):
Count can be cancelled and and it's shown as 'x'
If the scripts find 9 on Setup or 13 on Count then it checks if it's a good level to buy/sell and if it decides it's good level then it shows TRSSetup Buy/Sell or TRSCount Buy/Sell and also shows the target. in following example the script checks and decide it's a good level to take long position. it can be aggressive or conservative, Conservative is recommended.
Enjoy!

Optimized Zhaocaijinbao strategyIntroduction:
The Optimized Zhaocaijinbao strategy is a mid and long-term quantitative trading strategy that combines momentum and trend factors. It generates buy and sell signals by using a combination of exponential moving averages, moving averages, volume and slope indicators. It generates buy signals when the stock is above the 35-day moving average, the trading volume is higher than the 20-day moving average, and the stock is in an upward trend on a weekly timeframe."招财进宝" is a Chinese phrase that can be translated to "Attract Wealth and Bring in Treasure" in English. It is a common expression used to wish for good luck and prosperity in various contexts, such as in business or personal finances.
Highlights:
The strategy has several special optimizations that make it unique.
Firstly, the strategy is optimized for T+1 trading in the Chinese stock market and is only suitable for long positions. The optimizations are also applicable to international stock markets.
Secondly, the trend strategy is optimized to only show indicators on the right side and oscillations. This helps to prevent false signals in choppy markets.
Thirdly, the strategy uses a risk factor for dynamic position sizing to ensure position sizes are adjusted according to the current net asset value and risk preferences. This helps to lower drawdown risks.
The strategy has good resilience even without using stop loss modules in backtesting, making it suitable for trading hourly, 2-hourly, and daily K-line charts (depending on the stock being traded). We recommend experimenting with backtesting using SSE 1-hour or 2-hour or daily Kline charts.
Backtesting outcomes:
The strategy was backtested over the period from October 13th, 2005 to April 14th, 2023, using daily candlestick charts for the commodity code SSE:600763, with a currency of CNY and tick size of 0.01. The strategy used an initial capital of 1,000,000 CNY, with order sizes set to 10% equity and a pyramid of 1 order. The strategy also had a Max Position Size of 0.01 and a Risk Factor of 2.
Here is a summary of the performance of the trading strategy:
Total net profit: 288,577.32 CNY, representing a return of 128.86%
Total number of closed trades: 61
Winning trades: 37, representing a win rate of 60.66%
Profit factor: 2.415
Largest losing trade: 222,021.46 CNY, representing a loss of 14.08%
Average trade: 21,124.22 CNY, representing a return of 3.1%
Average holding period for all trades: 12 days
Conclusion:
In conclusion, the Optimized Zhaocaijinbao strategy is a mid and long-term quantitative trading strategy that combines momentum and trend factors. It is suitable for both Chinese stocks and global stocks. While the Optimized Zhaocaijinbao strategy has performed well in backtesting, it is important to note that past performance is not a guarantee of future results. Traders should conduct their own research and analysis and exercise caution when using any trading strategy.

Moonhub Cycle IndexMoonhub Cycle Index is a composite index derived from three popular technical analysis indicators: Moving Average Convergence Divergence (MACD), Schaff Trend Cycle (STC), and Detrended Price Oscillator (DPO). The indicator is designed to help identify potential trends and market sentiment by combining the unique characteristics of each indicator.
Key components of the indicator include:
Input Parameters:
COEMA Length (len_DIema): The length of the Exponential Moving Average (EMA) applied to the Custom Index. Default is set to 9.
COSMA Length (len_DIsma): The length of the Simple Moving Average (SMA) applied to the Custom Index. Default is set to 30.
Indicators:
MACD: A momentum oscillator that shows the relationship between two moving averages of a security's price. It is calculated using the difference between the 12-period and 26-period EMA, and a 9-period EMA (signal line) of the MACD.
STC: A cyclic indicator that identifies cyclical trends in the market. It is calculated using the Stochastic oscillator formula applied to the close, high, and low prices over a 10-period lookback window.
DPO: A price oscillator that eliminates the trend from price data to focus on underlying cycles. It is calculated using a custom function that shifts the price by half the length and subtracts the SMA from the shifted price.
Custom Index: The composite index is calculated by taking the average of the MACD line, STC, and DPO.
COEMA and COSMA: Exponential and Simple Moving Averages applied to the Custom Index using the lengths specified by the input parameters (len_DIema and len_DIsma).
Plots: The Custom Index, COEMA, and COSMA are plotted with different colors and line widths to visualize their interaction and provide insights into potential market trends.
This Custom Index Indicator can be useful for traders who want to analyze the market using a combination of these indicators to make more informed decisions. It can also help identify potential trends and market sentiment by combining the unique characteristics of each indicator.

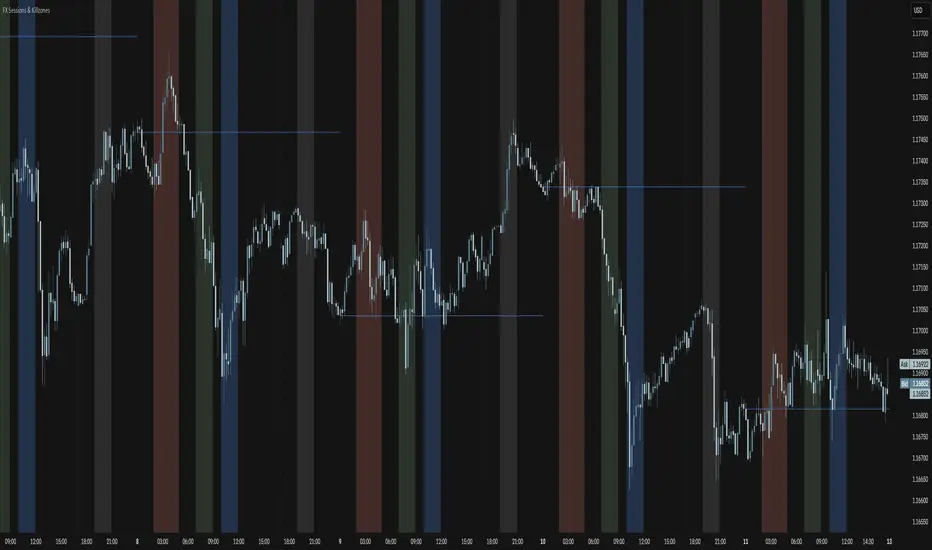
FX Sessions & Killzones ETJust another sessions indicator. Among all the many existing ones, I didn't find anything simple that would cover my needs and that would actually be correct.
New York time is forced here for plotting the stripes so you don't need to worry about the time zone currently set on your chart. The indicator will be accurate during Daylight Saving Time (which, in 2023 for example, started on Sunday, 12 March , 02:00:00 and will be in effect until Sunday, 5 November, 02:00:00).
ADX Trend FilterADX Trend Filter Indicator is a traditional ADX indicator with a different presentation. its consist of two indicators EMA TREND and ADX / DMI
About Indicator:
1. BAND / EMA band to represent EMA Trend of EMA-12 and EMA-50
(Band is plotted at level-20 which is the Threshold level of DMI / ADX indicator)
2. Histogram showing the direction of ADX / DMI trend
3. Area behind the histogram showing ADX/DMI strength
How to use?
1. Histogram represents current Trend Red for Bearish / Green for Bullish
2. Area behind the histogram represents Strength of ADX / DMI Threshold level is 0-20(represented as band). (Area below the Band is Sideways)
3. Band represents the current MA Trend.
4. Buy Sell signals are plotted as triangles in red/green obtained from ADX / DMI Crossovers
Buy Signal (Green Triangle on band- ADX Crossover)
1.Band below Histogram must be Green
2.Histogram must be green
3.Area behind histogram must be above the lower trend band (20level) and visible
Sell Signal (Red Triangle on band- ADX Crossover)
1.Band below Histogram must be Red
2.Histogram must be Red
3.Area behind histogram must be above the lower trend band (20level) and visible
Alerts provided for ADX crossovers.

SAR MACDSAR MACD is an idea of implementing Directional MACD with Parabolic SAR to exactly detect and confirm Trend. This p-SAR MACD consist of a HYBRID MACD which acts as MACD TREND oscillator, MACD Oscillator, PSAR Indicator combined with MA line. thus Fake MACD Signals can be eliminated using this SAR MACD. Sideways can be detected using Threshold Levels must be adjusted based on timeframe.
Indicators Hybrid model contains:
1.MACD (12,26,9) Standard with MA Crossovers
2.MACD Trend
3.Parabolic SAR with 0.02
4.Threshold level - indicates Sideways
How to use.
Histogram:
-> HIST MODE: normal MACD indicator
MA Line Color is based on PSAR Direction Blue-Up/ Pink -Down
A crossover upside with a Blue MA line denotes Up confirmation
A Crossover downwards with a red MA line denotes Down Confirmation
Additionally Histogram above zero line and below zero line are to be confirmed
-> MACD MODE: MACD Trend indicator
MA Line Color is based on PSAR Direction Blue-Up/ Pink -Down
A crossover upside with a Blue MA line denotes Up confirmation
A Crossover downwards with a red MA line denotes Down Confirmation
Additionally Histogram above zero line and below zero denotes long term Trend
-> Histogram Color: Indicates candles direction
Yellow indicates Unconfirmed Direction
Green Indicates up direction
Red Indicates Down Direction
Buy Condition:
MA Color - Blue
Histogram- Above Zero
Histogram/Candle -Green
MA Crossover is must
Sell Condition:
MA Color - Red
Histogram- Below Zero
Histogram/Candle -Red
MA Cross under is must
Warning: Must not be used as a standalone indicator. Use for confirmation of your Buy Sell Signals and Entry only.
