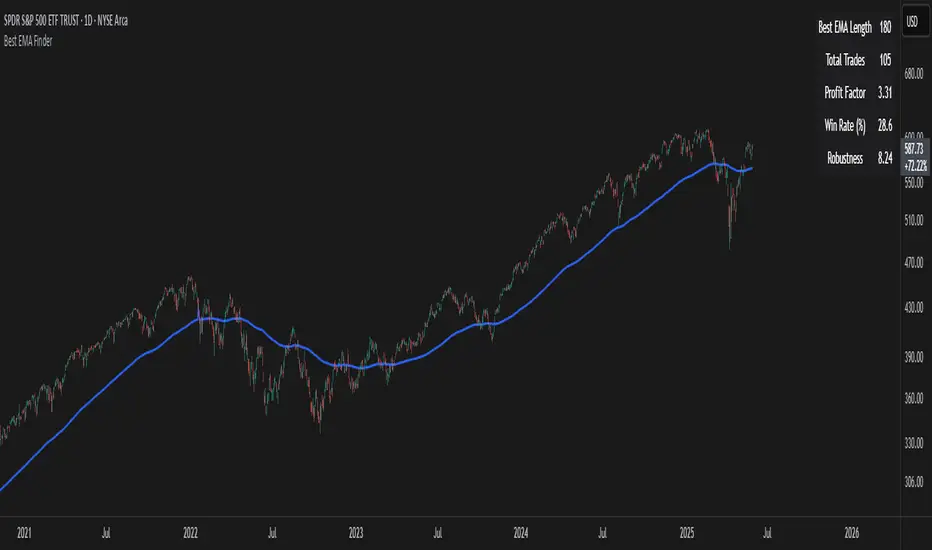
Best EMA FinderThis script, Best EMA Finder, is based on the same original logic as the Best SMA Finder I published previously. Although it was not the initial goal of the project, several users asked for an EMA version, so here it is.
The script scans a wide range of Exponential Moving Average (EMA) lengths, from 10 to 500, and identifies the one that historically delivered the most robust performance on the current chart. The choice to stop at 500 is deliberate: beyond that point, EMA curves tend to flatten and converge, adding processing time without meaningful differences in signals or outcomes.
Each EMA is evaluated using a custom robustness score:
Profit Factor × log(Number of Trades) × sqrt(Win Rate)
Only EMA lengths that exceed a user-defined minimum number of trades are considered valid. Among these, the one with the highest robustness score is selected and displayed on the chart.
A table summarizes the results:
- Best EMA length
- Total number of trades
- Profit Factor
- Win Rate
- Robustness Score
You can adjust:
- Strategy type: Long Only or Buy & Sell
- Minimum number of trades required
- Table visibility
This script is designed for analysis and optimization only. It does not execute trades or handle position sizing. Only one open trade per direction is considered at a time.
Cerca negli script per "美股标普500指数基金中国"
LTA - Futures Contract Size CalculatorLTA - Futures Contract Size Calculator
This indicator helps futures traders calculate the potential stop-loss (SL) value for their trades with ease. Simply input your entry price, stop-loss price, and number of contracts, and the indicator will compute the ticks moved, price movement, and total SL value in USD.
Key Features:
Supports a wide range of futures contracts, including:
Index Futures: E-mini S&P 500 (ES), Micro E-mini S&P 500 (MES), E-mini Nasdaq-100 (NQ), Micro E-mini Nasdaq-100 (MNQ)
Commodity Futures: Crude Oil (CL), Gold (GC), Micro Gold (MGC), Silver (SI), Micro Silver (SIL), Platinum (PL), Micro Platinum (MPL), Natural Gas (NG), Micro Natural Gas (MNG)
Bond Futures: 30-Year T-Bond (ZB)
Currency Futures: Euro FX (6E), Japanese Yen (6J), Australian Dollar (6A), British Pound (6B), Canadian Dollar (6C), Swiss Franc (6S), New Zealand Dollar (6N)
Displays key metrics in a clean table (bottom-right corner):
Instrument, Entry Price, Stop-Loss Price, Number of Contracts, Tick Size, Ticks Moved, Price Movement, and Total SL Value.
Automatically calculates based on the selected instrument’s tick size and tick value.
User-friendly interface with a dark theme for better visibility.
How to Use:
Add the indicator to your chart.
Select your instrument from the dropdown (ensure it matches your chart’s symbol, e.g., "NG1!" for NATURAL GAS (NG)).
Input your Entry Price, Stop-Loss Price, and Number of Contracts.
View the results in the table, including the Total SL Value in USD.
Ideal For:
Futures traders looking to quickly assess stop-loss risk.
Beginners and pros trading indices, commodities, bonds, or currencies.
Note: Ensure your chart symbol matches the selected instrument for accurate calculations. For best results, test with a few contracts and price levels to confirm the output.
This description is tailored for TradingView’s audience, providing a clear overview of the indicator’s functionality, supported instruments, and usage instructions. It also includes a note to help users avoid common pitfalls (e.g., mismatched symbols). If you’d like to adjust the tone, add more details, or include specific TradingView tags (e.g., , ), let me know!

CCI Divergence Detector
A technical analysis tool that identifies divergences between price action and the Commodity Channel Index (CCI) oscillator. Unlike standard divergence indicators, this system employs advanced gradient visualization, multi-layer wave effects, and comprehensive customization options to provide traders with crystal-clear divergence signals and market momentum insights.
Core Detection Mechanism
CCI-Based Analysis: The indicator utilizes the Commodity Channel Index as its primary oscillator, calculated from user-configurable source data (default: HLC3) with adjustable length parameters. The CCI provides reliable momentum readings that effectively highlight price-momentum divergences.
Dynamic Pivot Detection: The system employs adaptive pivot detection with three sensitivity levels (High/Normal/Low) to identify significant highs and lows in both price and CCI values. This dynamic approach ensures optimal divergence detection across different market conditions and timeframes.
Dual Divergence Analysis:
Regular Bullish Divergences: Detected when price makes lower lows while CCI makes higher lows, indicating potential upward reversal
Regular Bearish Divergences: Identified when price makes higher highs while CCI makes lower highs, signaling potential downward reversal
Strength Classification System: Each detected divergence is automatically classified into three strength categories (Weak/Moderate/Strong) based on:
-Price differential magnitude
-CCI differential magnitude
-Time duration between pivot points
-User-configurable strength multiplier
Advanced Visual System
Multi-Layer Wave Effects: The indicator features a revolutionary wave visualization system that creates depth through multiple gradient layers around the CCI line. The wave width dynamically adjusts based on ATR volatility, providing intuitive visual feedback about market conditions.
Professional Color Gradient System: Nine independent color inputs control every visual aspect:
Bullish Colors (Light/Medium/Dark): Control oversold areas, wave effects, and strong bullish signals
Bearish Colors (Light/Medium/Dark): Manage overbought zones, wave fills, and strong bearish signals
Neutral Colors (Light/Medium/Dark): Handle table elements, zero line, and transitional states
Intelligent Color Mapping: Colors automatically adapt based on CCI values:
Overbought territory (>100): Bearish color gradients with increasing intensity
Neutral positive (0 to 100): Blend from neutral to bearish tones
Oversold territory (<-100): Bullish color gradients with increasing intensity
Neutral negative (-100 to 0): Transition from neutral to bullish tones
Key Features & Components
Advanced Configuration System: Eight organized input groups provide granular control:
General Settings: System enable, pivot length, confidence thresholds
Oscillator Selection: CCI parameters, overbought/oversold levels, normalization options
Detection Parameters: Divergence types, minimum strength requirements
Sensitivity Tuning: Pivot sensitivity, divergence threshold, confirmation bars
Visual System: Line thickness, labels, backgrounds, table display
Wave Effects: Dynamic width, volatility response, layer count, glow effects
Transparency Controls: Independent transparency for all visual elements
Smoothing & Filtering: CCI smoothing types, noise filtering, wave smoothing
Professional Alert System: Comprehensive alert functionality with dynamic messages including:
-Divergence type and strength classification
-Current CCI value and confidence percentage
-Customizable alert frequency and conditions
Enhanced Information Table: Real-time display showing:
-Current CCI length and value
-Market status (Overbought/Normal/Oversold)
-Active sensitivity setting
Configurable table positioning (4 corner options)
Visual Elements Explained
Primary CCI Line: Main oscillator plot with gradient coloring that reflects market momentum and CCI intensity. Line thickness is user-configurable (1-8 pixels).
Wave Effect Layers: Multi-layer gradient fills creating a dynamic wave around the
CCI line:
-Outer layers provide broad market context
-Inner layers highlight immediate momentum
-Core layers show precise CCI movement
-All layers respond to volatility and momentum changes
Divergence Lines & Labels:
-Solid lines connecting divergence pivot points
-Color-coded based on divergence type and strength
-Labels displaying divergence type and strength classification
-Customizable transparency and size options
Reference Lines:
-Zero line with neutral color coding
-Overbought level (default: 100) with bearish coloring
-Oversold level (default: -100) with bullish coloring
Background Gradient: Optional background coloring that reflects CCI intensity and market conditions with user-controlled transparency (80-99%).
Configuration Options
Sensitivity Controls:
Pivot sensitivity: High/Normal/Low detection levels
Divergence threshold: 0.1-2.0 sensitivity range
Confirmation bars: 1-5 bar confirmation requirement
Strength multiplier: 0.1-3.0 calculation adjustment
Visual Customization:
Line transparency: 0-90% for main elements
Wave transparency: 0-95% for fill effects
Background transparency: 80-99% for subtle background
Label transparency: 0-50% for text elements
Glow transparency: 50-95% for glow effects
Advanced Processing:
Five smoothing types: None/SMA/EMA/RMA/WMA
Noise filtering with adjustable threshold (0.1-10.0)
CCI normalization for enhanced gradient scaling
Dynamic wave width with ATR-based volatility response
Interpretation Guidelines
Divergence Signals:
Strong divergences: High-confidence reversal signals requiring immediate attention
Moderate divergences: Reliable signals suitable for most trading strategies
Weak divergences: Early warning signals best combined with additional confirmation
Wave Intensity: Wave width and color intensity provide real-time volatility and momentum feedback. Wider, more intense waves indicate higher market volatility and stronger momentum.
Color Transitions: Smooth color transitions between bullish, neutral, and bearish states help identify market regime changes and momentum shifts.
CCI Levels: Traditional overbought (>100) and oversold (<-100) levels remain relevant, but the gradient system provides more nuanced momentum reading between these extremes.
Technical Specifications
Compatible Timeframes: All timeframes supported
Maximum Labels: 500 (for divergence marking)
Maximum Lines: 500 (for divergence drawing)
Pine Script Version: v5 (latest optimization)
Overlay Mode: False (separate pane indicator)
Usage Recommendations
This indicator works best when:
-Combined with price action analysis and support/resistance levels
-Used across multiple timeframes for confirmation
-Integrated with proper risk management protocols
-Applied in trending markets for divergence-based reversal signals
-Utilized with other technical indicators for comprehensive analysis
Risk Disclaimer: Trading involves substantial risk of loss. This indicator is provided for analytical purposes only and does not constitute financial advice. Divergence signals, while powerful, are not guaranteed to predict future price movements. Past performance is not indicative of future results. Always use proper risk management and never trade with capital you cannot afford to lose.

Bear Market Probability Model# Bear Market Probability Model: A Multi-Factor Risk Assessment Framework
The Bear Market Probability Model represents a comprehensive quantitative framework for assessing systemic market risk through the integration of 13 distinct risk factors across four analytical categories: macroeconomic indicators, technical analysis factors, market sentiment measures, and market breadth metrics. This indicator synthesizes established financial research methodologies to provide real-time probabilistic assessments of impending bear market conditions, offering institutional-grade risk management capabilities to retail and professional traders alike.
## Theoretical Foundation
### Historical Context of Bear Market Prediction
Bear market prediction has been a central focus of financial research since the seminal work of Dow (1901) and the subsequent development of technical analysis theory. The challenge of predicting market downturns gained renewed academic attention following the market crashes of 1929, 1987, 2000, and 2008, leading to the development of sophisticated multi-factor models.
Fama and French (1989) demonstrated that certain financial variables possess predictive power for stock returns, particularly during market stress periods. Their three-factor model laid the groundwork for multi-dimensional risk assessment, which this indicator extends through the incorporation of real-time market microstructure data.
### Methodological Framework
The model employs a weighted composite scoring methodology based on the theoretical framework established by Campbell and Shiller (1998) for market valuation assessment, extended through the incorporation of high-frequency sentiment and technical indicators as proposed by Baker and Wurgler (2006) in their seminal work on investor sentiment.
The mathematical foundation follows the general form:
Bear Market Probability = Σ(Wi × Ci) / ΣWi × 100
Where:
- Wi = Category weight (i = 1,2,3,4)
- Ci = Normalized category score
- Categories: Macroeconomic, Technical, Sentiment, Breadth
## Component Analysis
### 1. Macroeconomic Risk Factors
#### Yield Curve Analysis
The inclusion of yield curve inversion as a primary predictor follows extensive research by Estrella and Mishkin (1998), who demonstrated that the term spread between 3-month and 10-year Treasury securities has historically preceded all major recessions since 1969. The model incorporates both the 2Y-10Y and 3M-10Y spreads to capture different aspects of monetary policy expectations.
Implementation:
- 2Y-10Y Spread: Captures market expectations of monetary policy trajectory
- 3M-10Y Spread: Traditional recession predictor with 12-18 month lead time
Scientific Basis: Harvey (1988) and subsequent research by Ang, Piazzesi, and Wei (2006) established the theoretical foundation linking yield curve inversions to economic contractions through the expectations hypothesis of the term structure.
#### Credit Risk Premium Assessment
High-yield credit spreads serve as a real-time gauge of systemic risk, following the methodology established by Gilchrist and Zakrajšek (2012) in their excess bond premium research. The model incorporates the ICE BofA High Yield Master II Option-Adjusted Spread as a proxy for credit market stress.
Threshold Calibration:
- Normal conditions: < 350 basis points
- Elevated risk: 350-500 basis points
- Severe stress: > 500 basis points
#### Currency and Commodity Stress Indicators
The US Dollar Index (DXY) momentum serves as a risk-off indicator, while the Gold-to-Oil ratio captures commodity market stress dynamics. This approach follows the methodology of Akram (2009) and Beckmann, Berger, and Czudaj (2015) in analyzing commodity-currency relationships during market stress.
### 2. Technical Analysis Factors
#### Multi-Timeframe Moving Average Analysis
The technical component incorporates the well-established moving average convergence methodology, drawing from the work of Brock, Lakonishok, and LeBaron (1992), who provided empirical evidence for the profitability of technical trading rules.
Implementation:
- Price relative to 50-day and 200-day simple moving averages
- Moving average convergence/divergence analysis
- Multi-timeframe MACD assessment (daily and weekly)
#### Momentum and Volatility Analysis
The model integrates Relative Strength Index (RSI) analysis following Wilder's (1978) original methodology, combined with maximum drawdown analysis based on the work of Magdon-Ismail and Atiya (2004) on optimal drawdown measurement.
### 3. Market Sentiment Factors
#### Volatility Index Analysis
The VIX component follows the established research of Whaley (2009) and subsequent work by Bekaert and Hoerova (2014) on VIX as a predictor of market stress. The model incorporates both absolute VIX levels and relative VIX spikes compared to the 20-day moving average.
Calibration:
- Low volatility: VIX < 20
- Elevated concern: VIX 20-25
- High fear: VIX > 25
- Panic conditions: VIX > 30
#### Put-Call Ratio Analysis
Options flow analysis through put-call ratios provides insight into sophisticated investor positioning, following the methodology established by Pan and Poteshman (2006) in their analysis of informed trading in options markets.
### 4. Market Breadth Factors
#### Advance-Decline Analysis
Market breadth assessment follows the classic work of Fosback (1976) and subsequent research by Brown and Cliff (2004) on market breadth as a predictor of future returns.
Components:
- Daily advance-decline ratio
- Advance-decline line momentum
- McClellan Oscillator (Ema19 - Ema39 of A-D difference)
#### New Highs-New Lows Analysis
The new highs-new lows ratio serves as a market leadership indicator, based on the research of Zweig (1986) and validated in academic literature by Zarowin (1990).
## Dynamic Threshold Methodology
The model incorporates adaptive thresholds based on rolling volatility and trend analysis, following the methodology established by Pagan and Sossounov (2003) for business cycle dating. This approach allows the model to adjust sensitivity based on prevailing market conditions.
Dynamic Threshold Calculation:
- Warning Level: Base threshold ± (Volatility × 1.0)
- Danger Level: Base threshold ± (Volatility × 1.5)
- Bounds: ±10-20 points from base threshold
## Professional Implementation
### Institutional Usage Patterns
Professional risk managers typically employ multi-factor bear market models in several contexts:
#### 1. Portfolio Risk Management
- Tactical Asset Allocation: Reducing equity exposure when probability exceeds 60-70%
- Hedging Strategies: Implementing protective puts or VIX calls when warning thresholds are breached
- Sector Rotation: Shifting from growth to defensive sectors during elevated risk periods
#### 2. Risk Budgeting
- Value-at-Risk Adjustment: Incorporating bear market probability into VaR calculations
- Stress Testing: Using probability levels to calibrate stress test scenarios
- Capital Requirements: Adjusting regulatory capital based on systemic risk assessment
#### 3. Client Communication
- Risk Reporting: Quantifying market risk for client presentations
- Investment Committee Decisions: Providing objective risk metrics for strategic decisions
- Performance Attribution: Explaining defensive positioning during market stress
### Implementation Framework
Professional traders typically implement such models through:
#### Signal Hierarchy:
1. Probability < 30%: Normal risk positioning
2. Probability 30-50%: Increased hedging, reduced leverage
3. Probability 50-70%: Defensive positioning, cash building
4. Probability > 70%: Maximum defensive posture, short exposure consideration
#### Risk Management Integration:
- Position Sizing: Inverse relationship between probability and position size
- Stop-Loss Adjustment: Tighter stops during elevated risk periods
- Correlation Monitoring: Increased attention to cross-asset correlations
## Strengths and Advantages
### 1. Comprehensive Coverage
The model's primary strength lies in its multi-dimensional approach, avoiding the single-factor bias that has historically plagued market timing models. By incorporating macroeconomic, technical, sentiment, and breadth factors, the model provides robust risk assessment across different market regimes.
### 2. Dynamic Adaptability
The adaptive threshold mechanism allows the model to adjust sensitivity based on prevailing volatility conditions, reducing false signals during low-volatility periods and maintaining sensitivity during high-volatility regimes.
### 3. Real-Time Processing
Unlike traditional academic models that rely on monthly or quarterly data, this indicator processes daily market data, providing timely risk assessment for active portfolio management.
### 4. Transparency and Interpretability
The component-based structure allows users to understand which factors are driving risk assessment, enabling informed decision-making about model signals.
### 5. Historical Validation
Each component has been validated in academic literature, providing theoretical foundation for the model's predictive power.
## Limitations and Weaknesses
### 1. Data Dependencies
The model's effectiveness depends heavily on the availability and quality of real-time economic data. Federal Reserve Economic Data (FRED) updates may have lags that could impact model responsiveness during rapidly evolving market conditions.
### 2. Regime Change Sensitivity
Like most quantitative models, the indicator may struggle during unprecedented market conditions or structural regime changes where historical relationships break down (Taleb, 2007).
### 3. False Signal Risk
Multi-factor models inherently face the challenge of balancing sensitivity with specificity. The model may generate false positive signals during normal market volatility periods.
### 4. Currency and Geographic Bias
The model focuses primarily on US market indicators, potentially limiting its effectiveness for global portfolio management or non-USD denominated assets.
### 5. Correlation Breakdown
During extreme market stress, correlations between risk factors may increase dramatically, reducing the model's diversification benefits (Forbes and Rigobon, 2002).
## References
Akram, Q. F. (2009). Commodity prices, interest rates and the dollar. Energy Economics, 31(6), 838-851.
Ang, A., Piazzesi, M., & Wei, M. (2006). What does the yield curve tell us about GDP growth? Journal of Econometrics, 131(1-2), 359-403.
Baker, M., & Wurgler, J. (2006). Investor sentiment and the cross‐section of stock returns. The Journal of Finance, 61(4), 1645-1680.
Baker, S. R., Bloom, N., & Davis, S. J. (2016). Measuring economic policy uncertainty. The Quarterly Journal of Economics, 131(4), 1593-1636.
Barber, B. M., & Odean, T. (2001). Boys will be boys: Gender, overconfidence, and common stock investment. The Quarterly Journal of Economics, 116(1), 261-292.
Beckmann, J., Berger, T., & Czudaj, R. (2015). Does gold act as a hedge or a safe haven for stocks? A smooth transition approach. Economic Modelling, 48, 16-24.
Bekaert, G., & Hoerova, M. (2014). The VIX, the variance premium and stock market volatility. Journal of Econometrics, 183(2), 181-192.
Brock, W., Lakonishok, J., & LeBaron, B. (1992). Simple technical trading rules and the stochastic properties of stock returns. The Journal of Finance, 47(5), 1731-1764.
Brown, G. W., & Cliff, M. T. (2004). Investor sentiment and the near-term stock market. Journal of Empirical Finance, 11(1), 1-27.
Campbell, J. Y., & Shiller, R. J. (1998). Valuation ratios and the long-run stock market outlook. The Journal of Portfolio Management, 24(2), 11-26.
Dow, C. H. (1901). Scientific stock speculation. The Magazine of Wall Street.
Estrella, A., & Mishkin, F. S. (1998). Predicting US recessions: Financial variables as leading indicators. Review of Economics and Statistics, 80(1), 45-61.
Fama, E. F., & French, K. R. (1989). Business conditions and expected returns on stocks and bonds. Journal of Financial Economics, 25(1), 23-49.
Forbes, K. J., & Rigobon, R. (2002). No contagion, only interdependence: measuring stock market comovements. The Journal of Finance, 57(5), 2223-2261.
Fosback, N. G. (1976). Stock market logic: A sophisticated approach to profits on Wall Street. The Institute for Econometric Research.
Gilchrist, S., & Zakrajšek, E. (2012). Credit spreads and business cycle fluctuations. American Economic Review, 102(4), 1692-1720.
Harvey, C. R. (1988). The real term structure and consumption growth. Journal of Financial Economics, 22(2), 305-333.
Kahneman, D., & Tversky, A. (1979). Prospect theory: An analysis of decision under risk. Econometrica, 47(2), 263-291.
Magdon-Ismail, M., & Atiya, A. F. (2004). Maximum drawdown. Risk, 17(10), 99-102.
Nickerson, R. S. (1998). Confirmation bias: A ubiquitous phenomenon in many guises. Review of General Psychology, 2(2), 175-220.
Pagan, A. R., & Sossounov, K. A. (2003). A simple framework for analysing bull and bear markets. Journal of Applied Econometrics, 18(1), 23-46.
Pan, J., & Poteshman, A. M. (2006). The information in option volume for future stock prices. The Review of Financial Studies, 19(3), 871-908.
Taleb, N. N. (2007). The black swan: The impact of the highly improbable. Random House.
Whaley, R. E. (2009). Understanding the VIX. The Journal of Portfolio Management, 35(3), 98-105.
Wilder, J. W. (1978). New concepts in technical trading systems. Trend Research.
Zarowin, P. (1990). Size, seasonality, and stock market overreaction. Journal of Financial and Quantitative Analysis, 25(1), 113-125.
Zweig, M. E. (1986). Winning on Wall Street. Warner Books.

Momentum Long + Short Strategy (BTC 3H)Momentum Long + Short Strategy (BTC 3H)
🔍 How It Works, Step by Step
Detect the Trend (📈/📉)
Calculate two moving averages (100-period and 500-period), either EMA or SMA.
For longs, we require MA100 > MA500 (uptrend).
For shorts, we block entries if MA100 exceeds MA500 by more than a set percentage (to avoid fading a powerful uptrend).
Apply Momentum Filters (⚡️)
RSI Filter: Measures recent strength—only allow longs when RSI crosses above its smoothed average, and shorts when RSI dips below the oversold threshold.
ADX Filter: Gauges trend strength—ensures we only enter when a meaningful trend exists (optional).
ATR Filter: Confirms volatility—avoids choppy, low-volatility conditions by requiring ATR to exceed its smoothed value (optional).
Confirm Entry Conditions (✅)
Long Entry:
Price is above both MAs
Trend alignment & optional filters pass ✅
Short Entry:
Price is below both MAs and below the lower Bollinger Band
RSI is sufficiently oversold
Trend-blocker & ATR filter pass ✅
Position Sizing & Risk (💰)
Each trade uses 100 % of account equity by default.
One pyramid addition allowed, so you can scale in if the move continues.
Commission and slippage assumptions built in for realistic backtests.
Stops & Exits (🛑)
Long Stop-Loss: e.g. 3 % below entry.
Long Auto-Exit: If price falls back under the 500-period MA.
Short Stop-Loss: e.g. 3 % above entry.
Short Take-Profit: e.g. 4 % below entry.
🎨 Why It’s Powerful & Customizable
Modular Filters: Turn on/off RSI, ADX, ATR filters to suit different market regimes.
Adjustable Thresholds: Fine-tune stop-loss %, take-profit %, RSI lengths, MA gaps and more.
Multi-Timeframe Potential: Although coded for 3 h BTC, you can adapt it to stocks, forex or other cryptos—just recalibrate!
Backtest Fine-Tuned: Default settings were optimized via backtesting on historical BTC data—but they’re not guarantees of future performance.
⚠️ Warning & Disclaimer
This strategy is for educational purposes only and designed for a toy fund. Crypto markets are highly volatile—you can lose 100 % of your capital. It is not a predictive “holy grail” but a rules-based framework using past data. The parameters have been fine-tuned on historical data and are not valid for future trades without fresh calibration. Always practice with paper-trading first, use proper risk management, and do your own research before risking real money. 🚨🔒
Good luck exploring and experimenting! 🚀📊

Supertrend with Volume Filter AlertSupertrend with Volume Filter Alert - Indicator Overview
What is the Supertrend Indicator?
The Supertrend indicator is a popular trend-following tool used by traders to identify the direction of the market and potential entry/exit points. It is based on the Average True Range (ATR), which measures volatility, and plots a line on the chart that acts as a dynamic support or resistance level. When the price is above the Supertrend line, it signals an uptrend (bullish), and when the price is below, it indicates a downtrend (bearish). The indicator is particularly effective in trending markets but can generate false signals during choppy or sideways conditions.
How This Script Works
The "Supertrend with Volume Filter Alert" enhances the classic Supertrend indicator by adding a customizable volume filter to improve signal reliability.
Here's how it functions:
Supertrend Calculation:The Supertrend is calculated using the ATR over a user-defined period (default: 55) and a multiplier (default: 1.85). These parameters control the sensitivity of the indicator:A higher ATR period smooths out volatility, making the indicator less reactive to short-term price fluctuations.The multiplier determines the distance of the Supertrend line from the price, affecting how quickly it responds to trend changes.The script plots the Supertrend line in cyan for uptrends and red for downtrends, making it easy to visualize the market direction.
Volume Filter:A key feature of this script is the volume filter, which helps filter out false signals in choppy markets. The filter compares the current volume to the average volume over a lookback period (default: 20) and only triggers signals if the volume exceeds the average by a specified multiplier (default: 2.0).This ensures that trend changes are accompanied by significant market participation, increasing the likelihood of a genuine trend shift.
Signals and Alerts:
Buy signals (cyan triangle below the bar) are generated when the price crosses above the Supertrend line (indicating an uptrend) and the volume condition is met.Sell signals (red triangle above the bar) are generated when the price crosses below the Supertrend line (indicating a downtrend) and the volume condition is met.Alerts are set up for both buy and sell signals, notifying traders only when the volume filter confirms the trend change.
Customizable Settings for Multiple Markets
The default settings in this script (ATR Period: 55, ATR Multiplier: 1.85, Volume Lookback Period: 20, Volume Multiplier: 2.0) were carefully chosen to provide a balance of sensitivity and reliability across various markets, including stocks, indices (like the S&P 500), forex, and cryptocurrencies.
Here's why these settings work well:
ATR Period (55): A longer ATR period smooths out volatility, making the indicator less prone to whipsaws in volatile markets like crypto or forex, while still being responsive enough for trending markets like indices.
ATR Multiplier (1.85): This multiplier strikes a balance between capturing early trend changes and avoiding noise. A smaller multiplier would make the indicator too sensitive, while a larger one might miss early opportunities.
Volume Lookback Period (20): A 20-bar lookback for volume averaging provides a robust baseline for identifying significant volume spikes, adaptable to both short-term (e.g., daily charts) and longer-term (e.g., weekly charts) timeframes.
Volume Multiplier (2.0): Requiring volume to be at least 2x the average ensures that only high-conviction moves trigger signals, which is crucial for markets with varying liquidity levels.
These parameters are fully customizable, allowing traders to adjust the indicator to their specific market, timeframe, or trading style. For example, you might reduce the ATR period for faster-moving markets or increase the volume multiplier for more conservative signal filtering.
How the Volume Filter Reduces Bad Trades in Choppy Markets
One of the main drawbacks of the Supertrend indicator is its tendency to generate false signals during choppy or ranging markets, where price fluctuates without a clear trend. The volume filter in this script addresses this issue by ensuring that trend changes are backed by significant market activity:
In choppy markets, price movements often lack strong volume, leading to false breakouts or reversals. By requiring volume to be a multiple (default: 2x) of the average volume over the lookback period, the script filters out these low-volume, low-conviction moves.This reduces the likelihood of taking bad trades during sideways markets, as only trend changes with strong volume confirmation will trigger signals. For example, on a daily chart of the S&P 500, a buy signal will only fire if the price crosses above the Supertrend line and the volume on that day is at least twice the 20-day average, indicating genuine buying pressure.
Usage Tips
Markets and Timeframes: This indicator is versatile and can be used on various assets (stocks, indices, forex, crypto) and timeframes (1-minute, 1-hour, daily, etc.). Adjust the settings based on the market's volatility and your trading strategy.
Combine with Other Indicators: While the volume filter improves reliability, consider using additional indicators like RSI or MACD to confirm trends, especially in ranging markets.
Backtesting: Test the indicator on historical data for your chosen market to optimize the settings and ensure they align with your trading goals.
Alerts: Set up alerts for buy and sell signals to stay informed of high-probability trend changes without constantly monitoring the chart.
ConclusionThe "Supertrend with Volume Filter Alert" is a powerful tool for trend-following traders, combining the simplicity of the Supertrend indicator with a volume-based filter to enhance signal accuracy. Its customizable settings make it adaptable to multiple markets, while the volume filter helps reduce false signals in choppy conditions, allowing traders to focus on high-probability trades. Whether you're trading stocks, indices, forex, or crypto, this indicator can help you identify trends with greater confidence.

VWAP Breakout Strategy + EMAs + Clean Cycle/TP/SL PlotsHere’s a quick user-guide to get you up and running with your “VWAP Breakout Strategy + EMAs + Clean Cycle/TP/SL Plots” script in TradingView:
⸻
1. Installing the Script
1. Open TradingView, go to Pine Editor (bottom panel).
2. Paste in your full Pine-v6 code and hit Add to chart.
3. Save it (“Save as…”): give it a memorable name (e.g. “VWAP Breakout+EMAs”).
⸻
2. Configuring Your Inputs
Once it’s on the chart, click the ⚙️ Settings icon to tune:
Setting Default What it does
ATR Length 14 Period for average true range (volatility measure)
ATR Multiplier for Stop 1.5 How many ATRs away your stop-loss sits
TP1 / TP2 Multipliers (ATR) 1.0 / 2.0 Distance of TP1 and TP2 in ATR multiples
Show VWAP / EMAs On Toggles the blue VWAP line & EMAs (100/34/5)
Full Cycle Range Points 200 Height of the shaded “cycle zone”
Pivot Lookback 5 How many bars back to detect a pivot low
Round Number Step 500 Spacing of your dotted horizontal lines
Show TP/SL Labels On Toggles all the “ENTRY”, “TP1”, “TP2”, “STOP” tags
Feel free to adjust ATR multipliers and cycle-zone size based on the instrument’s typical range.
⸻
3. Reading the Signals
• Long Entry:
• Trigger: price crosses above VWAP
• You’ll see a green “Buy” tag at the low of the signal bar, plus an “ENTRY (Long)” label at the close.
• Stop is plotted as a red dashed line below (ATR × 1.5), and TP1/TP2 as teal and purple lines above.
• Short Entry:
• Trigger: price crosses below VWAP
• A red “Sell” tag appears at the high, with “ENTRY (Short)” at the close.
• Stop is the green line above; TP1/TP2 are dashed teal/purple lines below.
⸻
4. Full Cycle Zone
Whenever a new pivot low is detected (using your Pivot Lookback), the script deletes the old box and draws a shaded yellow rectangle from that low up by “Full Cycle Range Points.”
• Use this to visualize the “maximum expected swing” from your pivot.
• You can quickly see whether price is still traveling within a normal cycle or has overstretched.
⸻
5. Round-Number Levels
With Show Round Number Levels enabled, you’ll always get horizontal dotted lines at the nearest multiples of your “Round Number Step” (e.g. every 500 points).
• These often act as psychological support/resistance.
• Handy to see confluence with VWAP or cycle-zone edges.
⸻
6. Tips & Best-Practices
• Timeframes: Apply on any intraday chart (5 min, 15 min, H1…), but match your ATR length & cycle-points to the timeframe’s typical range.
• Backtest first: Use the Strategy Tester tab to review performance, tweak ATR multipliers or cycle size, then optimize.
• Combine with context: Don’t trade VWAP breakouts blindly—look for confluence (e.g. support/resistance zones, higher-timeframe trend).
• Label clutter: If too many labels build up, you can toggle Show TP/SL Labels off and rely just on the lines.
⸻
That’s it! Once you’ve added it to your chart and dialed in the inputs, your entries, exits, cycle ranges, and key levels will all be plotted automatically. Feel free to experiment with the ATR multipliers and cycle-zone size until it fits your instrument’s personality. Happy trading!

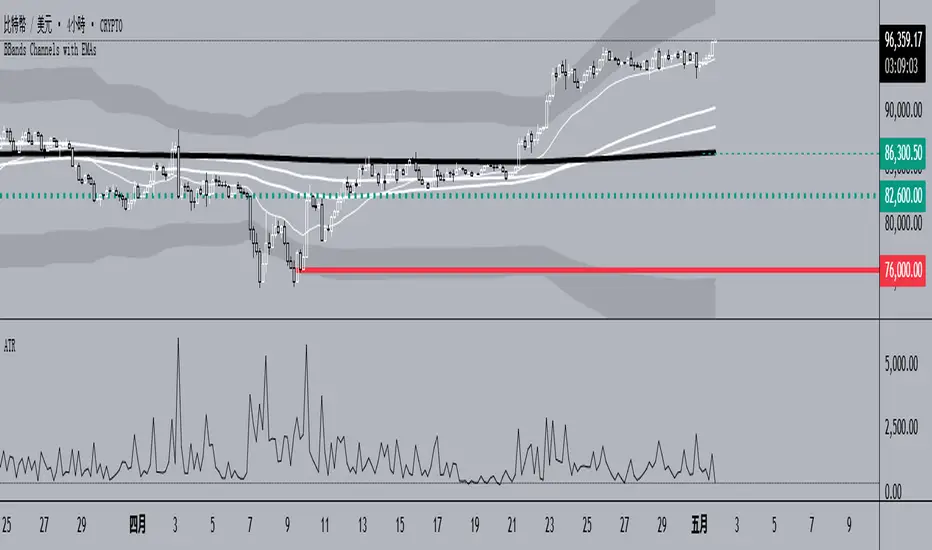
BBands Channels with EMAs# **BBands Channels with EMAs Indicator Explanation**
---
## **📌 Feature Overview**
### **1. Bollinger Bands**
- **Basis Line**: 160-period SMA (adjustable)
- **Inner Bands**:
- **Upper**: Basis + 2× Standard Deviation
- **Lower**: Basis - 2× Standard Deviation
- **Outer Bands**:
- **Upper Top**: Basis + 3× Standard Deviation
- **Lower Low**: Basis - 3× Standard Deviation
- **Fill Effect**: Semi-transparent black fill between inner and outer bands
### **2. Exponential Moving Averages (EMAs)**
| Period | Purpose | Line Style |
|--------------|-----------------------------|------------------|
| **EMA 27** | Short-term trend | Thin line |
| **EMA 120** | Short-to-medium-term trend | Medium line |
| **EMA 200** | Medium-term trend | Medium line |
| **EMA 1120** | Ultra-long-term trend | Thick line |
---
## **⚙️ Parameter Settings**
### **Bollinger Bands**
| Parameter | Default | Description |
|---------------|---------|--------------------------------------|
| `length` | 160 | SMA calculation period |
| `mult` | 2.0 | Standard deviation multiplier (inner bands) |
| `multOuter` | 3.0 | Standard deviation multiplier (outer bands) |
| `offset` | 0 | Time offset for plots (±500 bars) |
### **Exponential Moving Averages (EMAs)**
| Parameter | Default | Description |
|-----------------|---------|---------------------------|
| `ema1Length` | 27 | EMA 1 period |
| `ema2Length` | 120 | EMA 2 period |
| `ema3Length` | 200 | EMA 3 period |
| `ema4Length` | 1120 | EMA 4 period |
---
## **📊 Use Cases**
### **1. Trend Confirmation**
- **Bullish Trend**: Price above EMA200 + Bollinger Band expansion
- **Bearish Trend**: Price below EMA200 + Bollinger Band expansion
### **2. Overbought/Oversold Signals**
- **Upper Band Touch**: Price reaches Upper Top → Potential overbought
- **Lower Band Touch**: Price reaches Lower Low → Potential oversold
### **3. Volatility Strategies**
- **Band Squeeze**: Narrowing gap between bands → Breakout warning
- **Band Expansion**: Price breaks outer band → Trend acceleration
---
**✅ Summary**
This indicator combines **Bollinger Bands + Multi-period EMAs** for:
- Trend tracking
- Volatility analysis
- Multi-timeframe strategies
---
# **BBands Channels with EMAs 指標說明**
---
## **📌 功能概述**
### **1. 布林通道 (Bollinger Bands)**
- **基礎線 (Basis Line)**: 160週期SMA(可調整)
- **內通道 (Inner Bands)**:
- 上軌 (Upper): 基礎線 + 2倍標準差
- 下軌 (Lower): 基礎線 - 2倍標準差
- **外通道 (Outer Bands)**:
- 上外軌 (Upper Top): 基礎線 + 3倍標準差
- 下外軌 (Lower Low): 基礎線 - 3倍標準差
- **填充效果**: 內外通道間半透明黑色填充
### **2. 指數移動平均線 (EMAs)**
| 週期 | 用途 | 線條樣式 |
|-------------|-------------------|-----------------|
| **EMA 27** | 短期趨勢 | 細線 |
| **EMA 120** | 中短期趨勢 | 中等線 |
| **EMA 200** | 中期趨勢 | 中等線 |
| **EMA 1120**| 超長期趨勢 | 粗線 |
---
## **⚙️ 參數設定**
### **布林通道 (Bollinger Bands)**
| 參數名 | 預設值 | 說明 |
|-------------|--------|---------------------------|
| `length` | 160 | SMA計算週期 |
| `mult` | 2.0 | 內通道標準差倍數 |
| `multOuter` | 3.0 | 外通道標準差倍數 |
| `offset` | 0 | 線圖時間偏移(±500根K棒) |
### **指數移動平均線 (EMAs)**
| 參數名 | 預設值 | 說明 |
|----------------|---------|-------------------|
| `ema1Length` | 27 | 第一條EMA週期 |
| `ema2Length` | 120 | 第二條EMA週期 |
| `ema3Length` | 200 | 第三條EMA週期 |
| `ema4Length` | 1120 | 第四條EMA週期 |
---
## **📊 應用場景**
### **1. 趨勢確認**
- **多頭趨勢**: 價格在EMA200上方 + 布林通道擴張
- **空頭趨勢**: 價格在EMA200下方 + 布林通道擴張
### **2. 超買超賣信號**
- **觸及外軌**: 價格觸碰Upper Top → 可能超買
- **觸及下軌**: 價格觸碰Lower Low → 可能超賣
### **3. 波動率策略**
- **通道收窄**: 內外通道間距縮小 → 突破預警
- **通道擴張**: 價格突破外軌 → 趨勢加速
---
**✅ 總結**
本指標透過**布林通道+多週期EMA**的組合,適用於:
- 趨勢跟蹤
- 波動率分析
- 多時間框架策略
Breadth-Driven Swing StrategyWhat it does
This script trades the S&P 500 purely on market breadth extremes:
• Data source : INDEX:S5TH = % of S&P 500 stocks above their own 200-day SMA (range 0–100).
• Buy when breadth is washed-out.
• Sell when breadth is overheated.
It is long-only by design; shorting and ATR trailing stops have been removed to keep the logic minimal and transparent.
⸻
Signals in plain English
1. Long entry
A. A 200-EMA trough in breadth is printed and the trough value is ≤ 40 %.
or
B. A 5-EMA trough appears, its prominence passes the user threshold, and the lowest breadth reading in the last 20 bars is ≤ 20 %.
(Toggle this secondary trigger on/off with “ Enter also on 5-EMA trough ”.)
2. Exit (close long)
First 200-EMA peak whose breadth value is ≥ 70 %.
3. Risk control
A fixed stop-loss (% of entry price, default 8 %) is attached to every long trade.
⸻
Key parameters (defaults shown)
• Long EMA length 200 • Short EMA length 5
• Peak prominence 0.5 pct-pts • Trough prominence 3 pct-pts
• Peak level 70 % • Trough level 40 % • 5-EMA trough level 20 %
• Fixed stop-loss 8 %
• “Enter also on 5-EMA trough” = true (allows additional entries on extreme momentum reversals)
Feel free to tighten or relax any of these thresholds to match your risk profile or account for different market regimes.
⸻
How to use it
1. Load the script on a daily SPX / SPY chart.
(The price chart drives order execution; the breadth series is pulled internally and does not need to be on the chart.)
2. Verify the breadth feed.
INDEX:S5TH is updated after each session; your broker must provide it.
3. Back-test across several cycles.
Two decades of daily data is recommended to see how the rules behave in bear markets, range markets, and bull trends.
4. Adjust position sizing in the Properties tab.
The default is “100 % of equity”; change it if you prefer smaller allocations or pyramiding caps.
⸻
Why it can help
• Breadth signals often lead price, allowing entries before index-level momentum turns.
• Simple, rule-based exits prevent “waiting for confirmation” paralysis.
• Only one input series—easy to audit, no black-box math.
Trade-offs
• Relies on a single breadth metric; other internals (advance/decline, equal-weight returns, etc.) are ignored.
• May sit in cash during shallow pullbacks that never push breadth ≤ 40 %.
• Signals arrive at the end of the session (breadth is EoD data).
⸻
Disclaimer
This script is provided for educational purposes only and is not financial advice. Markets are risky; test thoroughly and use your own judgment before trading real money.
ストラテジー概要
本スクリプトは S&P500 のマーケットブレッド(内部需給) だけを手がかりに、指数をスイングトレードします。
• ブレッドデータ : INDEX:S5TH
(S&P500 採用銘柄のうち、それぞれの 200 日移動平均線を上回っている銘柄比率。0–100 %)
• 買い : ブレッドが極端に売られたタイミング。
• 売り : ブレッドが過熱状態に達したタイミング。
余計な機能を削り、ロングオンリー & 固定ストップ のシンプル設計にしています。
⸻
シグナルの流れ
1. ロングエントリー
• 条件 A : 200-EMA がトラフを付け、その値が 40 % 以下
• 条件 B : 5-EMA がトラフを付け、
・プロミネンス条件を満たし
・直近 20 本のブレッドス最小値が 20 % 以下
• B 条件は「5-EMA トラフでもエントリー」を ON にすると有効
2. ロング決済
最初に出現した 200-EMA ピーク で、かつ値が 70 % 以上 のバーで手仕舞い。
3. リスク管理
各トレードに 固定ストップ(初期価格から 8 %)を設定。
⸻
主なパラメータ(デフォルト値)
• 長期 EMA 長さ : 200 • 短期 EMA 長さ : 5
• ピーク判定プロミネンス : 0.5 %pt • トラフ判定プロミネンス : 3 %pt
• ピーク水準 : 70 % • トラフ水準 : 40 % • 5-EMA トラフ水準 : 20 %
• 固定ストップ : 8 %
• 「5-EMA トラフでもエントリー」 : ON
相場環境やリスク許容度に合わせて閾値を調整してください。
⸻
使い方
1. 日足の SPX / SPY チャート にスクリプトを適用。
2. ブレッドデータの供給 (INDEX:S5TH) がブローカーで利用可能か確認。
3. 20 年以上の期間でバックテスト し、強気相場・弱気相場・レンジ局面での挙動を確認。
4. 資金配分 は プロパティ → 戦略実行 で調整可能(初期値は「資金の 100 %」)。
⸻
強み
• ブレッドは 価格より先行 することが多く、天底を早期に捉えやすい。
• ルールベースの出口で「もう少し待とう」と迷わずに済む。
• 入力 series は 1 本のみ、ブラックボックス要素なし。
注意点・弱み
• 単一指標に依存。他の内部需給(A/D ライン等)は考慮しない。
• 40 % を割らない浅い押し目では機会損失が起こる。
• ブレッドは終値ベースの更新。ザラ場中の変化は捉えられない。
⸻
免責事項
本スクリプトは 学習目的 で提供しています。投資助言ではありません。
実取引の前に必ず自己責任で十分な検証とリスク管理を行ってください。

Market Breadth Peaks & Troughs IndicatorIndicator Overview
Market Breadth (S5TH) visualizes extremes of market strength and weakness by overlaying -
a 200-period EMA (long-term trend)
a 5-period EMA (short-term trend, user-adjustable)
on the percentage of S&P 500 constituents trading above their 200-day SMA (INDEX:S5TH).
Peaks (▼) and troughs (▲) are detected with prominence filters so you can quickly spot overbought and oversold conditions.
⸻
1. Core Logic
Component Description
Breadth series INDEX:S5TH — % of S&P 500 stocks above their 200-SMA
Long EMA 200-EMA to capture the primary trend
Short EMA 5-EMA (default, editable) for short-term swings
Peak detection ta.pivothigh + prominence ⇒ major peaks marked with red ▼
Trough detection (200 EMA) ta.pivotlow + prominence + value < longTroughLvl ⇒ blue ▲
Trough detection (5 EMA) ta.pivotlow + prominence + value < shortTroughLvl ⇒ green ▲
Background shading Pink when 200 EMA slope is down and 5 EMA sits below 200 EMA
⸻
2. Adjustable Parameters (input())
Group Variable Default Purpose
Symbol breadthSym INDEX:S5TH Breadth index
Long EMA longLen 200 Period of long EMA
Short EMA shortLen 5 Period of short EMA
Pivot width (long) pivotLen 20 Bars left/right for 200-EMA peaks/troughs
Pivot width (short) pivotLenS 10 Bars for 5-EMA troughs
Prominence (long) promThresh 0.5 %-pt Depth filter for 200-EMA pivots
Prominence (short) promThreshS 3.0 %-pt Depth filter for 5-EMA pivots
Trough level (long) longTroughLvl 50 % Max value to accept a 200-EMA trough
Trough level (short) shortTroughLvl 30 % Max value to accept a 5-EMA trough
⸻
3. Signal Guide
Marker / Color Meaning Typical reading
Red ▼ Major breadth peak Overbought / possible top
Blue ▲ Deep 200-EMA trough End of mid-term correction
Green ▲ Shallow 5-EMA trough (early) Short-term rebound setup
Pink background Long-term down-trend and short-term weak Risk-off phase
⸻
4. Typical Use Cases
1. Counter-trend timing
• Fade greed: trim longs on red ▼
• Buy fear: scale in on green ▲; add on blue ▲
2. Trend filter
• Avoid new longs while the background is pink; wait for a trough & recovery.
3. Risk management
• Reduce exposure when peaks appear, reload partial size on confirmed troughs.
⸻
5. Notes & Tips
• INDEX:S5TH is sourced from TradingView and may be back-adjusted when index membership changes.
• Fine-tune pivotLen, promThresh, and level thresholds to match current volatility before relying on alerts or automated rules.
• Slope thresholds (±0.10 %-pt) that trigger background shading can also be customized for different market regimes.

SMT SwiftEdge PowerhouseSMT SwiftEdge Powerhouse: Precision Trading with Divergence, Liquidity Grabs, and OTE Zones
The SMT SwiftEdge Powerhouse is a powerful trading tool designed to help traders identify high-probability entry points during the most active market sessions—London and New York. By combining Smart Money Technique (SMT) Divergence, Liquidity Grabs, and Optimal Trade Entry (OTE) Zones, this script provides a unique and cohesive strategy for capturing market reversals with precision. Whether you're a scalper or a swing trader, this indicator offers clear visual signals to enhance your trading decisions on any timeframe.
What Does This Script Do?
This script integrates three key concepts to identify potential trading opportunities:
SMT Divergence:
SMT Divergence compares the price action of two correlated assets (e.g., Nasdaq and S&P 500 futures) to detect hidden market reversals. When one asset makes a higher high while the other makes a lower high (bearish divergence), or one makes a lower low while the other makes a higher low (bullish divergence), it signals a potential reversal. This technique leverages institutional "smart money" behavior to anticipate market shifts.
Liquidity Grabs:
Liquidity Grabs occur when price breaks above recent highs or below recent lows on higher timeframes (5m and 15m), often triggering stop-loss orders from retail traders. These breakouts are identified using pivot points and confirm institutional activity, setting the stage for a reversal. The script focuses on liquidity grabs during the London and New York sessions for maximum market activity.
Optimal Trade Entry (OTE) Zones:
OTE Zones are Fibonacci-based retracement areas (e.g., 61.8%) calculated after a liquidity grab. These zones highlight where price is likely to retrace before continuing in the direction of the reversal, offering a high-probability entry point. The script adjusts the width of these zones using the Average True Range (ATR) to adapt to market volatility.
By combining these components, the script identifies when institutional activity (liquidity grabs) aligns with market reversals (SMT divergence) and pinpoints precise entry points (OTE zones) during high-liquidity sessions.
Why Combine These Components?
The integration of SMT Divergence, Liquidity Grabs, and OTE Zones creates a robust trading system for several reasons:
Synergy of Institutional Signals: SMT Divergence and Liquidity Grabs both reflect "smart money" behavior—divergence shows hidden reversals, while liquidity grabs confirm institutional intent to trap retail traders. Together, they provide a strong foundation for identifying high-probability setups.
Session-Based Precision: Focusing on the London and New York sessions ensures signals occur during periods of high volatility and liquidity, increasing their reliability.
Precision Entries with OTE: After confirming a setup with divergence and liquidity grabs, OTE zones provide a clear entry area, reducing guesswork and improving trade accuracy.
Adaptability: The script works on any timeframe, with adjustable settings for signal sensitivity, session times, and Fibonacci levels, making it versatile for different trading styles.
This combination makes the script unique by aligning institutional insights with actionable entry points, tailored to the most active market hours.
How to Use the Script
Setup:
Add the script to your chart (works on any timeframe, e.g., 1m, 5m, 15m).
Configure the settings in the indicator's inputs:
Session Settings: Adjust the start/end times for London and New York sessions (default: London 8-11 UTC, New York 13-16 UTC). You can disable session restrictions if desired.
Asset Settings: Set the primary and secondary assets for SMT Divergence (default: NQ1! and ES1!). Ensure the assets are correlated.
Signal Settings: Adjust the lookback period, ATR period, and signal sensitivity (Low/Medium/High) to control the frequency of signals.
OTE Settings: Choose the Fibonacci level for OTE zones (default: 61.8%).
Visual Settings: Enable/disable OTE zones, SMT labels, and debug labels for troubleshooting.
Interpreting Signals:
Blue Circles: Indicate a liquidity grab (price breaking a 5m or 15m pivot high/low), marking the start of a potential setup.
Blue OTE Zones: Appear after a liquidity grab, showing the retracement area (e.g., 61.8% Fibonacci level) where price is likely to enter for a reversal trade. The label "OTE Trigger 5m/15m" confirms the direction (Short/Long) and session.
Green/Red Entry Boxes: Mark precise entry points when price enters the OTE zone and confirms the SMT Divergence. Green boxes indicate a long entry, red boxes a short entry.
Trading Example:
On a 1m chart, a blue circle appears when price breaks a 5m pivot high during the London session.
A blue OTE zone forms, showing a retracement area (e.g., 61.8% Fibonacci level) with the label "OTE Trigger 5m/15m (Short, London)".
Price retraces into the OTE zone, and a red "Short Entry" box appears, confirming a bearish SMT Divergence.
Enter a short trade at the red box, with a stop-loss above the OTE zone and a take-profit at the next support level.
Originality and Utility
The SMT SwiftEdge Powerhouse stands out by merging SMT Divergence, Liquidity Grabs, and OTE Zones into a single, session-focused indicator. Unlike traditional indicators that focus on one aspect of price action, this script combines institutional reversal signals with precise entry zones, tailored to the most active market hours. Its adaptability across timeframes, customizable settings, and clear visual cues make it a versatile tool for traders seeking to capitalize on smart money movements with confidence.
Tips for Best Results
Use on correlated assets like NQ1! (Nasdaq futures) and ES1! (S&P 500 futures) for accurate SMT Divergence.
Test on lower timeframes (1m, 5m) for scalping or higher timeframes (15m, 1H) for swing trading.
Adjust the "Signal Sensitivity" to "High" for more signals or "Low" for fewer, high-quality setups.
Enable "Show Debug Labels" if signals are not appearing as expected, to troubleshoot pivot points and liquidity grabs.

Rolling Beta against SPY📈 Pine Script Showcase: Rolling Beta Against SPY
Understanding how your favorite stock or ETF moves in relation to a benchmark like the S&P 500 can offer powerful insights into risk and exposure. This script calculates and visualizes the rolling beta of any asset versus the SPY ETF (which tracks the S&P 500).
🧠 What Is Beta?
Beta measures the sensitivity of an asset's returns to movements in the broader market. A beta of:
- 1.0 means the asset moves in lockstep with SPY,
- >1.0 indicates higher volatility than the market,
- <1.0 implies lower volatility or possible defensive behavior,
- <0 suggests inverse correlation (e.g., hedging instruments).
🧮 How It Works
This script computes rolling beta over a user-defined window (default = 60 periods) using classic linear regression math:
- Calculates daily returns for both the asset and SPY.
- Computes covariance between the two return streams.
- Divides by the variance of SPY returns to get beta.
⚙️ Customization
You can adjust the window size to control the smoothing:
- Shorter windows capture recent volatility changes,
- Longer windows give more stable, long-term estimates.
📊 Visual Output
The script plots the beta series dynamically, allowing you to observe how your asset’s correlation to SPY evolves over time. This is especially useful in regime-change environments or during major macroeconomic shifts.
💡 Use Cases
- Portfolio construction: Understand how your assets co-move with the market.
- Risk management: Detect when beta spikes—potentially signaling higher market sensitivity.
- Market timing: Use beta shifts to infer changing investor sentiment or market structure.
📌 Pro Tip: Combine this rolling beta with volatility, Sharpe ratio, or correlation tracking for a more robust factor-based analysis.
Ready to add a layer of quantitative insight to your chart? Add the script to your watchlist and start analyzing your favorite tickers against SPY today!

Combined EMA Technical AnalysisThis script is written in Pine Script (version 5) for TradingView and creates a comprehensive technical analysis indicator called "Combined EMA Technical Analysis." It overlays multiple technical indicators on a price chart, including Exponential Moving Averages (EMAs), VWAP, MACD, PSAR, RSI, Bollinger Bands, ADX, and external data from the S&P 500 (SPX) and VIX indices. The script also provides visual cues through colors, shapes, and a customizable table to help traders interpret market conditions.
Here’s a breakdown of the script:
---
### **1. Purpose**
- The script combines several popular technical indicators to analyze price trends, momentum, volatility, and market sentiment.
- It uses color coding (green for bullish, red for bearish, gray/white for neutral) and a table to display key information.
---
### **2. Custom Colors**
- Defines custom RGB colors for bullish (`customGreen`), bearish (`customRed`), and neutral (`neutralGray`) signals to enhance visual clarity.
---
### **3. User Inputs**
- **EMA Colors**: Users can customize the colors of five EMAs (8, 20, 9, 21, 50 periods).
- **MACD Settings**: Adjustable short length (12), long length (26), and signal length (9).
- **RSI Settings**: Adjustable length (14).
- **Bollinger Bands Settings**: Length (20), multiplier (2), and proximity threshold (0.1% of band width).
- **ADX Settings**: Adjustable length (14).
- **Table Settings**: Position (e.g., "Bottom Right") and text size (e.g., "Small").
---
### **4. Indicator Calculations**
#### **Exponential Moving Averages (EMAs)**
- Calculates five EMAs: 8, 20, 9, 21, and 50 periods based on the closing price.
- Used to identify short-term and long-term trends.
#### **Volume Weighted Average Price (VWAP)**
- Resets daily and calculates the average price weighted by volume.
- Color-coded: green if price > VWAP (bullish), red if price < VWAP (bearish), white if neutral.
#### **MACD (Moving Average Convergence Divergence)**
- Uses short (12) and long (26) EMAs to compute the MACD line, with a 9-period signal line.
- Displays "Bullish" (green) if MACD > signal, "Bearish" (red) if MACD < signal.
#### **Parabolic SAR (PSAR)**
- Calculated with acceleration factors (start: 0.02, increment: 0.02, max: 0.2).
- Indicates trend direction: green if price > PSAR (bullish), red if price < PSAR (bearish).
#### **Relative Strength Index (RSI)**
- Measures momentum over 14 periods.
- Highlighted in green if > 70 (overbought), red if < 30 (oversold), white otherwise.
#### **Bollinger Bands (BB)**
- Uses a 20-period SMA with a 2-standard-deviation multiplier.
- Color-coded based on price position:
- Green: Above upper band or close to it.
- Red: Below lower band or close to it.
- Gray: Neutral (within bands).
#### **Average Directional Index (ADX)**
- Manually calculates ADX to measure trend strength:
- Strong trend: ADX > 25.
- Very strong trend: ADX > 50.
- Direction: Bullish if +DI > -DI, bearish if -DI > +DI.
#### **EMA Crosses**
- Detects bullish (crossover) and bearish (crossunder) events for:
- EMA 9 vs. EMA 21.
- EMA 8 vs. EMA 20.
- Visualized with green (bullish) or red (bearish) circles.
#### **SPX and VIX Data**
- Fetches daily closing prices for the S&P 500 (SPX) and VIX (volatility index).
- SPX trend: Bullish if EMA 9 > EMA 21, bearish if EMA 9 < EMA 21.
- VIX levels: High (> 25, fear), Low (< 15, stability).
- VIX color: Green if SPX bullish and VIX low, red if SPX bearish and VIX high, white otherwise.
---
### **5. Visual Outputs**
#### **Plots**
- EMAs, VWAP, and PSAR are plotted on the chart with their respective colors.
- EMA crosses are marked with circles (green for bullish, red for bearish).
#### **Table**
- Displays a summary of indicators in a customizable position and size.
- Indicators shown (if enabled):
- EMA 8/20, 9/21, 50: Green dot if bullish, red if bearish.
- VWAP: Green if price > VWAP, red if price < VWAP.
- MACD: Green if bullish, red if bearish.
- MACD Zero: Green if MACD > 0, red if MACD < 0.
- PSAR: Green if price > PSAR, red if price < PSAR.
- ADX: Arrows for very strong trends (↑/↓), dots for weaker trends, colored by direction.
- Bollinger Bands: Arrows (↑/↓) or dots based on price position.
- RSI: Numeric value, colored by overbought/oversold levels.
- VIX: Numeric value, colored based on SPX trend and VIX level.
---
### **6. Alerts**
- Triggers alerts for EMA 8/20 crosses:
- Bullish: "EMA 8/20 Bullish Cross on Candle Close!"
- Bearish: "EMA 8/20 Bearish Cross on Candle Close!"
---
### **7. Key Features**
- **Flexibility**: Users can toggle indicators on/off in the table and adjust parameters.
- **Visual Clarity**: Consistent use of green (bullish), red (bearish), and neutral colors.
- **Comprehensive**: Combines trend, momentum, volatility, and market sentiment indicators.
---
### **How to Use**
1. Add the script to TradingView.
2. Customize inputs (colors, lengths, table position) as needed.
3. Interpret the chart and table:
- Green signals suggest bullish conditions.
- Red signals suggest bearish conditions.
- Neutral signals indicate indecision or consolidation.
4. Set up alerts for EMA crosses to catch trend changes.
This script is ideal for traders who want a multi-indicator dashboard to monitor price action and market conditions efficiently.

EMA 10/55/200 - LONG ONLY MTF (4h with 1D & 1W confirmation)Title: EMA 10/55/200 - Long Only Multi-Timeframe Strategy (4h with 1D & 1W confirmation)
Description:
This strategy is designed for trend-following long entries using a combination of exponential moving averages (EMAs) on the 4-hour chart, confirmed by higher timeframe trends from the daily (1D) and weekly (1W) charts.
🔍 How It Works
🔹 Entry Conditions (4h chart):
EMA 10 crosses above EMA 55 and price is above EMA 55
OR
EMA 55 crosses above EMA 200
OR
EMA 10 crosses above EMA 500
These entries indicate short-term momentum aligning with medium/long-term trend strength.
🔹 Confirmation (multi-timeframe alignment):
Daily (1D): EMA 55 is above EMA 200
Weekly (1W): EMA 55 is above EMA 200
This ensures that we only enter long trades when the higher timeframes support an uptrend, reducing false signals during sideways or bearish markets.
🛑 Exit Conditions
Bearish crossover of EMA 10 below EMA 200 or EMA 500
Stop Loss: 5% below entry price
⚙️ Backtest Settings
Capital allocation per trade: 10% of equity
Commission: 0.1%
Slippage: 2 ticks
These are realistic conditions for crypto, forex, and stocks.
📈 Best Used On
Timeframe: 4h
Instruments: Trending markets like BTC/ETH, FX majors, or growth stocks
Works best in volatile or trending environments
⚠️ Disclaimer
This is a backtest tool and educational resource. Always validate on demo accounts before applying to real capital. Do your own due diligence.

BTC & SPX vs Yield Curve: Recession Risk ZonesBTC & SPX vs Yield Curve – Recession Risk Zones
This tool helps you track Bitcoin (BTC) and the S&P 500 (SPX) against key macro signals from the U.S. yield curve to spot potential recession risks.
🟪 Color Legend:
🔴 Red = Yield curve is inverted (warning starts)
🟡 Yellow = Projected 6–18 month recession risk (if inversion still active)
🟠 Orange = Active 6–18 month risk window (after inversion ends)
💜 Fuchsia = Real historical U.S. recessions
📈 What’s Plotted:
🔵 BTCUSD (blue line) – Normalized price
🟢 S&P 500 (green line) – Normalized price
🟠 10Y–2Y Yield Spread – Macro signal for risk
✅ Use it to:
Spot macro pressure zones
See how BTC and SPX behave around economic stress
Stay cautious when red/orange/yellow areas appear
Let me know if you'd like to enable toggles to hide/show BTC or SPX independently!

Risk MeterRisk Meter Indicator for TradingView
The Risk Meter is a powerful market risk assessment tool designed to help traders evaluate the current risk environment using a simple, data-driven score. By analyzing four critical market factors—VIX (volatility index), market breadth, trailing volatility, and credit spreads—the indicator generates a risk score between 0 and 4. This score empowers traders to make informed decisions about hedging, exiting positions, or re-entering the market, with clear visual cues and alerts for intraday monitoring.
What It Does
Calculates a Risk Score: Assigns a score from 0 to 4, where each point reflects an active risk condition based on four market indicators.
Identifies Risk Levels:
A score of 3 or higher indicates a high-risk environment, suggesting traders consider hedging or reducing exposure.
A score of 2 or lower for at least two consecutive days signals a potential opportunity to re-enter the market.
Provides Visual Feedback: Uses color-coded Columns, threshold markers, and a component table for quick interpretation.
Supports Decision-Making: Offers a structured approach to managing risk and timing trades.
How It Works
The Risk Meter aggregates four key risk conditions, each contributing 1 point to the total score when triggered:
Elevated and Rising VIX (Risk 1)
Condition: The VIX is above 18 and higher than it was 20 days ago.
Purpose: Detects increasing market fear or uncertainty.
Market Breadth Dropping (Risk 2)
Condition: Either:
Fewer than 50% of S&P 500 stocks are above their 200-day moving average and fewer than 70% are above their 50-day moving average, or
The 3-day EMA of the 200-day breadth falls below 80% of its 20-day SMA.
Purpose: Identifies weakening participation across the market.
Trailing Volatility (Risk 3)
Condition: The 30-day annualized volatility of the equal-weight S&P 500 (RSP) exceeds 35%.
Purpose: Highlights periods of heightened price instability.
Credit Spreads (Risk 4)
Condition: The price ratio of high-yield bonds (HYG) to Treasuries (TLT or IEF) is lower than it was 20 days ago, indicating widening credit spreads.
Purpose: Signals potential stress in credit markets.
The total risk score is the sum of these conditions (0 to 4). Additionally, the indicator tracks consecutive days with a score of 2 or lower to generate re-entry signals.
How to Read It Intraday
The Risk Meter is built on daily data but can be monitored intraday for real-time insights. Here’s how traders can interpret it:
Risk Score Plot:
Displayed as a step line ranging from 0 to 4.
Colors:
Red: High risk (score ≥ 3) – caution advised.
Green: Re-entry signal – score ≤ 2 for at least two consecutive days (triggered when the count increments from 1 to 2).
Blue: Neutral or low risk (score < 3 without a re-entry signal).
Threshold Lines:
Dashed Gray Line at 3: Marks the high-risk threshold.
Dotted Gray Line at 2: Indicates the low-risk threshold for re-entry signals.
Risk Component Table:
Located in the top-right corner, it lists:
VIX, Breadth, Volatility, and Credit Spreads.
Status: Shows "" (warning, red) if the risk condition is met, or "✓" (safe, blue) if not.
Helps traders pinpoint which factors are driving the score.
Alerts:
High Risk Alert: Triggers when the score moves from < 3 to ≥ 3.
Re-entry Signal Alert: Triggers when the score ≤ 2 for two consecutive days.
Intraday Usage Tips
Check the indicator throughout the day for early signs of risk shifts, especially if the score is near a threshold (e.g., 2 or 3).
Combine with other intraday tools (e.g., price action, volume) since the Risk Meter updates daily but reflects broader market conditions.
How Traders Can Use It
High-Risk Signal (Score ≥ 3):
Consider hedging positions (e.g., with options) or reducing equity exposure to protect against potential downturns.
Re-entry Signal (Score ≤ 2 for 2+ Days):
Look to re-enter the market or increase exposure, as it suggests stabilizing conditions.
Daily Risk Management:
Use the score and table to assess overall market health and adjust strategies accordingly.
Alert-Driven Trading:
Set up alerts to stay notified of critical risk changes without constant monitoring.
Why Use the Risk Meter?
This indicator offers a systematic, multi-factor approach to risk assessment, blending volatility, breadth, and credit market data into an easy-to-read score. Whether you’re an intraday trader or a longer-term investor, the Risk Meter helps you stay proactive, avoid surprises, and time your trades with greater confidence.
Financial Risk Disclaimer for the Risk Meter Tool
Important Notice: The Risk Meter is a market risk assessment tool designed to provide insights into current market conditions based on historical data and predefined indicators. It is intended for informational and educational purposes only and should not be considered financial advice, a recommendation to buy or sell any securities, or a guarantee of future market performance.
Key Considerations
No Guarantee of Accuracy: While the Risk Meter utilizes reliable data sources and established financial metrics, the creators do not guarantee the accuracy, completeness, or timeliness of the information provided. Financial markets are complex and subject to rapid, unpredictable changes, and the tool’s output may not fully reflect all market dynamics.
Market Risks: Trading and investing in financial markets carry significant risks, including the potential loss of principal. Market volatility, economic shifts, and other factors can lead to unexpected outcomes. Past performance is not a reliable indicator of future results, and the Risk Meter’s assessments are based on historical data, not future predictions.
Not a Substitute for Professional Advice: The Risk Meter is not intended to replace personalized financial guidance. Users are strongly encouraged to consult a qualified financial advisor, perform their own research, and evaluate their personal financial situation, risk tolerance, and investment objectives before making any trading or investment decisions.
Limitation of Liability: The creators of the Risk Meter, including any affiliates, developers, or contributors, are not liable for any direct, indirect, incidental, or consequential losses or damages arising from the use of this tool. This includes, but is not limited to, financial losses, missed opportunities, or decisions based on the tool’s output.
User Responsibility: By using the Risk Meter, you accept full responsibility for your trading and investment decisions. You acknowledge that you use the tool at your own risk and that the creators bear no responsibility for any outcomes resulting from its use.
Final Note
The Risk Meter is a supplementary tool designed to enhance your understanding of market risk. It is not a comprehensive solution for investment management. Approach trading and investing with caution, ensuring your decisions align with your personal financial strategy.

Panic Drop Stock Market Bull/Bear Market Panic Drop Bull/Bear
What It Does:
This indicator identifies bull and bear markets for the S&P 500 (or any stock/index) using the 50-period and 150-period Simple Moving Averages (SMAs). A green background signals a confirmed bull market when the 50 SMA is above the 150 SMA and the 150 SMA slope is flat or upward. A red background signals a confirmed bear market when the 50 SMA is below the 150 SMA and the 150 SMA slope is downward. The background color persists until a new confirmed state is detected, ensuring no gaps—perfect for spotting long-term market trends whether you’re a beginner, trend trader, or long-term investor.
Key Features:
Plots 50 SMA (default: blue line) and 150 SMA (default: orange line).
Background highlights: green for bull markets, red for bear markets.
Persistent background color—no gaps during unconfirmed periods.
Alerts for confirmed bull and bear market transitions.
Fully adjustable: MA periods, slope lookback, and more.
How to Use It:
Add to your S&P 500 chart (e.g., SPX or SPY) on a daily or weekly timeframe (daily default recommended for long-term trends).
Watch for background color changes:
Green background: Confirmed bull market—consider long positions or holding.
Red background: Confirmed bear market—consider shorting or exiting longs.
Customize via settings:
Adjust MA periods (default: 50 and 150).
Set slope lookback (default: 5 bars) to control slope sensitivity.
Change MA colors if desired.
Set alerts: Right-click on the chart > "Add Alert" > Select "Bull Market Confirmed" or "Bear Market Confirmed."
Trade smart: Use the background to confirm market regimes—e.g., go long during green (bull) phases above key support levels, or protect capital during red (bear) phases.
Why It’s Great:
Beginners: Simple background colors make market trends easy to spot.
Trend Traders: 50/150 SMA crossover with slope confirmation catches major market shifts.
Long-Term Investors: Persistent background ensures you stay in the trend without noise.
Created by Timothy Assi (Panic Drop), eToro’s elite investor. Test it, tweak it, and trade with confidence!

GRID EXTENSIONGRID EXTENSION
Overview
The GRID EXTENSION is a simple grid-based indicator for TradingView, built with Pine Script v6. It plots horizontal price levels starting from a user-defined anchor price, with spacing set by a tick increment. Use it to identify key support, resistance, or price zones on charts for Crypto, Forex, or Futures.
Key Features
Custom Grid Levels: Plot up to 22 levels (e.g., 0, 0.25, 1.25, -2.50) with options to show/hide, set values, and choose colors.
Market-Specific Tick Increments: Select your asset type (Crypto, Forex, Futures) and choose from a range of tick increments tailored for each market:
Crypto: 1 to 5000 ticks (e.g., 100 ticks = $0.001 on ADA/USD, 5000 ticks = $50 on BTC/USD).
Forex: 5 to 5000 ticks (e.g., 100 ticks = 1 pip on EUR/USD, 5000 ticks = 50 pips).
Futures: 1 to 2500 ticks (e.g., 25 ticks = 6.25 points on E-mini S&P 500, $312.50 per contract).
Visual Options:
Extend lines to the right.
Show price and level labels (as values or percentages).
Place labels on the left or right.
Adjust background transparency for filled areas between levels.
How to Use
Set Asset Type: Choose "Crypto," "Forex," or "Futures" to match your chart.
Set Anchor Price: Enter a starting price for the grid.
Pick Tick Increment: Select a tick increment from the dropdown, following the guidance for your asset type (see Key Features).
Customize Levels: Turn levels on/off, set values, and pick colors.
Add to Chart: Apply the indicator to see the grid on your chart.
Tips
Use levels to mark support/resistance zones for entries or exits.
Extend lines to project future price zones.
Choose smaller increments (e.g., 5 ticks) for scalping, or larger ones (e.g., 1000 ticks) for swing trading.
Combine with indicators like moving averages for better signals.
Settings
Asset Type: Select "Crypto," "Forex," or "Futures" (default: "Crypto").
Anchor Price: Starting price for the grid (default: 0.0).
Tick Increment: Space between levels (options: 1, 5, 10, 25, 50, 100, 250, 500, 1000, 2500, 5000). Choose based on asset type.
Extend Right: Extend lines to the right (default: true).
Show Prices: Show price labels (default: true).
Show Levels: Show level values or percentages (default: true).
Format: Display levels as "Values" or "Percent" (default: "Values").
Labels Position: Place labels on "Left" or "Right" (default: "Left").
Background Transparency: Set transparency for filled areas (default: 100, range 0-100).
Level Options: Enable/disable levels, set values, and choose colors.
Notes
Set the anchor price to a key level (like a recent high or low) for best results.
Check the tick increment tooltip to ensure the spacing suits your market type.
Works on any chart, best for clear price trends or ranges.
Acknowledgments
Made with Pine Script v6 for TradingView. This is v1.0—feedback welcome for future updates!

Stock Highs Tracker with IndicesThis Pine Script indicator tracks stock highs and compares them with major indices (Nifty, Nifty 500, CNX-SmallCap, and CNX-MidCap). Here’s what it does:
1. Retrieves and Displays Key Price Metrics
All-Time High (ATH): The highest price the stock has ever reached.
52-Week High: The highest price in the last 252 trading days.
Current Price: The stock’s closing price.
2. Calculates Percentage Differences
% from ATH: How much the stock is below its all-time high.
% from 52WKH: How much the stock is below its 52-week high.
3. Fetches and Compares with Indices
It retrieves similar metrics (ATH, 52-Week High, Current Price, % from ATH, % from 52WKH) for:
Nifty 50
Nifty 500
CNX-SmallCap
CNX-MidCap
This helps in assessing whether the stock's movement aligns with broader market trends.
4. Displays Data in a Table
The script creates a table positioned at the top-right corner.
It color-codes different rows for easy readability.
The table compares the stock’s performance against the major indices.
Use Case
Helps traders and investors track stock highs relative to market indices.
Identifies whether the stock is outperforming or underperforming the broader market.
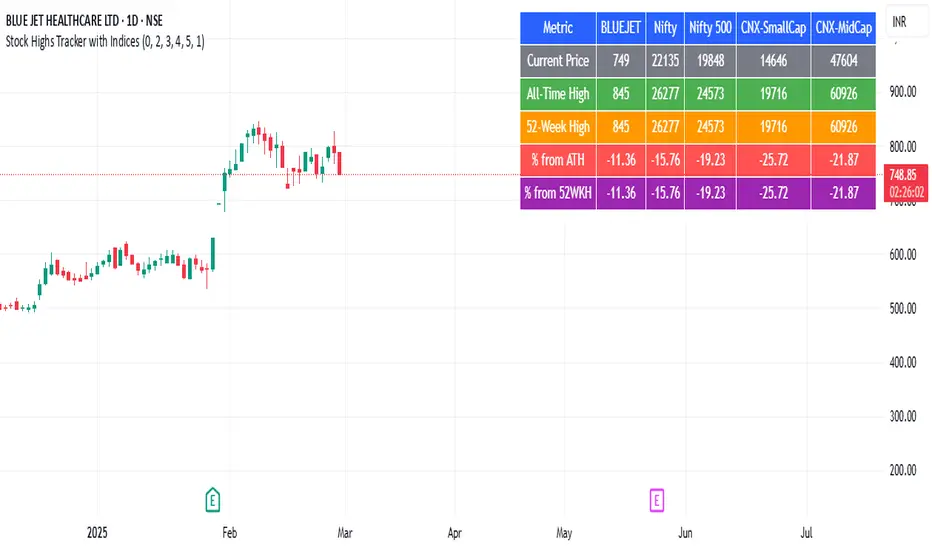
Multi-Timeframe VWMA chartThis "Multi-Timeframe VWMA Indicator" is a powerful tool for traders seeking to analyze price action across multiple timeframes using the Volume Weighted Moving Average (VWMA). Built in Pine Script v6, it overlays a customizable VWMA on your chart while displaying a table that tracks how your chosen price source (e.g., close, open, high, low) interacts with the VWMA across eight timeframes: 1m, 3m, 5m, 15m, 1h, 4h, 1d, and 1w.
Key features include adjustable inputs: select your price source, set the VWMA length (default 20), pick the line color (default blue), adjust line width (default 2), and apply an offset (default 0, range -500 to 500) to shift the VWMA for precise alignment. The VWMA is plotted on the current chart timeframe, scaling naturally with price due to the overlay setting.
The table, positioned top-right, shows each timeframe’s status: an upward arrow (↑, green) if the source is above the VWMA, indicating bullish momentum, or a downward arrow (↓, red) if below, suggesting bearish pressure. Using request.security, it fetches data efficiently, making it ideal for multi-timeframe analysis. Perfect for traders wanting a clear, customizable view of VWMA-based trends.

TPO IQ [TradingIQ]Hello Traders!
Introducing "TPO IQ"!
TPO IQ offers a Time Price Opportunity profile with several customization options that packs several related features to help traders navigate the generated profiles!
Features
TPO Profiles
Single Print identification
Initial Balance Identification
Can be anchored to timeframe change
Can be anchored to fixed time interval
Last profile detailed visuals
Customizable value area percentage
POC identification
Mid-point identification
TPO Profiles
A TPO profile is a market profile visualization that details how much time was spent at each price level throughout the time interval.
The image above further explains what a TPO Profile is!
Each letter corresponds to a candlestick. With this information, traders are able to visualize how much time was spent at each price area.
With customizable gradient colors, specifically in this example, blocks colored red are the earliest times in the profile, blocks colored green are in the beginning half of the time midpoint of the profile. Blue blocks represent the first half of the end of the time period, and purple blocks correspond to the end of the time period.
Please note that this form of TPO profile generation will only occur when the most recent profile uses less than 500 alphabet characters! If more than 500 characters are preset, TPO IQ will revert to using labels!
Initial Balance
TPO IQ also identifies the initial balance range and all alphabet characters that form within it!
The image above exemplifies this feature. The initial balance range is denoted by a a neon-blue line, with a blue circle showing the opening price. All characters within the initial balance range are highlighted blue, which is a feature that can be disabled with customizable colors.
POC
TPO IQ also identifies the point of control (POC) of the TPO Profile.
The point of control for the profile is labeled yellow by default, and shows where price spent the most time throughout the time period.
The image above shows the POC for the time period being identified by TPO IQ.
Value Area
TPO IQ also identifies the value area of the profile. A customizable percentage that is 70% by default, the value area of a TPO profile shows where price traded the majority of the time.
The image above further explains this feature. For this example, with the value area percentage being set to 70%, the value area high and value area low show the price zone that prices traded at 70% of the time throughout the profile.
TPO Midpoint
In addition to the POC, the TPO profile midpoint is also identified by TPO IQ.
The TPO midpoint simply corresponds to the middle price between the session's high and low!
Fixed Interval Mode
By default, TPO IQ recalculates every day, but this can also be changed to a customizable session time, such as 4 hours. If 4 hours is selected, then a new TPO profile will be generated every 4 hours.
However, in Fixed Interval mode, a TPO profile will be generated through a user-defined time range, such as 1300-1700.
In the image above, Fixed Interval mode is applied with a time range of 1300-1700 and, consequently, TPO IQ generates a new profile throughout every 1300-1700 time range!
This feature allows traders to specify time ranges of interest to generate TPO profiles for!
TPO Overview Label
The TPO overview label shows key statistics for the TPO profile generated throughout the trading session!
The "TPO Count" statistic shows how many alphabetical letters were generated for the profile, which is an adequate method to determine the session's volatility and price range.
The "Tick Levels" statistic shows how many tick levels were used to create the profile - another method to determine the volatility and price range of the session.
The "Top Letter" statistic shows which letter appears most throughout the profile. In this example, the top letter was "f", which means throughout creation of the profile, the letter "f" appeared the most!
And that's all for now!
If you have any feedback or new feature ideas for TPO IQ please feel free to share them with us!
Thank you traders!

200-Week EMA % Difference200-Week EMA Percentage Difference Indicator – Understanding Market Stretch & Reversion
What This Indicator Does
Even if an individual stock is delivering strong earnings and solid fundamentals, it is still influenced by overall market sentiment. When the broader market begins reverting to its long-term mean, stocks—no matter how strong—are often pulled down along with it. Unrealized gains can erode if one ignores these macro movements.
The 200-Week EMA Percentage Difference indicator measures how far the price of an asset or index has moved away from its 200-week Exponential Moving Average (EMA) in percentage terms. This provides a reliable gauge of whether the market is overstretched (overbought) or pulling back to support (oversold) relative to a long-term trend.
How It Helps Investors
Identifying Market Extremes:
When the indicator moves into the 50-80% range, historical trends show that broad-based indices like BSE Smallcap, Nifty 500, Nifty Microcap, and Nifty Smallcap 250 have often experienced corrections.
This suggests that the market may be overextended, and investors should exercise caution.
Spotting Support Zones:
Past data indicates that when the percentage difference falls back to around 30%, the market often finds a new support level, leading to fresh buying opportunities.
This can help long-term investors identify favorable entry points.
Mean Reversion & Market Cycles:
The indicator essentially measures how far these indices have stretched from their long-term mean (200-week EMA).
Extreme deviations from the EMA often result in mean reversion, where prices eventually return to more sustainable levels.
How to Use It in Broad-Based Indices
Above 50-80% → Caution Zone: Historically associated with market tops or overheated conditions.
Around 30% → Support Zone: A potential level where corrections stabilize and new market uptrends begin.
By applying this indicator to indices like BSE Smallcap, Nifty 500, Nifty Microcap, and Nifty Smallcap 250, investors can gauge market strength, anticipate corrections, and position themselves strategically for long-term opportunities.

measure last swing [keypoems]MEASURE LAST SWING
Version: v0.0.7
An indicator for measuring market swings and calculating position sizing based on pivot points and risk parameters. Helps traders visualize price swings and automatically compute position sizes based on their desired risk amount.
FEATURES:
• Identifies and tracks last pivot point in price action
• Displays visual measurements of price swing
• Calculates position sizes based on risk parameters
• Supports major futures contracts with automatic multiplier detection
HOW IT WORKS:
The indicator detects pivot highs and lows using your specified pivot strength, then draws measurement lines and calculates position sizes based on your risk parameters. It automatically cleans up old drawings when new pivot points are identified.
INPUT PARAMETERS:
General Settings:
• Risk Amount - Amount you want to risk per trade
• Pivot Strength - Bars required on either side to confirm a pivot
• Offset - Number of bars to offset the vertical line
Visual Settings:
• Horizontal and Vertical Lines - Customizable colors, widths (1-4), and styles
• Labels - Adjustable text color and size
CONTRACT MULTIPLIERS:
Automatically detects and applies the correct multiplier:
• ES (E-mini S&P 500): 50.0
• MES (Micro E-mini S&P 500): 5.0
• NQ (E-mini Nasdaq): 20.0
• MNQ (Micro E-mini Nasdaq): 2.0
• YM (E-mini Dow): 5.0
• MYM (Micro E-mini Dow): 0.5
• Other symbols: 1.0 (default)
DISPLAY ELEMENTS:
1. Horizontal line showing the level of the last pivot point
2. Vertical line measuring the distance to current price
3. Distance label showing point distance
4. Risk/Position label showing risk amount and calculated position size
POSITION SIZING:
Position Size = Floor(Risk Amount / (Distance in Points × Contract Multiplier))
IDEAL FOR:
• Measuring price swings for technical analysis
• Position sizing based on risk management rules
• Identifying potential entry and exit points
• Visual analysis of market structure
• Risk management automation
