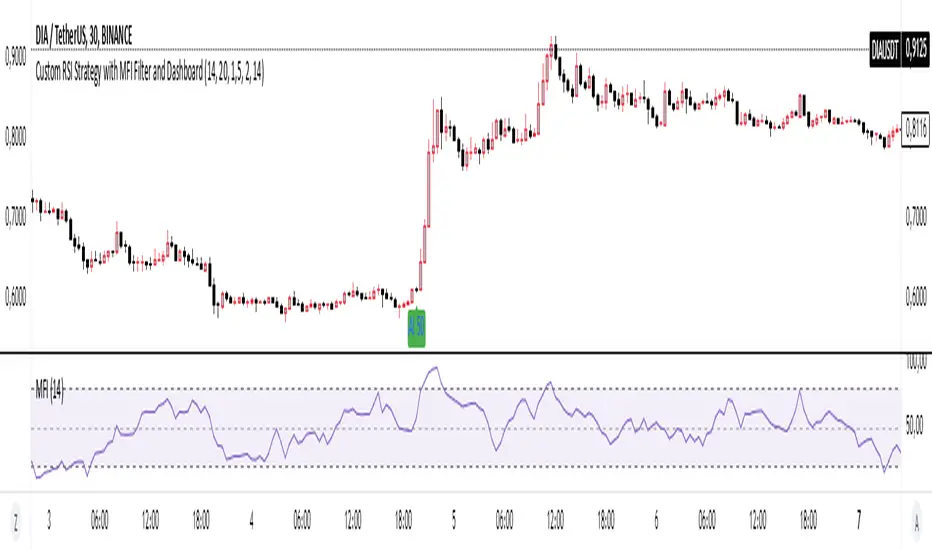
Basic RSI Strategy with MFI Description: This Pine Script is a custom trading strategy that combines the power of the RSI (Relative Strength Index) and MFI (Money Flow Index) indicators with additional signal filters and a user-friendly dashboard. The strategy is designed to identify potential entry and exit points based on dynamic conditions, providing an advanced approach to technical analysis and decision-making in trading.
Key Features:
RSI-Based Signals:
Generates buy signals when the RSI-based moving average crosses above specific thresholds (29 and 50).
Generates sell signals when the RSI-based moving average crosses below specific thresholds (50 and 69).
MFI Filtering:
Signals are validated only if the MFI value is within the specified range of 20 to 80, ensuring that signals are generated only when market conditions are favorable.
Dynamic Signal Thresholds:
The script includes adjustable thresholds for the percentage difference between consecutive bars, as well as the range between high and low prices, to refine signal accuracy.
Dashboard:
Displays real-time statistics in the top right corner of the chart, including the total number of signals, the count of buy and sell signals, and the time duration over which these signals were generated.
How to Use:
Settings: Customize the RSI and MFI lengths, along with thresholds for price movement and MFI range. This flexibility allows the strategy to be tailored to different market conditions and timeframes.
Dashboard Insight: Track the strategy's performance in real-time, with an intuitive overview of generated signals and their time distribution on the chart.
Ideal For:
This script is suitable for traders seeking a robust, customizable, and real-time signal generation strategy that combines momentum and volume indicators. The strategy’s unique filtering mechanism provides a higher level of precision, making it an excellent tool for those who prioritize signal accuracy and clarity.
Cerca negli script per "股价在8元左右净利润为正市值小于80亿的热门股票有哪些"
[3Commas] Signal BuilderSignal Builder is a tool designed to help traders create custom buy and sell signals by combining multiple technical indicators. Its flexibility allows traders to set conditions based on their specific strategy, whether they’re into scalping, swing trading, or long-term investing. Additionally, its integration with 3Commas bots makes it a powerful choice for those looking to automate their trades, though it’s also ideal for traders who prefer receiving alerts and making manual decisions.
🔵 How does Signal Builder work?
Signal Builder allows users to define custom conditions using popular technical indicators, which, when met, generate clear buy or sell signals. These signals can be used to trigger TradingView alerts, ensuring that you never miss a market opportunity. Additionally, all conditions are evaluated using "AND" logic, meaning signals are only activated when all user-defined conditions are met. This increases precision and helps avoid false signals.
🔵 Available indicators and recommended settings:
Signal Builder provides access to a wide range of technical indicators, each customizable to popular settings that maximize effectiveness:
RSI (Relative Strength Index): An oscillator that measures the relative strength of price over a specific period. Traders typically configure it with 14 periods, using levels of 30 (oversold) and 70 (overbought) to identify potential reversals.
MACD (Moving Average Convergence Divergence): A key indicator tracking the crossover between two moving averages. Common settings include 12 and 26 periods for the moving averages, with a 9-period signal line to detect trend changes.
Ultimate Oscillator: Combines three different time frames to offer a comprehensive view of buying and selling pressure. Popular settings are 7, 14, and 28 periods.
Bollinger Bands %B: Provides insight into where the price is relative to its upper and lower bands. Standard settings include a 20-period moving average and a standard deviation of 2.
ADX (Average Directional Index): Measures the strength of a trend. Values above 25 typically indicate a strong trend, while values below suggest weak or sideways movement.
Stochastic Oscillator: A momentum indicator comparing the closing price to its range over a defined period. Popular configurations include 14 periods for %K and 3 for %D smoothing.
Parabolic SAR: Ideal for identifying trend reversals and entry/exit points. Commonly configured with a 0.02 step and a 0.2 maximum.
Money Flow Index (MFI): Similar to RSI but incorporates volume into the calculation. Standard settings use 14 periods, with levels of 20 and 80 as oversold and overbought thresholds.
Commodity Channel Index (CCI): Measures the deviation of price from its average. Traders often use a 20-period setting with levels of +100 and -100 to identify extreme overbought or oversold conditions.
Heikin Ashi Candles: These candles smooth out price fluctuations to show clearer trends. Commonly used in trend-following strategies to filter market noise.
🔵 How to use Signal Builder:
Configure indicators: Select the indicators that best fit your strategy and adjust their settings as needed. You can combine multiple indicators to define precise entry and exit conditions.
Define custom signals: Create buy or sell conditions that trigger when your selected indicators meet the criteria you’ve set. For example, configure a buy signal when RSI crosses above 30 and MACD confirms with a bullish crossover.
TradingView alerts: Set up alerts in TradingView to receive real-time notifications when the conditions you’ve defined are met, allowing you to react quickly to market opportunities without constantly monitoring charts.
Monitor with the panel: Signal Builder includes a visual panel that shows active conditions for each indicator in real time, helping you keep track of signals without manually checking each indicator.
🔵 3Commas integration:
In addition to being a valuable tool for any trader, Signal Builder is optimized to work seamlessly with 3Commas bots through Webhooks. This allows you to automate your trades based on the signals you’ve configured, ensuring that no opportunity is missed when your defined conditions are met. If you prefer automation, Signal Builder can send buy or sell signals to your 3Commas bots, enhancing your trading process and helping you manage multiple trades more efficiently.
🔵 Example of use:
Imagine you trade in volatile markets and want to trigger a sell signal when:
Stochastic Oscillator indicates overbought conditions with the %K value crossing below 80.
Bollinger Bands %B shows the price has surpassed the upper band, suggesting a potential reversal.
ADX is below 20, indicating that the trend is weak and could be about to change.
With Signal Builder , you can configure these conditions to trigger a sell signal only when all are met simultaneously. Then, you can set up a TradingView alert to notify you as soon as the signal is activated, giving you the opportunity to react quickly and adjust your strategy accordingly.
👨🏻💻💭 If this tool helps your trading strategy, don’t forget to give it a boost! Feel free to share in the comments how you're using it or if you have any questions.
_________________________________________________________________
The information and publications within the 3Commas TradingView account are not meant to be and do not constitute financial, investment, trading, or other types of advice or recommendations supplied or endorsed by 3Commas and any of the parties acting on behalf of 3Commas, including its employees, contractors, ambassadors, etc.

Delayed Opening Price Line with GuardrailsThis Delayed Opening Price Line with Guardrails indicator will draw 5 price level lines on the chart each day, beginning at the open of the first candle after a delay period specified by the user in the indicator settings. The default delay is 30 minutes from market open.
The lines are drawn at the open price of the first candle after the delay period, and then a specified increment above and below that price level. These increments default to 80 and 100, and can be adjusted in the indicator settings.
Most markets, indices, and equities have a finite and consistent range of price movement within a trading day. Eg. a particular stock may usually move no more that $50 up or down in a given day, which can be proven by looking at a historical chart. This indicator allows the user to quickly display that range on the chart once it's been defined.
Important note: This indicator is designed to be used on an intra-day chart - eg. minutes, or hourly. It will give an error if used on a longer time-frame chart.

Money Wave Script (Visual Adaptive MFI)This Script is a visual modification of the Money Flow Index (MFI)
//@version=5
indicator(title="Money Flow Index", shorttitle="MFI", format=format.price, precision=2, timeframe="", timeframe_gaps=true)
length = input.int(title="Length", defval=14, minval=1, maxval=2000)
src = hlc3
mf = ta.mfi(src, length)
plot(mf, "MF", color=#7E57C2)
overbought=hline(80, title="Overbought", color=#787B86)
hline(50, "Middle Band", color=color.new(#787B86, 50))
oversold=hline(20, title="Oversold", color=#787B86)
fill(overbought, oversold, color=color.rgb(126, 87, 194, 90), title="Background")
This Money Wave Script is culled from. the Money Flow Index with visual representation to help traders identify money flow. In addition, the waves can be smoothened. Here’s a detailed overview based on its functionality, color coding, usage, risk management, and a concluding summary.
Functionality
The Money Wave Script operates as an oscillator that measures the inflow and outflow of money into an asset over a specified period. It calculates the MFI by considering both price and volume, which allows it to assess buying and selling pressures more accurately than traditional indicators that rely solely on price data.
Color Coding
The indicator employs a color-coded scheme to enhance visual interpretation:
Green Area: Indicates bullish conditions when the normalized Money wave is above zero, suggesting buying pressure.
Red Area: Indicates bearish conditions when the normalized Money wave is below zero, suggesting selling pressure.
Background Colors: The background changes to green when the MoneyWave exceeds the upper threshold (overbought) and red when it falls below the lower threshold (oversold), providing immediate visual cues about market conditions.
Usage
Traders utilize the Money Wave indicator in various ways:
Identifying Overbought and Oversold Levels: By observing the MFI readings, traders can determine when an asset may be overbought or oversold, prompting potential entry or exit points.
Spotting Divergences: Traders look for divergences between price and the MFI to anticipate potential reversals. For example, if prices are making new highs but the MFI is not, it could indicate weakening momentum.
Trend Confirmation: The indicator can help confirm trends by showing whether buying or selling pressure is dominating.
Customizable Settings: Users can adjust parameters such as the MFI length , Smoothen index and overbought/oversold thresholds to tailor the indicator to their trading strategies.
Conclusion
The Money Wave indicator is a powerful tool for traders seeking to analyze market conditions based on the flow of money into and out of assets. Its combination of price and volume analysis, along with clear visual cues, makes it an effective choice for identifying overbought and oversold conditions, spotting divergences, and confirming trends.

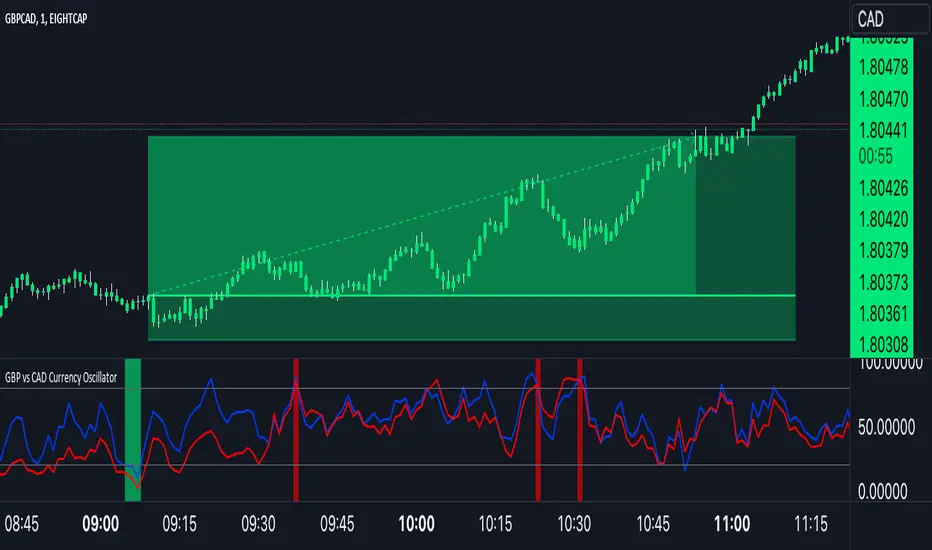
GBP Index vs CAD Index Currency OscillatorGBP vs CAD Currency Oscillator
This custom oscillator compares the relative strength of GBP (British Pound) and CAD (Canadian Dollar) against a basket of other currencies to determine potential overbought and oversold conditions. The indicator is designed to help traders evaluate momentum shifts and identify possible trend reversals between these two currencies, not just the GBPCAD pair.
How it Works:
Currency Index Calculation:
The oscillator calculates the average percentage change in 7 key GBP pairs (GBPUSD, EURGBP, GBPJPY, GBPAUD, GBPNZD, GBPCAD, and GBPCHF).
Similarly, it calculates the average percentage change for 7 key CAD pairs (USDCAD, EURCAD, CADJPY, AUDCAD, NZDCAD, GBPCAD, and CADCHF).
Stochastic Oscillator:
The indicator calculates a 0-100 oscillator for both the GBP and CAD currency indices based on the highest high and lowest low over a user-defined lookback period (default is 14 anlthough 60 works great on 1m chart).
The oscillator is smoothed using a simple moving average (default smoothing period is 3) to reduce noise and improve visual clarity.
Overbought/Oversold Conditions:
Overbought: When both the GBP and CAD oscillators exceed 80, the background turns red, indicating potential overbought conditions.
Oversold: When both oscillators fall below 20, the background turns green, signaling possible oversold conditions.
Crossovers:
When the GBP oscillator crosses above the CAD oscillator, a green dot appears at the bottom of the chart, signaling potential GBP strength.
When the GBP oscillator crosses below the CAD oscillator, a red dot appears, signaling potential CAD strength.
How to Use:
Overbought/Oversold Conditions: Use the red and green background highlights to spot potential overbought or oversold market conditions, helping you identify possible turning points.
Customization Options:
Lookback Period: You can adjust the lookback period for the stochastic calculation, allowing for sensitivity tuning (default: 14).
Smoothing Period: Control the degree of smoothing applied to the oscillators (default: 3).
This oscillator is ideal for traders focused on trading GBP and CAD pairs, offering a comparative analysis that can assist in better decision-making based on relative currency strength.
Color Library // AlgoFyreAlgoFyre's Color Library is a Pine Script v5 library offering fire-themed palettes with light and dark modes. It helps traders easily integrate consistent, visually appealing color schemes into TradingView indicators. Used in AlgoFyre's Scripts and Indicators.
Color Overview
The AlgoFyreColorLibrary includes a comprehensive set of colors inspired by fire, ranging from light reds and oranges to dark browns and deep reds. The library is divided into two main themes:
Light Theme:
Includes lighter shades of red, orange, and brown, suitable for use on light backgrounds.
Dark Theme:
Includes darker shades of red, orange, and brown, suitable for use on dark backgrounds.
How to Use
To use the AlgoFyreColorLibrary in your Pine Script indicators and strategies, follow these steps:
Import the Library:
Import the AlgoFyreColorLibrary at the beginning of your script.
Call the getColor Function:
Use the getColor function to retrieve the desired color with the specified transparency.
Example
//@version=5
import "AF-L-0001" as af
// Example usage of getColor function
color primaryColor = af.getColor("af_primary1", 50)
color signalColor = af.getColor("af_green", 80)
// Plotting example
plot(close, color=primaryColor, linewidth=2, title="Primary Color Line")
plot(close, color=signalColor, linewidth=2, title="Signal Color Line")
The library AF-L-0001 is imported with the alias af.
The getColor function is used to get colors with specified transparency.
The colors are then used to plot lines on the chart.

Uptrick: Crypto Volatility Index** Crypto Volatility Index(VIX) **
Overview
The Crypto Volatility Index (VIX) is a specialized technical indicator designed to measure the volatility of cryptocurrency prices. Leveraging advanced statistical methods, including logarithmic returns and variance, the Crypto VIX offers a refined measure of market fluctuations. This approach makes it particularly useful for traders in the highly volatile cryptocurrency market, providing insights that traditional volatility indicators may not capture as effectively.
Purpose
The Crypto VIX aims to deliver a nuanced understanding of market volatility, tailored specifically for the cryptocurrency space. Unlike other volatility measures, the Crypto VIX employs sophisticated statistical methods to reflect the unique characteristics of cryptocurrency price movements. This makes it especially valuable for cryptocurrency traders, helping them navigate the inherent volatility of digital assets and manage their trading strategies and risk exposure more effectively.
Calculation
1. Indicator Declaration
The Crypto VIX is plotted in a separate pane below the main price chart for clarity:
indicator("Crypto Volatility Index (VIX)", overlay=false, shorttitle="Crypto VIX")
2. Input Parameters
Users can adjust the period length for volatility calculations:
length = input.int(14, title="Period Length")
3. Calculating Daily Returns
The daily returns are calculated using logarithmic returns:
returns = math.log(close / close )
- **Logarithmic Returns:** These returns provide a normalized measure of price changes, making it easier to compare returns over different periods and across different assets.
4. Average Return Calculation
The average return over the specified period is computed with a Simple Moving Average (SMA):
avg_return = ta.sma(returns, length)
5. Variance Calculation
Variance measures the dispersion of returns from the average:
variance = ta.sma(math.pow(returns - avg_return, 2), length)
- Variance : This tells us how much the returns deviate from the average, giving insight into how volatile the market is.
6. Standard Deviation (Volatility) Calculation
Volatility is derived as the square root of the variance:
volatility = math.sqrt(variance)
- Standard Deviation : This provides a direct measure of volatility, showing how much the price typically deviates from the mean return.
7. Plotting the Indicator
The volatility and average return are plotted:
plot(volatility, color=#21f34b, title="Volatility Index")
plot(avg_return, color=color.new(color.red, 80), title="Average Return", style=plot.style_columns)
Practical Examples
1. High Volatility Scenario
** Example :** During significant market events, such as major regulatory announcements or geopolitical developments, the Crypto VIX tends to rise sharply. For instance, if the Crypto VIX moves from a baseline level of 0.2 to 0.8, it indicates heightened market volatility. Traders might see this as a signal to adjust their strategies, such as reducing position sizes or setting tighter stop-loss levels to manage increased risk.
2. Low Volatility Scenario
** Example :** In a stable market, where prices fluctuate within a narrow range, the Crypto VIX will show lower values. For example, a drop in the Crypto VIX from 0.4 to 0.2 suggests lower volatility and stable market conditions. Traders might use this information to consider longer-term trades or take advantage of potential consolidation patterns.
Best Practices
1. Combining Indicators
- Moving Averages : Use the Crypto VIX with moving averages to identify trends and potential reversal points.
- Relative Strength Index (RSI): Combine with RSI to assess overbought or oversold conditions for better entry and exit points.
- Bollinger Bands : Pair with Bollinger Bands to understand volatility relative to price movements and spot potential breakouts.
2. Adjusting Parameters
- Short-Term Trading : Use a shorter period length (e.g., 7 days) to capture rapid volatility changes suitable for day trading.
- Long-Term Investing : A longer period length (e.g., 30 days) provides a smoother view of volatility, helping long-term investors navigate market trends.
Backtesting and Performance Insights
While specific backtesting data for the Crypto VIX is not yet available, the indicator is built on established principles of volatility measurement, such as logarithmic returns and standard deviation. These methods are well-regarded in financial analysis for accurately reflecting market volatility. The Crypto VIX is designed to offer insights similar to other effective volatility indicators, tailored specifically for the cryptocurrency markets. Its adaptation to digital assets and ability to provide precise volatility measures underscore its practical value for traders.
Originality and Uniqueness
The Crypto Volatility Index (VIX) distinguishes itself through its specialized approach to measuring volatility in the cryptocurrency markets. While the concepts of logarithmic returns and standard deviation are not new, the Crypto VIX integrates these methods into a unique framework designed specifically for digital assets.
- Tailored Methodology : Unlike generic volatility indicators, the Crypto VIX is adapted to the unique characteristics of cryptocurrencies, providing a more precise measure of price fluctuations that reflects the inherent volatility of digital markets.
- Enhanced Insights : By focusing on cryptocurrency-specific price behavior and incorporating advanced statistical techniques, the Crypto VIX offers insights that traditional volatility indicators might miss. This makes it a valuable tool for traders navigating the complex and fast-moving cryptocurrency landscape.
- Innovative Application : The Crypto VIX combines established financial metrics in a novel way, offering a fresh perspective on market volatility and contributing to more effective risk management and trading strategies in the cryptocurrency space.
Summary
The Crypto Volatility Index (VIX) is a specialized tool for measuring cryptocurrency market volatility. By utilizing advanced statistical methods such as logarithmic returns and standard deviation, it provides a detailed measure of price fluctuations. While not entirely original in its use of these methods, the Crypto VIX stands out through its tailored application to the unique characteristics of the cryptocurrency market. Traders can use the Crypto VIX to gauge market risk, adjust their strategies, and make informed trading decisions, supported by practical examples, best practices, and clear visual aids.

DrawingLibrary "Drawing"
User Defined types and methods for basic drawing structure. Consolidated from the earlier libraries - DrawingTypes and DrawingMethods
method get_price(this, bar)
get line price based on bar
Namespace types: Line
Parameters:
this (Line) : (series Line) Line object.
bar (int) : (series/int) bar at which line price need to be calculated
Returns: line price at given bar.
method init(this)
Namespace types: PolyLine
Parameters:
this (PolyLine)
method tostring(this, sortKeys, sortOrder, includeKeys)
Converts DrawingTypes/Point object to string representation
Namespace types: chart.point
Parameters:
this (chart.point) : DrawingTypes/Point object
sortKeys (bool) : If set to true, string output is sorted by keys.
sortOrder (int) : Applicable only if sortKeys is set to true. Positive number will sort them in ascending order whreas negative numer will sort them in descending order. Passing 0 will not sort the keys
includeKeys (array) : Array of string containing selective keys. Optional parmaeter. If not provided, all the keys are considered
Returns: string representation of DrawingTypes/Point
method tostring(this, sortKeys, sortOrder, includeKeys)
Converts DrawingTypes/LineProperties object to string representation
Namespace types: LineProperties
Parameters:
this (LineProperties) : DrawingTypes/LineProperties object
sortKeys (bool) : If set to true, string output is sorted by keys.
sortOrder (int) : Applicable only if sortKeys is set to true. Positive number will sort them in ascending order whreas negative numer will sort them in descending order. Passing 0 will not sort the keys
includeKeys (array) : Array of string containing selective keys. Optional parmaeter. If not provided, all the keys are considered
Returns: string representation of DrawingTypes/LineProperties
method tostring(this, sortKeys, sortOrder, includeKeys)
Converts DrawingTypes/Line object to string representation
Namespace types: Line
Parameters:
this (Line) : DrawingTypes/Line object
sortKeys (bool) : If set to true, string output is sorted by keys.
sortOrder (int) : Applicable only if sortKeys is set to true. Positive number will sort them in ascending order whreas negative numer will sort them in descending order. Passing 0 will not sort the keys
includeKeys (array) : Array of string containing selective keys. Optional parmaeter. If not provided, all the keys are considered
Returns: string representation of DrawingTypes/Line
method tostring(this, sortKeys, sortOrder, includeKeys)
Converts DrawingTypes/LabelProperties object to string representation
Namespace types: LabelProperties
Parameters:
this (LabelProperties) : DrawingTypes/LabelProperties object
sortKeys (bool) : If set to true, string output is sorted by keys.
sortOrder (int) : Applicable only if sortKeys is set to true. Positive number will sort them in ascending order whreas negative numer will sort them in descending order. Passing 0 will not sort the keys
includeKeys (array) : Array of string containing selective keys. Optional parmaeter. If not provided, all the keys are considered
Returns: string representation of DrawingTypes/LabelProperties
method tostring(this, sortKeys, sortOrder, includeKeys)
Converts DrawingTypes/Label object to string representation
Namespace types: Label
Parameters:
this (Label) : DrawingTypes/Label object
sortKeys (bool) : If set to true, string output is sorted by keys.
sortOrder (int) : Applicable only if sortKeys is set to true. Positive number will sort them in ascending order whreas negative numer will sort them in descending order. Passing 0 will not sort the keys
includeKeys (array) : Array of string containing selective keys. Optional parmaeter. If not provided, all the keys are considered
Returns: string representation of DrawingTypes/Label
method tostring(this, sortKeys, sortOrder, includeKeys)
Converts DrawingTypes/Linefill object to string representation
Namespace types: Linefill
Parameters:
this (Linefill) : DrawingTypes/Linefill object
sortKeys (bool) : If set to true, string output is sorted by keys.
sortOrder (int) : Applicable only if sortKeys is set to true. Positive number will sort them in ascending order whreas negative numer will sort them in descending order. Passing 0 will not sort the keys
includeKeys (array) : Array of string containing selective keys. Optional parmaeter. If not provided, all the keys are considered
Returns: string representation of DrawingTypes/Linefill
method tostring(this, sortKeys, sortOrder, includeKeys)
Converts DrawingTypes/BoxProperties object to string representation
Namespace types: BoxProperties
Parameters:
this (BoxProperties) : DrawingTypes/BoxProperties object
sortKeys (bool) : If set to true, string output is sorted by keys.
sortOrder (int) : Applicable only if sortKeys is set to true. Positive number will sort them in ascending order whreas negative numer will sort them in descending order. Passing 0 will not sort the keys
includeKeys (array) : Array of string containing selective keys. Optional parmaeter. If not provided, all the keys are considered
Returns: string representation of DrawingTypes/BoxProperties
method tostring(this, sortKeys, sortOrder, includeKeys)
Converts DrawingTypes/BoxText object to string representation
Namespace types: BoxText
Parameters:
this (BoxText) : DrawingTypes/BoxText object
sortKeys (bool) : If set to true, string output is sorted by keys.
sortOrder (int) : Applicable only if sortKeys is set to true. Positive number will sort them in ascending order whreas negative numer will sort them in descending order. Passing 0 will not sort the keys
includeKeys (array) : Array of string containing selective keys. Optional parmaeter. If not provided, all the keys are considered
Returns: string representation of DrawingTypes/BoxText
method tostring(this, sortKeys, sortOrder, includeKeys)
Converts DrawingTypes/Box object to string representation
Namespace types: Box
Parameters:
this (Box) : DrawingTypes/Box object
sortKeys (bool) : If set to true, string output is sorted by keys.
sortOrder (int) : Applicable only if sortKeys is set to true. Positive number will sort them in ascending order whreas negative numer will sort them in descending order. Passing 0 will not sort the keys
includeKeys (array) : Array of string containing selective keys. Optional parmaeter. If not provided, all the keys are considered
Returns: string representation of DrawingTypes/Box
method delete(this)
Deletes line from DrawingTypes/Line object
Namespace types: Line
Parameters:
this (Line) : DrawingTypes/Line object
Returns: Line object deleted
method delete(this)
Deletes label from DrawingTypes/Label object
Namespace types: Label
Parameters:
this (Label) : DrawingTypes/Label object
Returns: Label object deleted
method delete(this)
Deletes Linefill from DrawingTypes/Linefill object
Namespace types: Linefill
Parameters:
this (Linefill) : DrawingTypes/Linefill object
Returns: Linefill object deleted
method delete(this)
Deletes box from DrawingTypes/Box object
Namespace types: Box
Parameters:
this (Box) : DrawingTypes/Box object
Returns: DrawingTypes/Box object deleted
method delete(this)
Deletes lines from array of DrawingTypes/Line objects
Namespace types: array
Parameters:
this (array) : Array of DrawingTypes/Line objects
Returns: Array of DrawingTypes/Line objects
method delete(this)
Deletes labels from array of DrawingTypes/Label objects
Namespace types: array
Parameters:
this (array) : Array of DrawingTypes/Label objects
Returns: Array of DrawingTypes/Label objects
method delete(this)
Deletes linefill from array of DrawingTypes/Linefill objects
Namespace types: array
Parameters:
this (array) : Array of DrawingTypes/Linefill objects
Returns: Array of DrawingTypes/Linefill objects
method delete(this)
Deletes boxes from array of DrawingTypes/Box objects
Namespace types: array
Parameters:
this (array) : Array of DrawingTypes/Box objects
Returns: Array of DrawingTypes/Box objects
method clear(this)
clear items from array of DrawingTypes/Line while deleting underlying objects
Namespace types: array
Parameters:
this (array) : array
Returns: void
method clear(this)
clear items from array of DrawingTypes/Label while deleting underlying objects
Namespace types: array
Parameters:
this (array) : array
Returns: void
method clear(this)
clear items from array of DrawingTypes/Linefill while deleting underlying objects
Namespace types: array
Parameters:
this (array) : array
Returns: void
method clear(this)
clear items from array of DrawingTypes/Box while deleting underlying objects
Namespace types: array
Parameters:
this (array) : array
Returns: void
method draw(this)
Creates line from DrawingTypes/Line object
Namespace types: Line
Parameters:
this (Line) : DrawingTypes/Line object
Returns: line created from DrawingTypes/Line object
method draw(this)
Creates lines from array of DrawingTypes/Line objects
Namespace types: array
Parameters:
this (array) : Array of DrawingTypes/Line objects
Returns: Array of DrawingTypes/Line objects
method draw(this)
Creates label from DrawingTypes/Label object
Namespace types: Label
Parameters:
this (Label) : DrawingTypes/Label object
Returns: label created from DrawingTypes/Label object
method draw(this)
Creates labels from array of DrawingTypes/Label objects
Namespace types: array
Parameters:
this (array) : Array of DrawingTypes/Label objects
Returns: Array of DrawingTypes/Label objects
method draw(this)
Creates linefill object from DrawingTypes/Linefill
Namespace types: Linefill
Parameters:
this (Linefill) : DrawingTypes/Linefill objects
Returns: linefill object created
method draw(this)
Creates linefill objects from array of DrawingTypes/Linefill objects
Namespace types: array
Parameters:
this (array) : Array of DrawingTypes/Linefill objects
Returns: Array of DrawingTypes/Linefill used for creating linefills
method draw(this)
Creates box from DrawingTypes/Box object
Namespace types: Box
Parameters:
this (Box) : DrawingTypes/Box object
Returns: box created from DrawingTypes/Box object
method draw(this)
Creates labels from array of DrawingTypes/Label objects
Namespace types: array
Parameters:
this (array) : Array of DrawingTypes/Label objects
Returns: Array of DrawingTypes/Label objects
method createLabel(this, lblText, tooltip, properties)
Creates DrawingTypes/Label object from DrawingTypes/Point
Namespace types: chart.point
Parameters:
this (chart.point) : DrawingTypes/Point object
lblText (string) : Label text
tooltip (string) : Tooltip text. Default is na
properties (LabelProperties) : DrawingTypes/LabelProperties object. Default is na - meaning default values are used.
Returns: DrawingTypes/Label object
method createLine(this, other, properties)
Creates DrawingTypes/Line object from one DrawingTypes/Point to other
Namespace types: chart.point
Parameters:
this (chart.point) : First DrawingTypes/Point object
other (chart.point) : Second DrawingTypes/Point object
properties (LineProperties) : DrawingTypes/LineProperties object. Default set to na - meaning default values are used.
Returns: DrawingTypes/Line object
method createLinefill(this, other, fillColor, transparency)
Creates DrawingTypes/Linefill object from DrawingTypes/Line object to other DrawingTypes/Line object
Namespace types: Line
Parameters:
this (Line) : First DrawingTypes/Line object
other (Line) : Other DrawingTypes/Line object
fillColor (color) : fill color of linefill. Default is color.blue
transparency (int) : fill transparency for linefill. Default is 80
Returns: Array of DrawingTypes/Linefill object
method createBox(this, other, properties, textProperties)
Creates DrawingTypes/Box object from one DrawingTypes/Point to other
Namespace types: chart.point
Parameters:
this (chart.point) : First DrawingTypes/Point object
other (chart.point) : Second DrawingTypes/Point object
properties (BoxProperties) : DrawingTypes/BoxProperties object. Default set to na - meaning default values are used.
textProperties (BoxText) : DrawingTypes/BoxText object. Default is na - meaning no text will be drawn
Returns: DrawingTypes/Box object
method createBox(this, properties, textProperties)
Creates DrawingTypes/Box object from DrawingTypes/Line as diagonal line
Namespace types: Line
Parameters:
this (Line) : Diagonal DrawingTypes/PoLineint object
properties (BoxProperties) : DrawingTypes/BoxProperties object. Default set to na - meaning default values are used.
textProperties (BoxText) : DrawingTypes/BoxText object. Default is na - meaning no text will be drawn
Returns: DrawingTypes/Box object
LineProperties
Properties of line object
Fields:
xloc (series string) : X Reference - can be either xloc.bar_index or xloc.bar_time. Default is xloc.bar_index
extend (series string) : Property which sets line to extend towards either right or left or both. Valid values are extend.right, extend.left, extend.both, extend.none. Default is extend.none
color (series color) : Line color
style (series string) : Line style, valid values are line.style_solid, line.style_dashed, line.style_dotted, line.style_arrow_left, line.style_arrow_right, line.style_arrow_both. Default is line.style_solid
width (series int) : Line width. Default is 1
Line
Line object created from points
Fields:
start (chart.point) : Starting point of the line
end (chart.point) : Ending point of the line
properties (LineProperties) : LineProperties object which defines the style of line
object (series line) : Derived line object
LabelProperties
Properties of label object
Fields:
xloc (series string) : X Reference - can be either xloc.bar_index or xloc.bar_time. Default is xloc.bar_index
yloc (series string) : Y reference - can be yloc.price, yloc.abovebar, yloc.belowbar. Default is yloc.price
color (series color) : Label fill color
style (series string) : Label style as defined in Tradingview Documentation. Default is label.style_none
textcolor (series color) : text color. Default is color.black
size (series string) : Label text size. Default is size.normal. Other values are size.auto, size.tiny, size.small, size.normal, size.large, size.huge
textalign (series string) : Label text alignment. Default if text.align_center. Other allowed values - text.align_right, text.align_left, text.align_top, text.align_bottom
text_font_family (series string) : The font family of the text. Default value is font.family_default. Other available option is font.family_monospace
Label
Label object
Fields:
point (chart.point) : Point where label is drawn
lblText (series string) : label text
tooltip (series string) : Tooltip text. Default is na
properties (LabelProperties) : LabelProperties object
object (series label) : Pine label object
Linefill
Linefill object
Fields:
line1 (Line) : First line to create linefill
line2 (Line) : Second line to create linefill
fillColor (series color) : Fill color
transparency (series int) : Fill transparency range from 0 to 100
object (series linefill) : linefill object created from wrapper
BoxProperties
BoxProperties object
Fields:
border_color (series color) : Box border color. Default is color.blue
bgcolor (series color) : box background color
border_width (series int) : Box border width. Default is 1
border_style (series string) : Box border style. Default is line.style_solid
extend (series string) : Extend property of box. default is extend.none
xloc (series string) : defines if drawing needs to be done based on bar index or time. default is xloc.bar_index
BoxText
Box Text properties.
Fields:
boxText (series string) : Text to be printed on the box
text_size (series string) : Text size. Default is size.auto
text_color (series color) : Box text color. Default is color.yellow.
text_halign (series string) : horizontal align style - default is text.align_center
text_valign (series string) : vertical align style - default is text.align_center
text_wrap (series string) : text wrap style - default is text.wrap_auto
text_font_family (series string) : Text font. Default is
Box
Box object
Fields:
p1 (chart.point) : Diagonal point one
p2 (chart.point) : Diagonal point two
properties (BoxProperties) : Box properties
textProperties (BoxText) : Box text properties
object (series box) : Box object created
PolyLineProperties
Fields:
curved (series bool)
closed (series bool)
xloc (series string)
lineColor (series color)
fillColor (series color)
lineStyle (series string)
lineWidth (series int)
PolyLine
Fields:
points (array)
properties (PolyLineProperties)
object (series polyline)
ADV_RSIADV_RSI - Advanced Relative Strength Index
Description: The ADV_RSI indicator is an advanced and mutated version of the classic Relative Strength Index (RSI), enhanced with multiple moving averages and a dynamic color-coding system. It provides traders with deeper insights into market momentum and potential trend reversals by incorporating two different moving averages of the RSI (21, and 50 periods). The indicator helps to visualize overbought and oversold conditions more effectively and offers a clear, color-coded representation of the RSI value relative to key thresholds.
Features:
RSI Calculation: The core of the indicator is based on the traditional RSI, calculated over a customizable period.
Multiple Moving Averages: The script includes two RSI moving averages (21, and 50 periods) to help identify trend strength and potential reversal points.
Dynamic RSI Color Coding: The RSI line is color-coded based on its value, ranging from red for overbought conditions to aqua for oversold conditions. This makes it easier to interpret the market's momentum at a glance.
Threshold Bands: The indicator includes horizontal threshold lines at key RSI levels (20, 30, 40, 50, 60, 70, 80), with shaded areas between them, providing a visual aid to quickly identify overbought and oversold zones.
How to Use:
The RSI line fluctuates between 0 and 100, with traditional overbought and oversold levels set at 70 and 30, respectively.
When the RSI crosses above the 70 level, it may indicate overbought conditions, signaling a potential selling opportunity.
When the RSI falls below the 30 level, it may indicate oversold conditions, signaling a potential buying opportunity.
The included moving averages of the RSI can help confirm trend direction and potential reversals.
The color coding of the RSI line provides a quick visual cue for momentum changes.
Ideal For:
Traders looking for a more nuanced understanding of market momentum.
Those who prefer visual aids for quick decision-making in identifying overbought and oversold conditions.
Traders who utilize multiple timeframes and need a comprehensive RSI tool for better accuracy in their analysis.

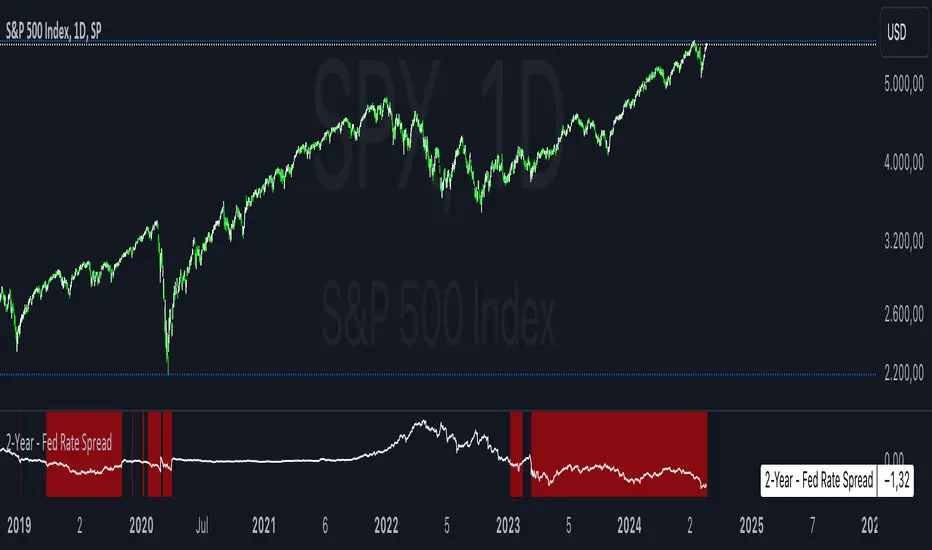
2-Year - Fed Rate SpreadThe “2-Year - Fed Rate Spread” is a financial indicator that measures the difference between the 2-Year Treasury Yield and the Federal Funds Rate (Fed Funds Rate). This spread is often used as a gauge of market sentiment regarding the future direction of interest rates and economic conditions.
Calculation
• 2-Year Treasury Yield: This is the return on investment, expressed as a percentage, on the U.S. government’s debt obligations that mature in two years.
• Federal Funds Rate: The interest rate at which depository institutions trade federal funds (balances held at Federal Reserve Banks) with each other overnight.
The indicator calculates the spread by subtracting the Fed Funds Rate from the 2-Year Treasury Yield:
{2-Year - Fed Rate Spread} = {2-Year Treasury Yield} - {Fed Funds Rate}
Interpretation:
• Positive Spread: A positive spread (2-Year Treasury Yield > Fed Funds Rate) typically suggests that the market expects the Fed to raise rates in the future, indicating confidence in economic growth.
• Negative Spread: A negative spread (2-Year Treasury Yield < Fed Funds Rate) can indicate market expectations of a rate cut, often signaling concerns about an economic slowdown or recession. When the spread turns negative, the indicator’s background turns red, making it visually easy to identify these periods.
How to Use:
• Trend Analysis: Investors and analysts can use this spread to assess the market’s expectations for future monetary policy. A persistent negative spread may suggest a cautious approach to equity investments, as it often precedes economic downturns.
• Confirmation Tool: The spread can be used alongside other economic indicators, such as the yield curve, to confirm signals about the direction of interest rates and economic activity.
Research and Academic References:
The 2-Year - Fed Rate Spread is part of a broader analysis of yield spreads and their implications for economic forecasting. Several academic studies have examined the predictive power of yield spreads, including those that involve the 2-Year Treasury Yield and Fed Funds Rate:
1. Estrella, Arturo, and Frederic S. Mishkin (1998). “Predicting U.S. Recessions: Financial Variables as Leading Indicators.” The Review of Economics and Statistics, 80(1): 45-61.
• This study explores the predictive power of various financial variables, including yield spreads, in forecasting U.S. recessions. The authors find that the yield spread is a robust leading indicator of economic downturns.
2. Estrella, Arturo, and Gikas A. Hardouvelis (1991). “The Term Structure as a Predictor of Real Economic Activity.” The Journal of Finance, 46(2): 555-576.
• The paper examines the relationship between the term structure of interest rates (including short-term spreads like the 2-Year - Fed Rate) and future economic activity. The study finds that yield spreads are significant predictors of future economic performance.
3. Rudebusch, Glenn D., and John C. Williams (2009). “Forecasting Recessions: The Puzzle of the Enduring Power of the Yield Curve.” Journal of Business & Economic Statistics, 27(4): 492-503.
• This research investigates why the yield curve, particularly spreads involving short-term rates like the 2-Year Treasury Yield, remains a powerful tool for forecasting recessions despite changes in monetary policy.
Conclusion:
The 2-Year - Fed Rate Spread is a valuable tool for market participants seeking to understand future interest rate movements and potential economic conditions. By monitoring the spread, especially when it turns negative, investors can gain insights into market sentiment and adjust their strategies accordingly. The academic research supports the use of such yield spreads as reliable indicators of future economic activity.
Normalized Willspread IndicatorNot sure to call it as willspread or not, because i take this idea from Larry William's original willspread indicator and did some modifications which found out to be more effective in my opinion, which is by subtracting 21 and 3 ma, this indicator is found on Trade_Stocks_and_Commodities_With_the_Insiders page155. Feel free to find out.
Here's what I modified, instead of using the subtraction between two ma, I use one ma only, I find more accurate in spotting oversold and overbought value. This indicator is useful for metals. It basically compares the value between two assets, let's say u are watching gold, u can select compare it to dxy, us30Y or gold, let's say u choose to compare to dxy, and the indicator shows the the index is overvalued which is above 80 levels, then it is suggesting that gold is overvalued, the same logic apply to undervalued as well which is 20 levels. This is not a entry or exit tool but as additional confluence, u can use any entry method u want like supply and demand and use this indicator to validate your idea, not sure whether it works on forex or not, so far i think it works well on metals.
The bar colour corresponding to the index when it is overbought or oversold. U can switch off it if you dont need it. Do note that this is a repainting indicator, so u must refer to previous week close.

Market Breadth - AsymmetrikMarket Breadth - Asymmetrik User Manual
Overview
The Market Breadth - Asymmetrik is a script designed to provide insights into the overall market condition by plotting three key indicators based on stocks within the S&P 500 index. It helps traders assess market momentum and strength through visual cues and is especially useful for understanding the proportion of stocks trading above their respective moving averages.
Features
1. Market Breadth Indicators:
- Breadth 20D (green line): Represents the percentage of stocks in the S&P 500 that are above their 20-day moving average.
- Breadth 50D (yellow line): Represents the percentage of stocks in the S&P 500 that are above their 50-day moving average.
- Breadth 100D (red line): Represents the percentage of stocks in the S&P 500 that are above their 100-day moving average.
2. Horizontal Lines for Context:
- Green line at 10%
- Lighter green line at 20%
- Grey line at 50%
- Light red line at 80%
- Dark red line at 90%
3. Background Color Alerts:
- Green background when all three indicators are under 20%, indicating a potential oversold market condition.
- Red background when all three indicators are over 80%, indicating a potential overbought market condition.
Interpreting the Indicator
- Market Breadth Lines: Observe the plotted lines to assess the percentage of stocks above their moving averages.
- Horizontal Lines: Use the horizontal lines to quickly identify important threshold levels.
- Background Colors: Pay attention to background colors for quick insights:
- Green: All indicators suggest a potentially oversold market condition (below 20).
- Red: All indicators suggest a potentially overbought market condition (above 80).
Troubleshooting
- If the indicator does not appear as expected, please contact me.
- This indicator works only on daily and weekly timeframes.
Conclusion
This Market Breadth Indicator offers a visual representation of market momentum and strength through three key indicators, helping you identify potential buying and selling zones.

Oscillator Scatterplot Analysis [Trendoscope®]In this indicator, we demonstrate how to plot oscillator behavior of oversold-overbought against price movements in the form of scatterplots and perform analysis. Scatterplots are drawn on a graph containing x and y-axis, where x represent one measure whereas y represents another. We use the library Graph to collect the data and plot it as scatterplot.
Pictorial explanation of components is defined in the chart below.
🎲 This indicator performs following tasks
Calculate and plot oscillator
Identify oversold and overbought areas based on various methods
Measure the price and bar movement from overbought to oversold and vice versa and plot them on the chart.
In our example,
The x-axis represents price movement. The plots found on the right side of the graph has positive price movements, whereas the plots found on the left side of the graph has negative price movements.
The y-axis represents the number of bars it took for reaching overbought to oversold and/or oversold to overbought. Positive bars mean we are measuring oversold to overbought, whereas negative bars are a measure of overbought to oversold.
🎲 Graph is divided into 4 equal quadrants
Quadrant 1 is the top right portion of the graph. Plots in this quadrant represent the instances where positive price movement is observed when the oscillator moved from oversold to overbought
Quadrant 2 is the top left portion of the graph. Plots in this quadrant represent the instances where negative price movement is observed when the oscillator moved from oversold to overbought.
Quadrant 3 is the bottom left portion of the chart. Plots in this quadrant represent the instances where negative price movement is observed when the oscillator moved from overbought to oversold.
Quadrant 4 is the bottom right portion of the chart. Plots in this quadrant represent the instances where positive price movement is observed when the oscillator moved from overbought to oversold.
🎲 Indicator components in Detail
Let's dive deep into the indicator.
🎯 Oscillator Selection
Select the Oscillator and define the overbought oversold conditions through input settings
Indicator - Oscillator base used for performing analysis
Length - Loopback length on which the oscillator is calculated
OB/OS Method - We use Bollinger Bands, Keltener Channel and Donchian channel to calculate dynamic overbought and oversold levels instead of static 80-10. This is also useful as other type of indicators may not be within 0-100 range.
Length and Multiplier are used for the bands for calculating Overbought/Oversold boundaries.
🎯 Define Graph Properties
Select different graph properties from the input settings that will instruct how to display the scatterplot.
Type - this can be either scatterplot or heatmap. Scatterplot will display plots with specific transparency to indicate the data, whereas heatmap will display background with different transparencies.
Plot Color - this is the color in which the scatterplot or heatmap is drawn
Plot Size - applicable mainly for scatterplot. Since the character we use for scatterplot is very tiny, the large at present looks optimal. But, based on the user's screen size, we may need to select different sizes so that it will render properly.
Rows and Columns - Number of rows and columns allocated per quadrant. This means, the total size of the chart is 2X rows and 2X columns. Data sets are divided into buckets based on the number of available rows and columns. Hence, changing this can change the appearance of the overall chart, even though they are representing the same data. Also, please note that tables can have max 10000 cells. If we increase the rows and columns by too much, we may get runtime errors.
Outliers - this is used to exclude the extreme data. 20% outlier means, the chart will ignore bottom 20% and top 20% when defining the chart boundaries. However, the extreme data is still added to the boundaries.

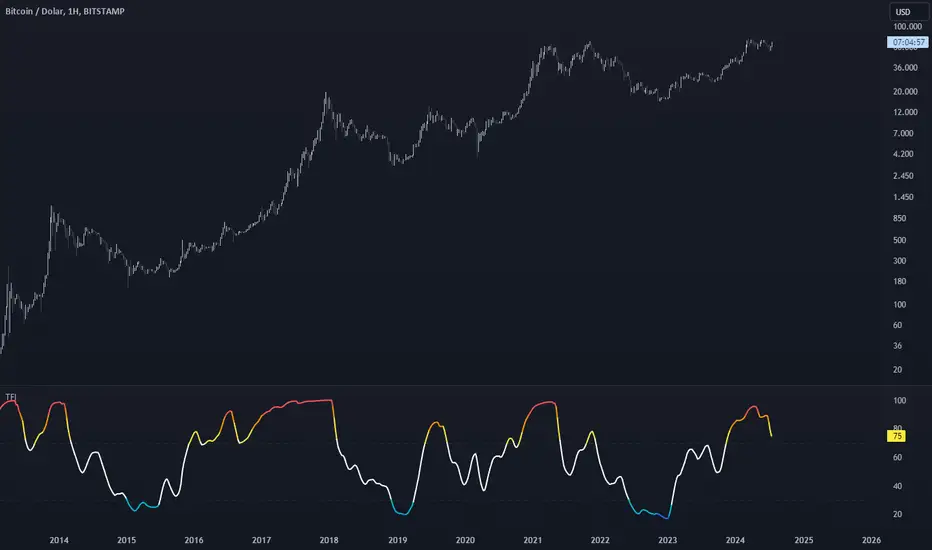
Trend Follower IndexDescription
The purpose of this index is to give an idea about the possible direction of the trend. The index is overbought between 70 and 100, and oversold between 30 and 0. Unlike a typical RSI calculation, the 6-bar simple moving average of the price is calculated first. Then, the 21-bar RSI value of this moving average is calculated.
Why
The 6-bar average is often one of the best averages to show the direction of prices. Closes below this average give strong indications of a trend reversal. To display this average on the horizontal plane, I used the RSI function and took 21 bar as the reference length. Because in my research, I realized that 21 bar length is the most ideal upper and lower points. That's why I coded an indicator that shows where a trend is going and how far that trend needs to go.
Use
It becomes oversold when the Moving Average falls below 30. Here we encounter 3 types of colors;
Light Blue: Indicates that the average is between 30 and 20. It indicates the stage when small purchases begin and the decline rate of the trend begins to decrease.
Blue: Indicates that the average is between 20 and 10. It indicates the stage when purchases begin to become more frequent and the rate of trend decline begins to decrease slightly.
Green: Indicates that the average has fallen below 10. It is the ideal level for purchasing. This indicates the stage when buying pressure has increased significantly and the trend is ready to reverse upward.
As the level decreases, purchases should increase.
Again, when the average value exceeds 70, it becomes overbought. Here we encounter three types of colors;
Yellow: Indicates that the average is between 70 and 80. It indicates the stage when small sales begin and the rate of increase in the trend begins to decrease.
Orange: Indicates that the average is between 80 and 90. It indicates the stage when sales begin to become more frequent and the upward trend begins to decrease somewhat.
Red: Indicates the average is above 90. It is an ideal level for sales. It now marks the stage where selling pressure has increased significantly and the trend is ready to turn downwards.
As the level increases, sales should increase.
Originality
First of all, this moving average is not an RSI. RSI is only used to establish the average on a flat basis. The RSI is merely a helpful tool in determining how much the moving average will rise or fall.
The 6-bar average of the value obtained by calculating Bar (Opening + Closing + High + Low) / 4 gives information about the main trend. In my research and usage, I have observed that as long as the price remains above this average, the price continues to move upwards, and when it remains below it, it is willing to move downwards.
Disclaimer
This indicator is for informational purposes only and should be used for educational purposes only. You may lose money if you rely on this to trade without additional information. Use at your own risk.
Version
v1.0
Brooks 18 Bars [KintsugiTrading]Brooks 18 Bars
Overview:
This indicator allows traders to specify a time frame within each trading day and plots lines at the highest and lowest prices recorded during that period. It is particularly useful for identifying key levels of support and resistance within a specified time range.
Features:
User-Defined Time Frame: Traders can input their desired start and end times in a 24-hour format, allowing flexibility to analyze different market sessions.
High and Low Price Levels: The indicator plots lines representing the highest and lowest prices observed within the specified time frame each day.
Clear Visual Representation: The high and low lines are color-coded for easy identification, with the high & low prices in Kintsugi Trading Gold.
How to Use:
Set the Time Frame:
Adjust the "Start Time Hour" and "Start Time Minute" to define the beginning of your desired time frame.
Adjust the "End Time Hour" and "End Time Minute" to define the end of your desired time frame.
Analyze Key Levels:
Al Brooks popularized the following idea and basis for creating this indicator:
On a 5-minute chart, Bar 1 has a 20-30% chance of being the High or Low of the day.
Bar 12 has a 50% chance.
Bar 18 has an 80-90% chance.
Use the plotted lines to identify significant support and resistance levels within your specified time frame. These levels can help inform your trading decisions, such as entry and exit points.
Good luck with your trading!

imbalances bandsThis indicator is designed to identify imbalances based on the calculation of the average of the highest and lowest prices. It forms a kind of band indicating correction points.
This indicator uses a total of 4 modified VWAPs, separated into 2 options that the user can activate or deactivate by checking or unchecking the options "Show imbalances bands VWAP 1" or "Show imbalances bands VWAP 2".
Let's talk about the first option, "Show imbalances bands VWAP 1". This displays 2 modified VWAPs on the screen, one in green and one in red, forming a kind of band that indicates possible points of imbalance in the market, signaling increased volatility between buying and selling. When the price tests the bands, it can be useful as there is a probability of a correction in the movement.
This can be particularly useful for those who trade using a scalping style, as it helps analyze when the price tests the bands. It can also be beneficial for trend traders because when the price tests one of the bands, there is a probability of a movement correction.
Now let's talk about the option "Show imbalances bands VWAP 2". It contains two modified VWAPs, one in purple and one in blue, which also form a kind of band. These bands also indicate the probability of a movement correction.
What is the difference between the Show imbalances bands VWAP 1 option and the Show imbalances bands VWAP 2 option?
The option "Show imbalances bands VWAP 2" consists of 2 modified volume-weighted moving averages that have a calculation checking the increase in volatility between the highest and lowest prices. One modified moving average is in purple, and the other modified moving average is in blue, forming a kind of two modified VWAPs.
The option "Show Imbalance Bands VWAP 1" consists of two modified moving averages using the absolute difference between the closing price and the moving average instead of the volume. This is particularly useful for assets where the volume is not a good indicator or is not available.
The option "Show Imbalance Bands VWAP 1" also has a calculation that checks for increased volatility between the highest and lowest prices. It features two modified moving averages, one in green and one in red.
This indicator can be adjusted according to the preferences and characteristics of the specific asset or market. It provides clear visual information and can be used as a complementary tool for technical analysis in trading strategies.
and Interesting period 5,20,50,80,200
Interesting imbalance setting 2.4, 3.3 ,4.2
Analysis Ideas: If you are following a trend, you can use this indicator to analyze how the price behaves around the bands. Since the imbalance bands indicate a probability of correction, it can be useful for identifying protection points or moments to be cautious, as there might be a probability of increased volatility.
Analysis Ideas2:For those trading using a scalping style, observe how the price behaves when it tests the imbalance band, as there may be a probability of increased volatility.
Please note that this indicator is designed for educational and informational purposes. Always conduct your own analysis and consider risk management strategies before making trading decisions.

Keltner Channel+EMA with Buy/Sell SignalsIndicator Name: Double Keltner Channel with EMA (Buy/Sell Signals)
Description:
This indicator is designed to help traders identify potential trend reversals and generate buy/sell signals in volatile markets. It combines two Keltner Channels with different sensitivities (multipliers of 2.6 and 3.8) to visualize dynamic support and resistance levels. The addition of a 20-period EMA helps confirm trend direction and filter out potential false signals.
How the Indicator Works:
• Keltner Channels: These bands dynamically adjust to changing market volatility, offering a visual representation of potential price ranges. The 2.6 multiplier Keltner Channel (KC) is more sensitive to price changes, potentially highlighting short-term reversals, while the 3.8 multiplier KC focuses on broader trend shifts.
• 20-period EMA: This widely used trend indicator helps smooth out price fluctuations and identify the underlying direction of the market.
• Buy Signals: Generated when a candle's low touches or crosses below either Keltner Channel's lower band, and within the next 6 candles, that same candle closes above the 20 EMA. This combination suggests a potential rejection of lower prices (support) and a possible resumption of the uptrend.
• Sell Signals: Mirror the buy signal logic but are triggered when the candle's high touches or crosses above either Keltner Channel's upper band and then closes below the 20 EMA within the next 6 candles. This indicates a potential rejection of higher prices (resistance) and a possible shift to a downtrend.
How to Use the Indicator:
1. Identify the Trend: Use the 20 EMA to determine the overall trend direction. Look for buy signals primarily in uptrends and sell signals in downtrends.
2. Confirm with RSI : While not included in this indicator, consider using a separate Relative Strength Index (RSI) with a length of 10, SMA type, MA length of 14, and standard deviation of 2. Look for oversold conditions (RSI below 20) to confirm buy signals and overbought conditions (RSI above 80) to confirm sell signals.
3.Apply Risk Management: Always use appropriate risk management techniques, such as stop-loss orders, to protect your capital.
Key Points:
• This indicator is most effective in trending markets.
• It is not a standalone trading system and should be used in conjunction with other analysis tools and confirmation.
• The Keltner Channel multiplier values can be adjusted to suit your trading style and risk tolerance.
Important Disclaimer:
This indicator is a modification of the original Keltner Channel code and is intended for educational and informational purposes only.
It does not constitute financial advice. Always conduct your own research and consult with a qualified financial advisor before making any investment decisions.

COT IndexReference:
Trade Stocks and Commodities with the Insiders
Secrets of the COT Report by Larry Williams pg34
The equation is as below:
Current week's value- Lowest value of last three years
---------------------------------------------------------------------------- X 100%
Highest high of last three years-Lowest low of last three years
According to Larry Williams, traders should follow commercials direction. When the commercial index line (yellow line) is above 80, this indicates commercials are bullish. Hence, traders can look for potential buy setup. Conversely, when commercials index line (yellow line) is below 20, this indicates commercials are bearish, we can look for sell setup.
Do note that this is only applicable on Weekly chart as COT reports come out on weekly basis.
Modification from the original COT index from Larry Williams:
1) I've added 1year and 6months period, so traders maybe can look for pullback using shorter period. By default, Larry Williams uses 3 years Commercial index.
2) I've added non-commercials and retail traders index, they basically trade opposite way of commercials.
This indicator should not be used as a timing tool or entry tool, you can use it as your weekly or monthly bias tool. For more information, please read the books. Feel free to modify the code, if u have a better version of this, you may share to me if you want, I will be very grateful!

Hindsight TrendNon-realtime but highly accurate trend analyzer with only one fundamental parameter ( period aka "minimum trend length")
Basically Hindsight Trend is pivot points on steroids (handles many cases much better). Plus it shows the trend line.
Period
I usually like periods of 10, 20 or 30.
The indicator's delay is identical to the chosen period.
You can actually try a low period like 4 or 5 to get something resembling a realtime indicator.
Uptrends are based on candle lows, downtrends are based on candle highs. So it is possible to have an uptrend and a downtrend at the same time.
Triangles
At trend start, a triangle is drawn. (Trendline isn't always there if the trend didn't last that long.)
Triangle size shows how long the high or low that started the trend remained unbroken. E.g. with period 20: Small triangle = 20+ candles, medium triangle = 40+ candles, big triangle = 80+ candles. So a big triangle marks an important reversal point.
How Hindsight Trend works
Whenever a candle completes, its high and low are saved as potentially "notable" points. A high or low is the more notable the longer it stays unbroken (= not touched again by price).
Now we simply take the notable highs and lows (as in, staying unbroken at least for the user-selected period)... and connect them together - if they are close enough to each other (less than "period" candles away). And decorate the first point in each trend with a triangle.
We only know whether a point is notable after "period" more candles have printed, so that's where the indicator's delay comes from.
Finally we divide the period by 2 and look at highs and lows which are unbroken for that shorter time. While they are not fully "notable" as defined above, we'll call them "semi-notable". Those points are only considered at the end of a trend, and help us extend the trend line a bit further.

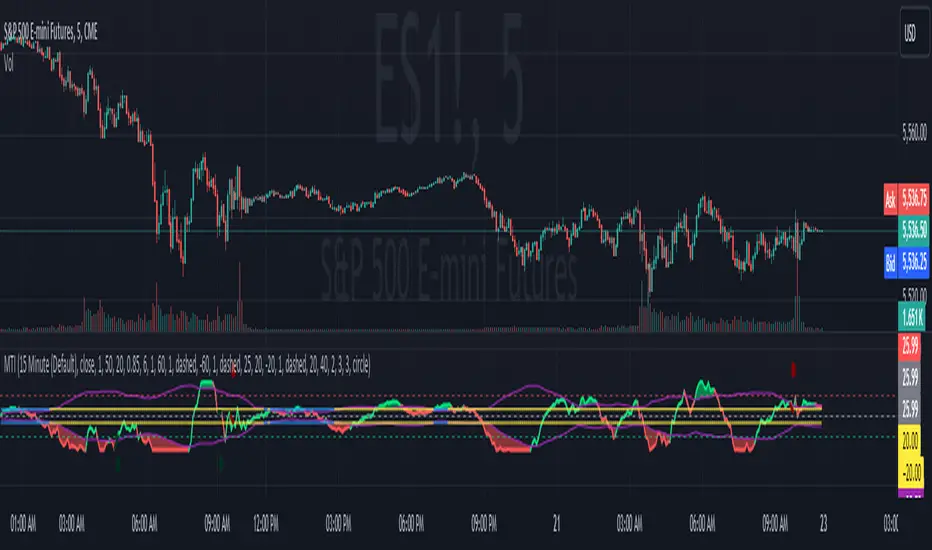
Modern Trend IdentifierThis is an update by Lightangel112 to Trendilo (Open-Source).
Thanks @ Lightangel112
The Modern Trend Identifier (MTI) is a sophisticated technical analysis tool designed for traders and analysts seeking to accurately determine market trends. This indicator leverages the Arnaud Legoux Moving Average (ALMA) to smooth price data and calculate percentage changes, providing a clearer and more responsive trend analysis. MTI is engineered to highlight trend direction with visual cues, fill areas between the indicator and its bands, and color bars based on trend direction, making it a powerful tool for identifying market momentum and potential reversals.
Capabilities
Smoothing and Trend Calculation:
Utilizes ALMA to smooth price data, reducing noise and providing a clearer view of the trend.
Calculates percentage changes in price over a user-defined lookback period.
Dynamic Range Adjustment:
Normalizes the ALMA percentage change values to ensure they stay within a -100 to 100 range.
Uses a combination of linear and smoothstep compression to handle extreme values without losing sensitivity.
Trend Direction and Highlighting:
Determines the trend direction based on the relationship between the smoothed ALMA percentage change and dynamically adjusted RMS (Root Mean Square) bands.
Colors the trend line to visually indicate whether the market is in an uptrend, downtrend, or neutral state.
Dynamic Threshold Calculation:
Calculates dynamic thresholds using percentile ranks to adapt to changing market conditions.
Visualization Enhancements:
Fills areas between the ALMA percentage change line and its RMS bands to provide a clear visual indication of the trend strength.
Offers the option to color price bars based on the identified trend direction.
Customizable Settings:
Provides extensive customization options for lookback periods, smoothing parameters, ALMA settings, band multipliers, and more.
Allows users to enable or disable various visual enhancements and customize their appearance.
Use Cases
Trend Identification:
MTI helps traders identify the current market trend, whether it's bullish, bearish, or neutral. This can be particularly useful for trend-following strategies.
Momentum Analysis:
By highlighting areas of strong momentum, MTI enables traders to spot potential breakouts or breakdowns. This can be useful for both entry and exit decisions.
Support and Resistance Levels:
The dynamic threshold bands can act as support and resistance levels. Traders can use these levels to set stop-loss and take-profit orders.
Divergence Detection:
MTI can help in identifying divergences between price and the indicator, which can signal potential trend reversals. This is useful for traders looking to capitalize on trend changes.
Risk Management:
The fill areas and colored bars provide clear visual cues about trend strength and direction, aiding in better risk management. Traders can adjust their positions based on the strength of the trend.
Backtesting:
The extensive customization options allow traders to backtest different settings and parameters to optimize their trading strategies for various market conditions.
Multiple Timeframes:
MTI can be applied to multiple timeframes, from intraday charts to daily, weekly, or monthly charts, making it a versatile tool for traders with different trading styles.
Example Scenarios
Day Trading:
A day trader can use MTI on a 5-minute chart to identify intraday trends. By adjusting the lookback period and smoothing parameters, the trader can quickly spot potential entry and exit points based on short-term momentum changes.
Swing Trading:
A swing trader might apply MTI to a 4-hour chart to identify medium-term trends. The dynamic thresholds can help in setting appropriate stop-loss levels, while the trend direction highlighting aids in making informed decisions about holding or exiting positions.
Position Trading:
For a position trader using a daily chart, MTI can help identify the overarching trend. The trader can use the fill areas and bar coloring to assess the strength of the trend and make decisions about entering or exiting long-term positions.
Market Analysis:
An analyst could use MTI to study historical price movements and identify patterns. By examining how the indicator reacted to past market conditions, the analyst can gain insights into potential future price movements.
In summary, the Modern Trend Identifier (MTI) is a versatile and powerful tool that enhances trend analysis with advanced smoothing techniques, dynamic adjustments, and comprehensive visual cues. It is designed to meet the needs of traders and analysts across various trading styles and timeframes, providing clear and actionable insights into market trends and momentum.
Updated with the following:
Additions and Enhancements in MTI
Grouped Inputs with Descriptive Tooltips:
Inputs are organized into groups for better clarity.
Each input parameter includes a descriptive tooltip.
Dynamic Threshold Calculation:
Added dynamic threshold calculation using percentile ranks to adapt to changing market conditions.
Normalization and Compression:
Added normalization factor to ensure plots are within -100 to 100 range.
Introduced smoothstep function for smooth transition and selectively applied linear and smoothstep compression to values outside -80 to 100 range.
Enhanced Visualization:
Highlighted trend direction with RGB colors.
Enhanced fill areas between the ALMA percentage change line and its RMS bands.
Colored price bars based on the identified trend direction.
RMS Lines Adjustment:
Dynamically adjusted RMS calculation without strict capping.
Ensured RMS lines stay below fill areas to maintain clarity.
Descriptive and Organized Code:
Enhanced code clarity with detailed comments.
Organized code into logical sections for better readability and maintenance.
Key Differences and Improvements.
Input Customization:
Trendilo: Inputs are simple and ungrouped.
MTI: Inputs are grouped and include tooltips for better user guidance.
Trend Calculation:
Trendilo: Uses ALMA and calculates percentage change.
MTI: Enhanced with normalization, compression, and dynamic threshold calculation.
Normalization and Compression:
Trendilo: No normalization or compression applied.
MTI: Normalizes values to -100 to 100 range and applies smoothstep compression to handle extreme values.
Dynamic RMS Adjustment:
Trendilo: Simple RMS calculation.
MTI: Dynamically adjusted RMS calculation to ensure clarity in visualization.
Visual Enhancements:
Trendilo: Basic trend highlighting and filling.
MTI: Enhanced visual cues with RGB colors, dynamic threshold bands, and improved fill areas.
Code Clarity:
Trendilo: Functional but lacks detailed comments and organization.
MTI: Well-organized, extensively commented code for better readability and maintainability.
Stoch Double Analysis MTFThis indicator utilizes the Stochastic Oscillator on two different timeframes and generates alerts for potential long and short conditions based on the crossovers of the %K and %D lines of the Stochastic Oscillator. Here's a detailed breakdown of the code:
Inputs
Overbought and Oversold Levels:
ob_stc: Overbought level (default 80).
os_stc: Oversold level (default 20).
Timeframe 1 Configuration:
tf_stoch_1: The first timeframe for analysis.
length: Stochastic length (default 8).
smoothK: Smoothing for %K line (default 5).
smoothD: Smoothing for %D line (default 3).
Timeframe 2 Configuration:
tf_stoch_2: The second timeframe for analysis.
length_another: Stochastic length for the second timeframe (default 12).
smoothK_another: Smoothing for %K line for the second timeframe (default 7).
smoothD_another: Smoothing for %D line for the second timeframe (default 3).
Calculations
Volume Trend Calculation:
For both timeframes, the script calculates the volume trend. It determines up days and down days based on whether the closing price is higher or lower than the opening price and accumulates the volume accordingly.
Cumulative Volume:
Calculates the cumulative volume for up days and down days using the average of the high prices and the respective volumes.
Stochastic Oscillator Calculation:
Computes the %K and %D lines of the Stochastic Oscillator for both timeframes using the given lengths and smoothing factors.
Alerts
The script generates alerts for potential long and short conditions based on the crossovers of the %K and %D lines for both timeframes:
Long Condition: When %K crosses above %D.
Short Condition: When %D crosses above %K.
Plotting
Stochastic Lines:
Plots the %K and %D lines for both timeframes with different colors (orange and blue for the first timeframe, green and red for the second timeframe).
Overbought/Oversold Bands:
Adds horizontal lines at the overbought and oversold levels and a middle band at 50.
Fills the background between the overbought and oversold levels with a semi-transparent color.
Code Structure
Inputs Definition:
Defines all input variables for customization.
Volume Trend and Cumulative Volume Calculation:
Computes volume trends and cumulative volumes for both timeframes.
Stochastic Oscillator Calculation:
Calculates the %K and %D lines using the request.security function to get data from the specified timeframes and apply the smoothing functions.
Alert Conditions:
Checks for crossovers between the %K and %D lines to generate alerts for potential trading signals.
Plotting:
Plots the %K and %D lines for both timeframes and adds visual elements for overbought and oversold levels.
This indicator helps traders analyze market trends using the Stochastic Oscillator on multiple timeframes, providing potential buy and sell signals based on the interaction of the %K and %D lines.
The alerts generated by the "Stoch Double Analysis MTF" indicator can be viewed as part of a broader educational and training path for traders!
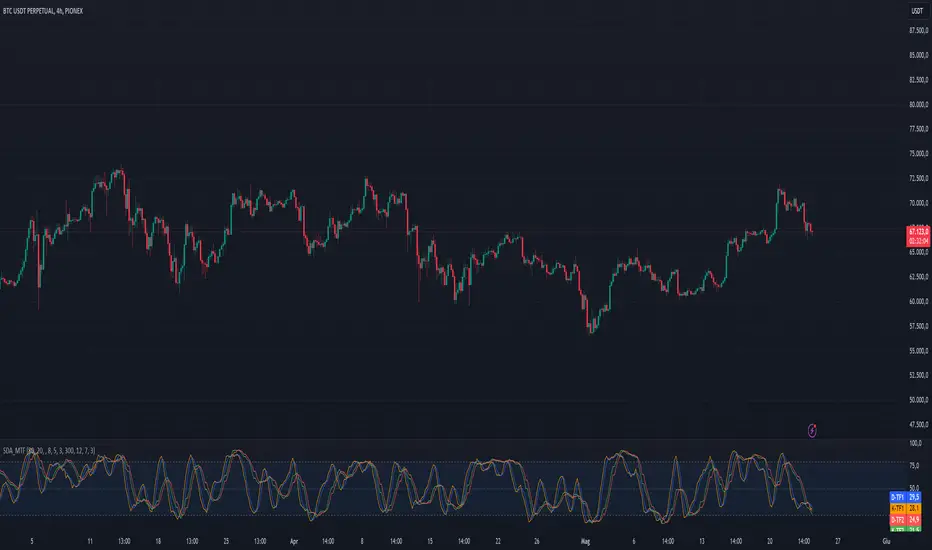
Stocastic Reference Dinoa technical analysis indicator named "Stocastic Reference Dino," which is a stochastic oscillator used to analyze market trends and potential price reversals.
Key Features:
Inputs:
K Period (lengthK): Defines the period for the %K line calculation (default 13).
D Period (lengthD): Defines the period for the %D line calculation (default 9).
Smoothing Period (smoothK): Smoothing period for the %K line (default 8).
Low Threshold (lowThreshold): Lower bound threshold for the oscillator (default 10).
High Threshold (highThreshold): Upper bound threshold for the oscillator (default 80).
%K Line Calculation:
Calculates the lowest low and highest high over the lengthK period.
Computes the %K value and smooths it using a simple moving average over smoothK periods.
%D Line Calculation:
Calculates the %D line as a simple moving average of the %K line over the lengthD period.
Plotting:
Plots the %K line in blue and the %D line in red on a new pane.
Adds horizontal lines to represent the low and high thresholds, colored green and red, respectively.
This indicator helps traders identify potential overbought and oversold conditions by analyzing the stochastic oscillator lines (%K and %D) relative to the defined thresholds.

Stochastic Z-Score Oscillator Strategy [TradeDots]The "Stochastic Z-Score Oscillator Strategy" represents an enhanced approach to the original "Buy Sell Strategy With Z-Score" trading strategy. Our upgraded Stochastic model incorporates an additional Stochastic Oscillator layer on top of the Z-Score statistical metrics, which bolsters the affirmation of potential price reversals.
We also revised our exit strategy to when the Z-Score revert to a level of zero. This amendment gives a much smaller drawdown, resulting in a better win-rate compared to the original version.
HOW DOES IT WORK
The strategy operates by calculating the Z-Score of the closing price for each candlestick. This allows us to evaluate how significantly the current price deviates from its typical volatility level.
The strategy first takes the scope of a rolling window, adjusted to the user's preference. This window is used to compute both the standard deviation and mean value. With these values, the strategic model finalizes the Z-Score. This determination is accomplished by subtracting the mean from the closing price and dividing the resulting value by the standard deviation.
Following this, the Stochastic Oscillator is utilized to affirm the Z-Score overbought and oversold indicators. This indicator operates within a 0 to 100 range, so a base adjustment to match the Z-Score scale is required. Post Stochastic Oscillator calculation, we recalibrate the figure to lie within the -4 to 4 range.
Finally, we compute the average of both the Stochastic Oscillator and Z-Score, signaling overpriced or underpriced conditions when the set threshold of positive or negative is breached.
APPLICATION
Firstly, it is better to identify a stable trading pair for this technique, such as two stocks with considerable correlation. This is to ensure conformance with the statistical model's assumption of a normal Gaussian distribution model. The ideal performance is theoretically situated within a sideways market devoid of skewness.
Following pair selection, the user should refine the span of the rolling window. A broader window smoothens the mean, more accurately capturing long-term market trends, while potentially enhancing volatility. This refinement results in fewer, yet precise trading signals.
Finally, the user must settle on an optimal Z-Score threshold, which essentially dictates the timing for buy/sell actions when the Z-Score exceeds with thresholds. A positive threshold signifies the price veering away from its mean, triggering a sell signal. Conversely, a negative threshold denotes the price falling below its mean, illustrating an underpriced condition that prompts a buy signal.
Within a normal distribution, a Z-Score of 1 records about 68% of occurrences centered at the mean, while a Z-Score of 2 captures approximately 95% of occurrences.
The 'cool down period' is essentially the number of bars that await before the next signal generation. This feature is employed to dodge the occurrence of multiple signals in a short period.
DEFAULT SETUP
The following is the default setup on EURAUD 1h timeframe
Rolling Window: 80
Z-Score Threshold: 2.8
Signal Cool Down Period: 5
Stochastic Length: 14
Stochastic Smooth Period: 7
Commission: 0.01%
Initial Capital: $10,000
Equity per Trade: 40%
FURTHER IMPLICATION
The Stochastic Oscillator imparts minimal impact on the current strategy. As such, it may be beneficial to adjust the weightings between the Z-Score and Stochastic Oscillator values or the scale of Stochastic Oscillator to test different performance outcomes.
Alternative momentum indicators such as Keltner Channels or RSI could also serve as robust confirmations of overbought and oversold signals when used for verification.
RISK DISCLAIMER
Trading entails substantial risk, and most day traders incur losses. All content, tools, scripts, articles, and education provided by TradeDots serve purely informational and educational purposes. Past performances are not definitive predictors of future results.
