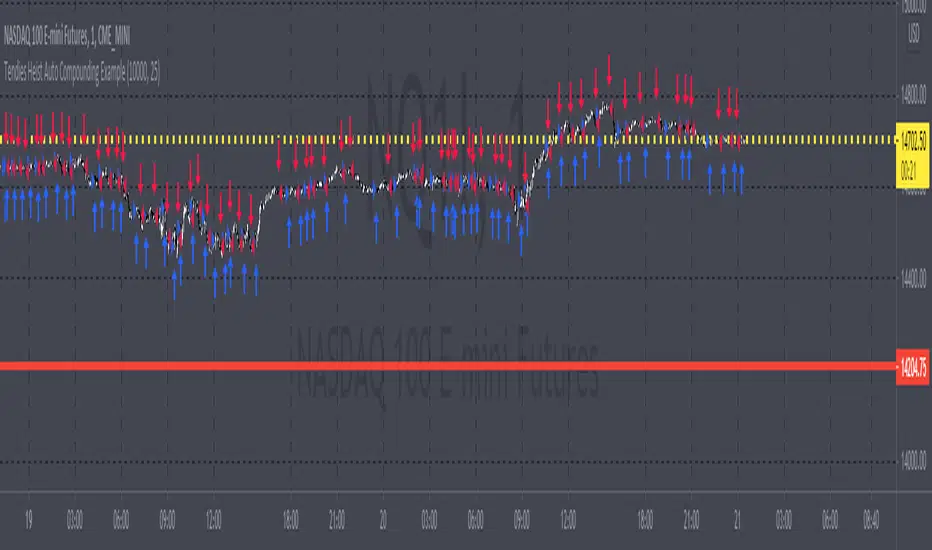
Tendies Heist Auto Compounding ExampleThis is an example of how we can use compounding to control our position size. This example shows how we can automatically add and reduce position size based on account equity. The "initial capital" in properties is the starting account equity. At default its set to 100,000. If our max position size is set to 25 then the very first position that's taken has a position size of 10, IF our leverage is set to 10,000. Account equity divided by leverage equals position size. So in that example 100,000 divided by 10,000 in leverage gives us a max position size of 10. However the max position size was set to 25 meaning we would need 250k in equity for it to open a position size of 25 with the leverage set at 10k. Now if the initial capital was set to 100,000 and the max position size was set to 5 and leverage remained at 10,000, all though 100,000 divided by 10,000 equals 10 it will ONLY open a position size of 5, because the max position size in this example was set at 5. Since this works for strategies you may look through the trade log on the posted back test and check out the position size, you can see in this back test the default 100k is used for the initial capital and the default 10k was used for the leverage. You will be able to see as this logic loses money it takes contracts away and as it gains money it adds contracts. I'm using trading view's basic strategy logic example to provide an example of how the compounding logic works.
Note, don't forget to add the syntax below to your strategy.entry call for this logic to work.
qty = size
Tendies Heist LLC 2021
Cerca negli script per "腾讯10大股东"
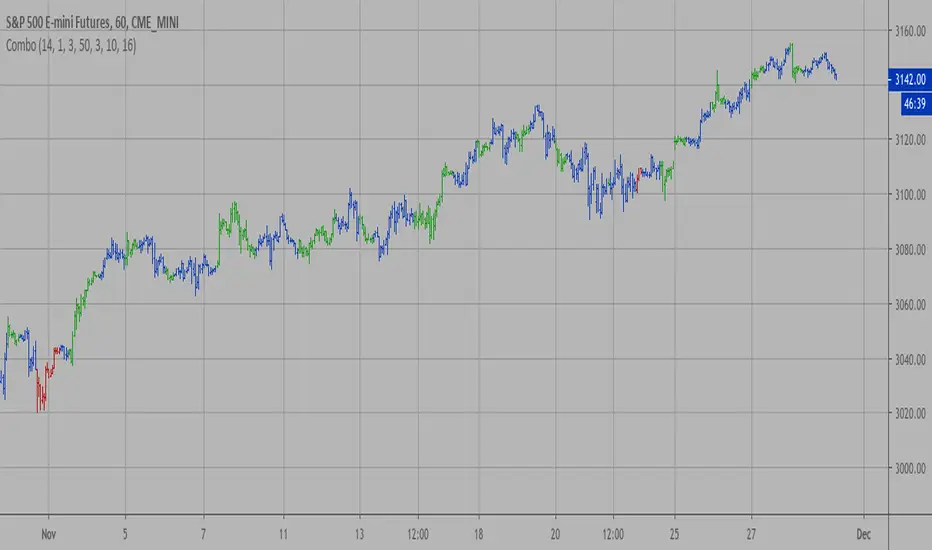
Combo Backtest 123 Reversal & D_Three Ten OscThis is combo strategies for get a cumulative signal.
First strategy
This System was created from the Book "How I Tripled My Money In The
Futures Market" by Ulf Jensen, Page 183. This is reverse type of strategies.
The strategy buys at market, if close price is higher than the previous close
during 2 days and the meaning of 9-days Stochastic Slow Oscillator is lower than 50.
The strategy sells at market, if close price is lower than the previous close price
during 2 days and the meaning of 9-days Stochastic Fast Oscillator is higher than 50.
Second strategy
TradeStation does not allow the user to make a Multi Data Chart with
a Tick Bar Chart and any other type a chart. This indicator allows the
user to plot a daily 3-10 Oscillator on a Tick Bar Chart or any intraday interval.
Walter Bressert's 3-10 Oscillator is a detrending oscillator derived
from subtracting a 10 day moving average from a 3 day moving average.
The second plot is an 16 day simple moving average of the 3-10 Oscillator.
The 16 period moving average is the slow line and the 3/10 oscillator is
the fast line.
For more information on the 3-10 Oscillator see Walter Bressert's book
"The Power of Oscillator/Cycle Combinations"
WARNING:
- For purpose educate only
- This script to change bars colors.

Combo Backtest 123 Reversal & D_Three Ten Osc This is combo strategies for get a cumulative signal.
First strategy
This System was created from the Book "How I Tripled My Money In The
Futures Market" by Ulf Jensen, Page 183. This is reverse type of strategies.
The strategy buys at market, if close price is higher than the previous close
during 2 days and the meaning of 9-days Stochastic Slow Oscillator is lower than 50.
The strategy sells at market, if close price is lower than the previous close price
during 2 days and the meaning of 9-days Stochastic Fast Oscillator is higher than 50.
Second strategy
TradeStation does not allow the user to make a Multi Data Chart with
a Tick Bar Chart and any other type a chart. This indicator allows the
user to plot a daily 3-10 Oscillator on a Tick Bar Chart or any intraday interval.
Walter Bressert's 3-10 Oscillator is a detrending oscillator derived
from subtracting a 10 day moving average from a 3 day moving average.
The second plot is an 16 day simple moving average of the 3-10 Oscillator.
The 16 period moving average is the slow line and the 3/10 oscillator is
the fast line.
For more information on the 3-10 Oscillator see Walter Bressert's book
"The Power of Oscillator/Cycle Combinations"
WARNING:
- For purpose educate only
- This script to change bars colors.
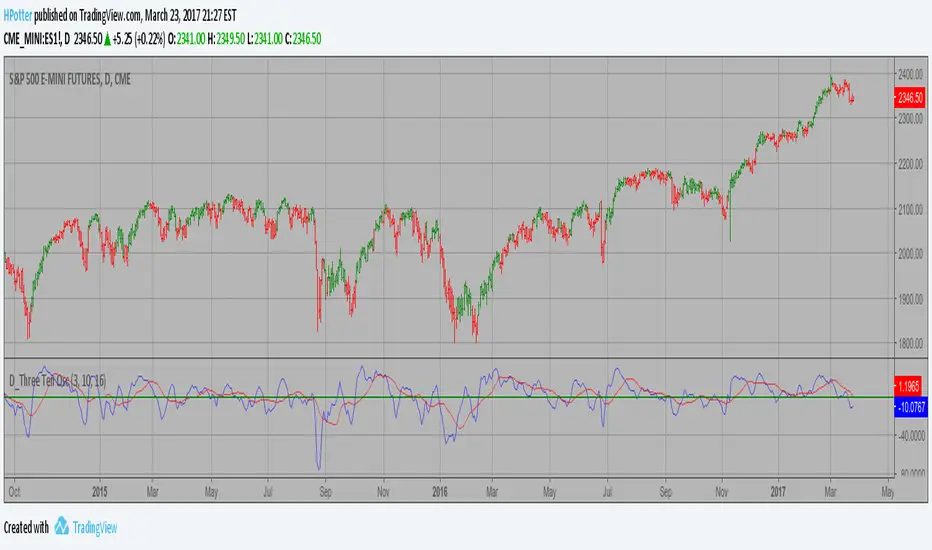
D_Three Ten Osc Strategy Backtest This indicator allows the user to plot a daily 3-10 Oscillator on a Tick Bar Chart or any intraday interval.
Walter Bressert's 3-10 Oscillator is a detrending oscillator derived
from subtracting a 10 day moving average from a 3 day moving average.
The second plot is an 16 day simple moving average of the 3-10 Oscillator.
The 16 period moving average is the slow line and the 3/10 oscillator is
the fast line.
For more information on the 3-10 Oscillator see Walter Bressert's book
"The Power of Oscillator/Cycle Combinations"
You can change long to short in the Input Settings
Please, use it only for learning or paper trading. Do not for real trading.

D_Three Ten Osc Strategy This indicator allows the user to plot a daily 3-10 Oscillator on a Tick Bar
Chart or any intraday interval.
Walter Bressert's 3-10 Oscillator is a detrending oscillator derived
from subtracting a 10 day moving average from a 3 day moving average.
The second plot is an 16 day simple moving average of the 3-10 Oscillator.
The 16 period moving average is the slow line and the 3/10 oscillator is
the fast line.
For more information on the 3-10 Oscillator see Walter Bressert's book
"The Power of Oscillator/Cycle Combinations"
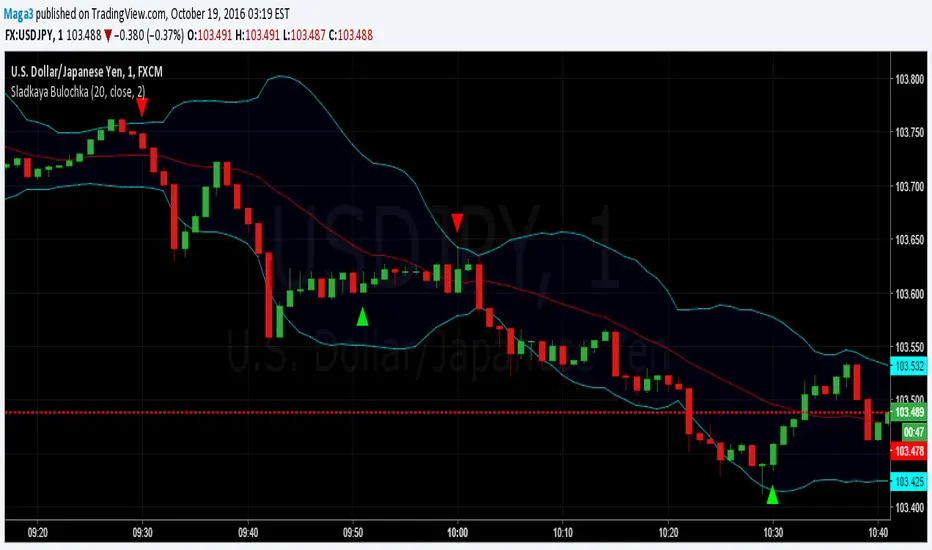
Sladkaya BulochkaAccording to the statistics of Thomas Bulkovski collected over several years on the 1-minute chart (21 million candles), there is a statistically significant periods, where the higher the probability of reversal rates on short-term timeframe.
By reversal, on average, had in mind the movement to 5 candles.
This three periods, they remain unchanged, depending on the hour:
- the first minute of each hour (10:01, 11:01, etc.)
- the first minute after the hour (10:31, 11:31)
- 51 minutes each hour (10:51, 11:51)
------------------------------------------------------
По статистике Томаса Булковски, собранной за несколько лет на 1-минутном графике (21 миллион свечей), есть статистически значимые периоды, где более высока вероятность разворота цены на краткосрочных ТФ.
Под разворотом, в среднем, имелось в виду движение на 5 свечей.
Это три периода, они неизменны в зависимости от часа:
- первая минута каждого часа (10:01, 11:01 и т.д.)
- первая минута после получаса (10:31, 11:31)
- каждая 51 минута часа (10:51, 11:51)
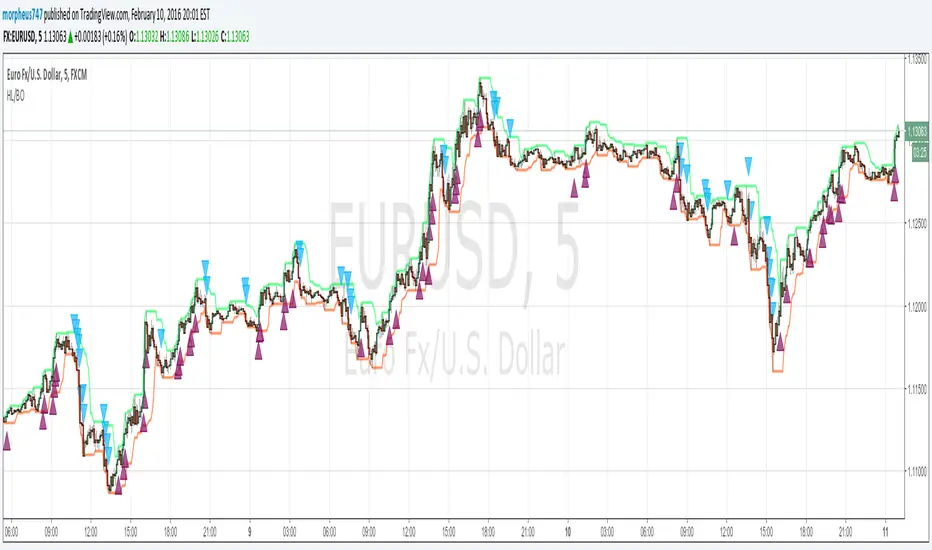
HL BREAKOUTThe base of the indicator is the breakout of historic High and lows.
There are 3 basic configurations
1° The High length that measure the latest 10 bars and make the "higher high"
2° The Low length taht measure the latest 10 bars and make the "lower low"
3° The Breakout PIPs administrator that defines how much pips are needed from the latest higher high to be defined as a level breakout.
So the strategy is super easy. The indicators show you the 10...20.. or whatever you need old bars high and lows.
When a breakout of that levels occurs and the candle "close" above or below and the close are more than "X" amount of PIPs a marker show up. The marker are the signals of buy and sell
I test some configurations, and work in all timeframes but.
I suggest
10, 10, 0.0003 for timeframes from 1m to 15m
and 10, 10, 0.0005 for timeframes higher than 15m
Maybe you need to test other configurations for 4h 1 day, etc the basics are the same in all timeframes, the main difference is the amount of pips that will be considered as "breakout" the higher timeframe the higher amount you need to prevent false positives.
Last words: 0.000X are for the PIPs for currencies that have 4 or 5 decimals like euro and other, if you use in YEN change it to a configuration of 2 digits decimal. Just that.
Have "fun" !
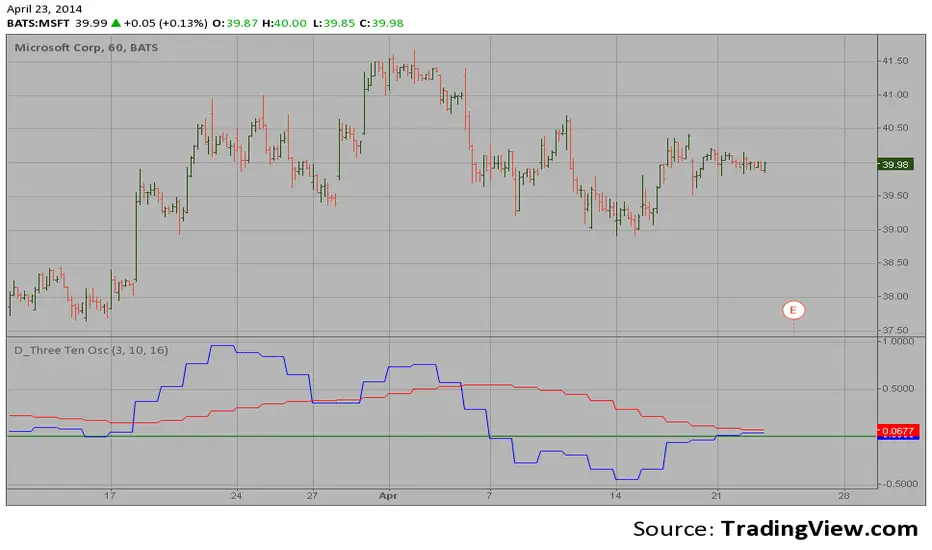
D_Three Ten Osc on the IntradayHi
Let me introduce my D_Three Ten Osc script.
This indicator allows the
user to plot a daily 3-10 Oscillator on a Tick Bar Chart or any intraday interval.
Walter Bressert's 3-10 Oscillator is a detrending oscillator derived
from subtracting a 10 day moving average from a 3 day moving average.
The second plot is an 16 day simple moving average of the 3-10 Oscillator.
The 16 period moving average is the slow line and the 3/10 oscillator is
the fast line.
For more information on the 3-10 Oscillator see Walter Bressert's book
"The Power of Oscillator/Cycle Combinations"
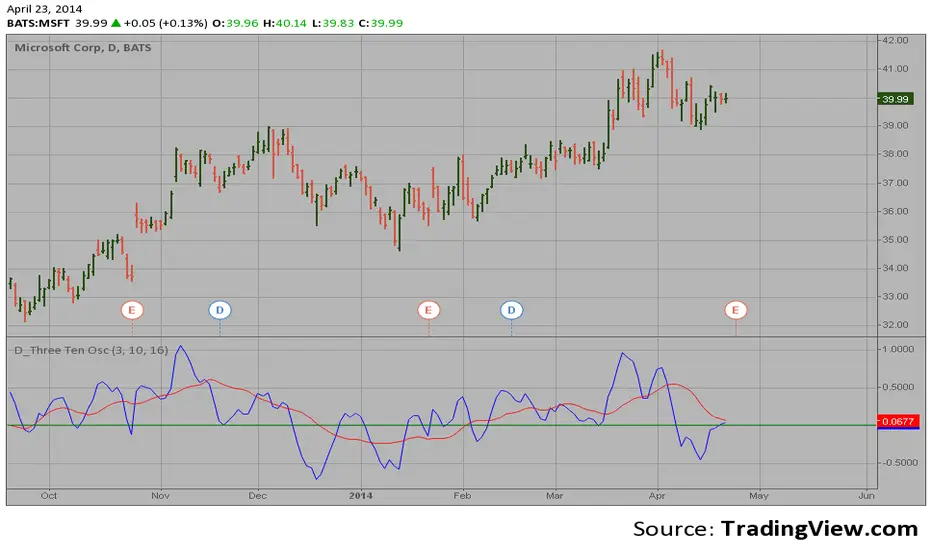
D_Three Ten Osc on the DailyHi
Let me introduce my D_Three Ten Osc script.
This indicator allows the
user to plot a daily 3-10 Oscillator on a Tick Bar Chart or any intraday interval.
Walter Bressert's 3-10 Oscillator is a detrending oscillator derived
from subtracting a 10 day moving average from a 3 day moving average.
The second plot is an 16 day simple moving average of the 3-10 Oscillator.
The 16 period moving average is the slow line and the 3/10 oscillator is
the fast line.
For more information on the 3-10 Oscillator see Walter Bressert's book
"The Power of Oscillator/Cycle Combinations"
SR & POI Indicator//@version=5
indicator(title='SR & POI Indicator', overlay=true, max_boxes_count=500, max_lines_count=500, max_labels_count=500)
//============================================================================
// SUPPLY/DEMAND & POI SETTINGS
//============================================================================
swing_length = input.int(10, title = 'Swing High/Low Length', group = 'Supply/Demand Settings', minval = 1, maxval = 50)
history_of_demand_to_keep = input.int(20, title = 'History To Keep', group = 'Supply/Demand Settings', minval = 5, maxval = 50)
box_width = input.float(2.5, title = 'Supply/Demand Box Width', group = 'Supply/Demand Settings', minval = 1, maxval = 10, step = 0.5)
show_price_action_labels = input.bool(false, title = 'Show Price Action Labels', group = 'Supply/Demand Visual Settings')
supply_color = input.color(color.new(#EDEDED,70), title = 'Supply', group = 'Supply/Demand Visual Settings', inline = '3')
supply_outline_color = input.color(color.new(color.white,75), title = 'Outline', group = 'Supply/Demand Visual Settings', inline = '3')
demand_color = input.color(color.new(#00FFFF,70), title = 'Demand', group = 'Supply/Demand Visual Settings', inline = '4')
demand_outline_color = input.color(color.new(color.white,75), title = 'Outline', group = 'Supply/Demand Visual Settings', inline = '4')
bos_label_color = input.color(color.white, title = 'BOS Label', group = 'Supply/Demand Visual Settings')
poi_label_color = input.color(color.white, title = 'POI Label', group = 'Supply/Demand Visual Settings')
swing_type_color = input.color(color.black, title = 'Price Action Label', group = 'Supply/Demand Visual Settings')
//============================================================================
// SR SETTINGS
//============================================================================
enableSR = input(true, "SR On/Off", group="SR Settings")
colorSup = input(#00DBFF, "Support Color", group="SR Settings")
colorRes = input(#E91E63, "Resistance Color", group="SR Settings")
strengthSR = input.int(2, "S/R Strength", 1, group="SR Settings")
lineStyle = input.string("Dotted", "Line Style", , group="SR Settings")
lineWidth = input.int(2, "S/R Line Width", 1, group="SR Settings")
useZones = input(true, "Zones On/Off", group="SR Settings")
useHLZones = input(true, "High Low Zones On/Off", group="SR Settings")
zoneWidth = input.int(2, "Zone Width %", 0, tooltip="it's calculated using % of the distance between highest/lowest in last 300 bars", group="SR Settings")
expandSR = input(true, "Expand SR", group="SR Settings")
//============================================================================
// SUPPLY/DEMAND FUNCTIONS
//============================================================================
// Function to add new and remove last in array
f_array_add_pop(array, new_value_to_add) =>
array.unshift(array, new_value_to_add)
array.pop(array)
// Function for swing H & L labels
f_sh_sl_labels(array, swing_type) =>
var string label_text = na
if swing_type == 1
if array.get(array, 0) >= array.get(array, 1)
label_text := 'HH'
else
label_text := 'LH'
label.new(bar_index - swing_length, array.get(array,0), text = label_text, style=label.style_label_down, textcolor = swing_type_color, color = color.new(swing_type_color, 100), size = size.tiny)
else if swing_type == -1
if array.get(array, 0) >= array.get(array, 1)
label_text := 'HL'
else
label_text := 'LL'
label.new(bar_index - swing_length, array.get(array,0), text = label_text, style=label.style_label_up, textcolor = swing_type_color, color = color.new(swing_type_color, 100), size = size.tiny)
// Function to check overlapping
f_check_overlapping(new_poi, box_array, atr) =>
atr_threshold = atr * 2
okay_to_draw = true
for i = 0 to array.size(box_array) - 1
top = box.get_top(array.get(box_array, i))
bottom = box.get_bottom(array.get(box_array, i))
poi = (top + bottom) / 2
upper_boundary = poi + atr_threshold
lower_boundary = poi - atr_threshold
if new_poi >= lower_boundary and new_poi <= upper_boundary
okay_to_draw := false
break
else
okay_to_draw := true
okay_to_draw
// Function to draw supply or demand zone
f_supply_demand(value_array, bn_array, box_array, label_array, box_type, atr) =>
atr_buffer = atr * (box_width / 10)
box_left = array.get(bn_array, 0)
box_right = bar_index
var float box_top = 0.00
var float box_bottom = 0.00
var float poi = 0.00
if box_type == 1
box_top := array.get(value_array, 0)
box_bottom := box_top - atr_buffer
poi := (box_top + box_bottom) / 2
else if box_type == -1
box_bottom := array.get(value_array, 0)
box_top := box_bottom + atr_buffer
poi := (box_top + box_bottom) / 2
okay_to_draw = f_check_overlapping(poi, box_array, atr)
if box_type == 1 and okay_to_draw
box.delete( array.get(box_array, array.size(box_array) - 1) )
f_array_add_pop(box_array, box.new( left = box_left, top = box_top, right = box_right, bottom = box_bottom, border_color = supply_outline_color,
bgcolor = supply_color, extend = extend.right, text = 'SUPPLY', text_halign = text.align_center, text_valign = text.align_center, text_color = poi_label_color, text_size = size.small, xloc = xloc.bar_index))
box.delete( array.get(label_array, array.size(label_array) - 1) )
f_array_add_pop(label_array, box.new( left = box_left, top = poi, right = box_right, bottom = poi, border_color = color.new(poi_label_color,90),
bgcolor = color.new(poi_label_color,90), extend = extend.right, text = 'POI', text_halign = text.align_left, text_valign = text.align_center, text_color = poi_label_color, text_size = size.small, xloc = xloc.bar_index))
else if box_type == -1 and okay_to_draw
box.delete( array.get(box_array, array.size(box_array) - 1) )
f_array_add_pop(box_array, box.new( left = box_left, top = box_top, right = box_right, bottom = box_bottom, border_color = demand_outline_color,
bgcolor = demand_color, extend = extend.right, text = 'DEMAND', text_halign = text.align_center, text_valign = text.align_center, text_color = poi_label_color, text_size = size.small, xloc = xloc.bar_index))
box.delete( array.get(label_array, array.size(label_array) - 1) )
f_array_add_pop(label_array, box.new( left = box_left, top = poi, right = box_right, bottom = poi, border_color = color.new(poi_label_color,90),
bgcolor = color.new(poi_label_color,90), extend = extend.right, text = 'POI', text_halign = text.align_left, text_valign = text.align_center, text_color = poi_label_color, text_size = size.small, xloc = xloc.bar_index))
// Function to change supply/demand to BOS if broken
f_sd_to_bos(box_array, bos_array, label_array, zone_type) =>
if zone_type == 1
for i = 0 to array.size(box_array) - 1
level_to_break = box.get_top(array.get(box_array,i))
if close >= level_to_break
copied_box = box.copy(array.get(box_array,i))
f_array_add_pop(bos_array, copied_box)
mid = (box.get_top(array.get(box_array,i)) + box.get_bottom(array.get(box_array,i))) / 2
box.set_top(array.get(bos_array,0), mid)
box.set_bottom(array.get(bos_array,0), mid)
box.set_extend( array.get(bos_array,0), extend.none)
box.set_right( array.get(bos_array,0), bar_index)
box.set_text( array.get(bos_array,0), 'BOS' )
box.set_text_color( array.get(bos_array,0), bos_label_color)
box.set_text_size( array.get(bos_array,0), size.small)
box.set_text_halign( array.get(bos_array,0), text.align_center)
box.set_text_valign( array.get(bos_array,0), text.align_center)
box.delete(array.get(box_array, i))
box.delete(array.get(label_array, i))
if zone_type == -1
for i = 0 to array.size(box_array) - 1
level_to_break = box.get_bottom(array.get(box_array,i))
if close <= level_to_break
copied_box = box.copy(array.get(box_array,i))
f_array_add_pop(bos_array, copied_box)
mid = (box.get_top(array.get(box_array,i)) + box.get_bottom(array.get(box_array,i))) / 2
box.set_top(array.get(bos_array,0), mid)
box.set_bottom(array.get(bos_array,0), mid)
box.set_extend( array.get(bos_array,0), extend.none)
box.set_right( array.get(bos_array,0), bar_index)
box.set_text( array.get(bos_array,0), 'BOS' )
box.set_text_color( array.get(bos_array,0), bos_label_color)
box.set_text_size( array.get(bos_array,0), size.small)
box.set_text_halign( array.get(bos_array,0), text.align_center)
box.set_text_valign( array.get(bos_array,0), text.align_center)
box.delete(array.get(box_array, i))
box.delete(array.get(label_array, i))
// Function to extend box endpoint
f_extend_box_endpoint(box_array) =>
for i = 0 to array.size(box_array) - 1
box.set_right(array.get(box_array, i), bar_index + 100)
//============================================================================
// SR FUNCTIONS
//============================================================================
percWidth(len, perc) => (ta.highest(len) - ta.lowest(len)) * perc / 100
//============================================================================
// SUPPLY/DEMAND CALCULATIONS
//============================================================================
atr = ta.atr(50)
swing_high = ta.pivothigh(high, swing_length, swing_length)
swing_low = ta.pivotlow(low, swing_length, swing_length)
var swing_high_values = array.new_float(5,0.00)
var swing_low_values = array.new_float(5,0.00)
var swing_high_bns = array.new_int(5,0)
var swing_low_bns = array.new_int(5,0)
var current_supply_box = array.new_box(history_of_demand_to_keep, na)
var current_demand_box = array.new_box(history_of_demand_to_keep, na)
var current_supply_poi = array.new_box(history_of_demand_to_keep, na)
var current_demand_poi = array.new_box(history_of_demand_to_keep, na)
var supply_bos = array.new_box(5, na)
var demand_bos = array.new_box(5, na)
// New swing high
if not na(swing_high)
f_array_add_pop(swing_high_values, swing_high)
f_array_add_pop(swing_high_bns, bar_index )
if show_price_action_labels
f_sh_sl_labels(swing_high_values, 1)
f_supply_demand(swing_high_values, swing_high_bns, current_supply_box, current_supply_poi, 1, atr)
// New swing low
else if not na(swing_low)
f_array_add_pop(swing_low_values, swing_low)
f_array_add_pop(swing_low_bns, bar_index )
if show_price_action_labels
f_sh_sl_labels(swing_low_values, -1)
f_supply_demand(swing_low_values, swing_low_bns, current_demand_box, current_demand_poi, -1, atr)
f_sd_to_bos(current_supply_box, supply_bos, current_supply_poi, 1)
f_sd_to_bos(current_demand_box, demand_bos, current_demand_poi, -1)
f_extend_box_endpoint(current_supply_box)
f_extend_box_endpoint(current_demand_box)
//============================================================================
// SR CALCULATIONS & PLOTTING
//============================================================================
rb = 10
prd = 284
ChannelW = 10
label_loc = 55
style = lineStyle == "Solid" ? line.style_solid : lineStyle == "Dotted" ? line.style_dotted : line.style_dashed
ph = ta.pivothigh(rb, rb)
pl = ta.pivotlow (rb, rb)
sr_levels = array.new_float(21, na)
prdhighest = ta.highest(prd)
prdlowest = ta.lowest(prd)
cwidth = percWidth(prd, ChannelW)
zonePerc = percWidth(300, zoneWidth)
aas = array.new_bool(41, true)
u1 = 0.0, u1 := nz(u1 )
d1 = 0.0, d1 := nz(d1 )
highestph = 0.0, highestph := highestph
lowestpl = 0.0, lowestpl := lowestpl
var sr_levs = array.new_float(21, na)
label hlabel = na, label.delete(hlabel )
label llabel = na, label.delete(llabel )
var sr_lines = array.new_line(21, na)
var sr_linesH = array.new_line(21, na)
var sr_linesL = array.new_line(21, na)
var sr_linesF = array.new_linefill(21, na)
var sr_labels = array.new_label(21, na)
if ph or pl
for x = 0 to array.size(sr_levels) - 1
array.set(sr_levels, x, na)
highestph := prdlowest
lowestpl := prdhighest
countpp = 0
for x = 0 to prd
if na(close )
break
if not na(ph ) or not na(pl )
highestph := math.max(highestph, nz(ph , prdlowest), nz(pl , prdlowest))
lowestpl := math.min(lowestpl, nz(ph , prdhighest), nz(pl , prdhighest))
countpp += 1
if countpp > 40
break
if array.get(aas, countpp)
upl = (ph ? high : low ) + cwidth
dnl = (ph ? high : low ) - cwidth
u1 := countpp == 1 ? upl : u1
d1 := countpp == 1 ? dnl : d1
tmp = array.new_bool(41, true)
cnt = 0
tpoint = 0
for xx = 0 to prd
if na(close )
break
if not na(ph ) or not na(pl )
chg = false
cnt += 1
if cnt > 40
break
if array.get(aas, cnt)
if not na(ph )
if high <= upl and high >= dnl
tpoint += 1
chg := true
if not na(pl )
if low <= upl and low >= dnl
tpoint += 1
chg := true
if chg and cnt < 41
array.set(tmp, cnt, false)
if tpoint >= strengthSR
for g = 0 to 40 by 1
if not array.get(tmp, g)
array.set(aas, g, false)
if ph and countpp < 21
array.set(sr_levels, countpp, high )
if pl and countpp < 21
array.set(sr_levels, countpp, low )
// Plot SR
var line highest_ = na, line.delete(highest_)
var line lowest_ = na, line.delete(lowest_)
var line highest_fill1 = na, line.delete(highest_fill1)
var line highest_fill2 = na, line.delete(highest_fill2)
var line lowest_fill1 = na, line.delete(lowest_fill1)
var line lowest_fill2 = na, line.delete(lowest_fill2)
hi_col = close >= highestph ? colorSup : colorRes
lo_col = close >= lowestpl ? colorSup : colorRes
if enableSR
highest_ := line.new(bar_index - 311, highestph, bar_index, highestph, xloc.bar_index, expandSR ? extend.both : extend.right, hi_col, style, lineWidth)
lowest_ := line.new(bar_index - 311, lowestpl , bar_index, lowestpl , xloc.bar_index, expandSR ? extend.both : extend.right, lo_col, style, lineWidth)
if useHLZones
highest_fill1 := line.new(bar_index - 311, highestph + zonePerc, bar_index, highestph + zonePerc, xloc.bar_index, expandSR ? extend.both : extend.right, na)
highest_fill2 := line.new(bar_index - 311, highestph - zonePerc, bar_index, highestph - zonePerc, xloc.bar_index, expandSR ? extend.both : extend.right, na)
lowest_fill1 := line.new(bar_index - 311, lowestpl + zonePerc , bar_index, lowestpl + zonePerc , xloc.bar_index, expandSR ? extend.both : extend.right, na)
lowest_fill2 := line.new(bar_index - 311, lowestpl - zonePerc , bar_index, lowestpl - zonePerc , xloc.bar_index, expandSR ? extend.both : extend.right, na)
linefill.new(highest_fill1, highest_fill2, color.new(hi_col, 80))
linefill.new(lowest_fill1 , lowest_fill2 , color.new(lo_col, 80))
if ph or pl
for x = 0 to array.size(sr_lines) - 1
array.set(sr_levs, x, array.get(sr_levels, x))
for x = 0 to array.size(sr_lines) - 1
line.delete(array.get(sr_lines, x))
line.delete(array.get(sr_linesH, x))
line.delete(array.get(sr_linesL, x))
linefill.delete(array.get(sr_linesF, x))
if array.get(sr_levs, x) and enableSR
line_col = close >= array.get(sr_levs, x) ? colorSup : colorRes
array.set(sr_lines, x, line.new(bar_index - 355, array.get(sr_levs, x), bar_index, array.get(sr_levs, x), xloc.bar_index, expandSR ? extend.both : extend.right, line_col, style, lineWidth))
if useZones
array.set(sr_linesH, x, line.new(bar_index - 355, array.get(sr_levs, x) + zonePerc, bar_index, array.get(sr_levs, x) + zonePerc, xloc.bar_index, expandSR ? extend.both : extend.right, na))
array.set(sr_linesL, x, line.new(bar_index - 355, array.get(sr_levs, x) - zonePerc, bar_index, array.get(sr_levs, x) - zonePerc, xloc.bar_index, expandSR ? extend.both : extend.right, na))
array.set(sr_linesF, x, linefill.new(array.get(sr_linesH, x), array.get(sr_linesL, x), color.new(line_col, 80)))
for x = 0 to array.size(sr_labels) - 1
label.delete(array.get(sr_labels, x))
if array.get(sr_levs, x) and enableSR
lab_loc = close >= array.get(sr_levs, x) ? label.style_label_up : label.style_label_down
lab_col = close >= array.get(sr_levs, x) ? colorSup : colorRes
array.set(sr_labels, x, label.new(bar_index + label_loc, array.get(sr_levs, x), str.tostring(math.round_to_mintick(array.get(sr_levs, x))), color=lab_col , textcolor=#000000, style=lab_loc))
hlabel := enableSR ? label.new(bar_index + label_loc + math.round(math.sign(label_loc)) * 20, highestph, "High Level : " + str.tostring(highestph), color=hi_col, textcolor=#000000, style=label.style_label_down) : na
llabel := enableSR ? label.new(bar_index + label_loc + math.round(math.sign(label_loc)) * 20, lowestpl , "Low Level : " + str.tostring(lowestpl) , color=lo_col, textcolor=#000000, style=label.style_label_up ) : na

FCPO MASTER v6 – Sideway + Breakout + OB + FVG (TUPLE SAFE)TL;DR cepat
1. Gunakan M5 untuk entry & OB/FVG confirmation.
2. Gunakan M15 untuk confirm trend/false breakout.
3. Gunakan H1 untuk bias arah (overall market).
4. Entry hanya bila signal + OB/FVG/candle rejection (script buatkan).
5. SL 5–8 tick, TP 10–25 tick ikut setup (sideway vs breakout).
6. Follow checklist setiap trade — jangan lompat.
________________________________________
Setup awal (1–2 min)
1. Pasang script FCPO Sideway MASTER – OB + Imbalance + Confirmation di TradingView.
2. Timeframes: buka M5, M15, H1 (susun 3 chart atau 1 chart multi-timeframe).
3. Input default: ATR14, Breakout Buffer 5 tick, RangeLen 20, ADX14, TP12, SL8. (Kau boleh tweak nanti).
4. Aktifkan alerts pada BUY Confirm / SELL Confirm / Sideway Buy / Sideway Sell.
________________________________________
Step-by-step trading process
1) Mulakan dengan H1 — tentukan bias HTF
• Lihat H1 untuk jawapan: Trend Up / Down / Sideway.
• Rule ringkas:
o ADX H1 > 20 + price above H1 EMA → bias Bull
o ADX H1 > 20 + price below H1 EMA → bias Bear
o ADX H1 < 20 → market HTF sideway (no strong bias)
Kenapa: H1 bagi kau idea “kalau breakout pada M5, patut follow atau tolak”.
________________________________________
2) Pergi ke M15 — confirm trend & valid breakout
• M15 kena setuju dengan idea breakout.
o Untuk strong breakout: M15 kena tunjuk candle close di atas/bawah range + volume naik.
o Kalau M5 breakout tapi M15 tak setuju (M15 masih sideway) → treat as fakeout. Jangan masuk.
________________________________________
3) M5 — cari entry & confirmation (OB/FVG + candle)
• M5 adalah tempat kau buat keputusan masuk.
• Tunggu script keluarkan Sideway Buy/Sell atau Breakout Buy/Sell.
• CONFIRM entry mesti ada sekurang-kurangnya 1 dari:
o Bull/Bear Order Block searah signal (script detect).
o FVG / Imbalance zone dipenuhi & price retest.
o Candle rejection (pinbar / bearish/bullish engulfing) pada zone.
Jika tiada confirmation → no trade.
________________________________________
4) Checklist sebelum tekan Buy/Sell (MUST)
• H1 bias tidak melawan trade (prefer sama arah).
• M15 confirm breakout / trend or neutral.
• Script keluarkan signal (sideway or breakout).
• OB or FVG atau candle rejection ada.
• ATR kenaikan jika breakout (untuk breakout trade).
• Volume spike jika breakout.
• Risk:SL <= 2% akaun (position sizing).
Kalau semua ticked → boleh entry.
________________________________________
5) Setting SL / TP & position sizing
• Sideway (scalp): SL = 5–8 tick, TP = 8–12 tick.
• Breakout (trend): SL = 8–12 tick, TP = 15–25+ tick (trail later).
• Position sizing: Risk per trade 1–2%.
o Lot size = (Account Risk RM × 1 tick value) / (SL ticks × tickValue) — (kalau kau gunakan fixed tick value, adjust ikut lot).
(Script tunjuk SL & TP label — follow itu.)
________________________________________
6) Entry types
• A. Sideway Reversal (M5)
o Signal: Sideway Buy / Sideway Sell
o Confirm: OB/FVG or rejection candle at range bottom/top
o Trade: scalp target 8–12 tick, tight SL 5–8 tick
• B. Breakout (M5 entry, M15 confirm)
o Signal: Breakout Buy/Sell (Strong)
o Confirm: ATR expanding + volume spike + M15 alignment
o Trade: trend follow, TP 15–25 tick, trailing stop active
• C. Retest Entry
o Breakout happens, price returns to retest range / OB / FVG → wait for rejection candle then enter. Safer.
________________________________________
7) Trailing & exit rules
• Jika useTrail = true script plots trailing stop (ATR × multiplier).
• Exit rules:
1. Hit TP → close.
2. Hit SL → close.
3. If trailing stop hit → close.
4. If opposing confirmed signal muncul (e.g., SELL confirm while long) → consider close early.
5. If H1 bias flips strongly vs trade → tighten stop or close.
________________________________________
8) Multiple signals & scaling
• Never add to losing position (no averaging down).
• If want scale-in on confirmed trend: add 1 partial size after price moves +10–12 tick in favor and shows continuation candle + no bearish OB/FVG.
• Keep aggregated risk within your max (2–3%).
________________________________________
9) Example trade walkthrough (concrete)
• RangeHigh = 4065, RangeLow = 4035 (contoh).
• Market sideway M5.
Case A — Sideway Sell:
1. Price touches 4064–4065, script shows sidewaySell.
2. Lihat OB: ada bear OB zone di 4062–4066 → confirm.
3. Candle rejection (bearish pinbar) muncul → enter SELL M5.
4. Set SL = 5 tick above rangeHigh = 4070, TP = 10 tick → 4055.
5. Trail jika price turun > 8 tick: aktifkan trailing.
6. Close at TP or trail/SL.
Case B — Breakout Buy:
1. Price closes above 4065 + 5 tick buffer = 4070 on M5. Script shows trueBreakUp.
2. M15 shows candle close above M15 resistance + volume spike → confirm.
3. Enter BUY, SL = 8 tick below entry, TP initial 20 tick, trail with ATR×1.5.
4. Move stop to breakeven after +10 tick, scale out half at +12 tick, leave rest to trail.
________________________________________
10) Journal & review
• Semua trade: record entry time, TF, reason (which confirmations), SL/TP, result, lesson.
• Weekly review: check which confirmation worked best (OB vs FVG vs candle) and tweak settings.
________________________________________
11) Tweaks / optimisations cepat
• Jika terlalu banyak false sideway signals → kurangkan touchDist ke 2 tick.
• Kalau fakeout breakout banyak → tambah tickBuf ke 6–8.
• Nak lebih konservatif → cuma trade breakout yang juga setuju M15.
________________________________________
12) Alerts & execution (practical)
• Pasang alert pada BUY Confirm / SELL Confirm (script).
• Kalau kau guna broker yang support one-click order, siap sediakan template order (SL/TP default).
• Kalau manual, bila alert masuk: buka M5, cepat confirm OB/FVG & candle rejection → entry.
________________________________________
Quick reference table (handy)
• TF utama entry: M5
• Confirm mid-TF: M15
• Bias HTF: H1
• Sideway SL/TP: SL 5–8, TP 8–12
• Breakout SL/TP: SL 8–12, TP 15–25+
• Mandatory confirmation: (Script signal) + (OB or FVG or candle)

YM Ultimate SNIPER v8.1# YM Ultimate SNIPER v8.1 - SNIPER STRICT EDITION
## 🎯 CHANGELOG: What's New in v8.1
### The Problem We Fixed
**GOD MODE was handing out awards like participation trophies.** Too many wicky, indecisive candles were getting GOD MODE status just because they had enough confluence points. A GOD MODE candle should show **CLEAR DOMINANCE** - fat body, minimal adverse wick, consistent pressure throughout formation.
---
## 🔥 MAJOR CHANGES
### 1. CANDLE DOMINANCE INDEX (CDI) - NEW METRIC
The CDI quantifies "who won the candle" on a 0-10 scale:
```
CDI COMPONENTS:
├── Body Score (0-4 pts): How fat is the body?
├── Adverse Wick Score (0-3 pts): How small is the wick against direction?
├── Favorable Wick Score (0-2 pts): Clean entry side?
└── Closing Strength (0-1 pt): Did it close near the extreme?
CDI RATINGS:
├── 8.0+ = 🔥 DOMINANT (ideal for GOD MODE)
├── 6.0-7.9 = ✓✓ STRONG
├── 4.0-5.9 = ✓ ACCEPTABLE
└── <4.0 = WEAK (not GOD MODE worthy)
```
### 2. STRICT GOD MODE GATES (6 GATES)
**Score alone no longer qualifies for GOD MODE.** Now a candle must pass ALL 6 gates:
| Gate | Requirement | Default |
|------|-------------|---------|
| **1. Score** | Must meet GOD MODE threshold | ≥9.0 |
| **2. Body** | Body ratio must be "fat" | ≥70% |
| **3. Adverse Wick** | Wick against direction must be small | ≤20% |
| **4. Delta** | Buy/sell dominance must be strong | ≥70% |
| **5. Session** | Must be in active session (configurable) | LDN/NY/PWR |
| **6. Pressure** | Intrabar pressure must be consistent | Same side dominated early AND late |
**If ANY gate fails, GOD MODE is DENIED** - even with a 10/10 score!
### 3. 30-BAR SIGNAL DISPLAY LIMIT
**Past signals are now hidden.** Only the last 30 bars show tier markers, sweeps, and absorption signals. This keeps the chart clean and focused on recent action.
```
WHAT'S HIDDEN AFTER 30 BARS:
├── Tier signals (S/A/B/Z)
├── GOD MODE markers
├── Liquidity sweep diamonds
├── Absorption crosses
└── Stop/Target lines
WHAT ALWAYS SHOWS:
├── FVG/IFVG zones (structural)
├── Order Blocks (structural)
├── Session markers (context)
└── Session background colors
```
**Configurable:** Change "Show Signals: Last N Bars" in settings (10-100)
### 4. PRESSURE CONSISTENCY TRACKING
New intrabar analysis that tracks if the **same side dominated throughout the candle**:
```
CANDLE FORMATION ANALYSIS:
├── First Half: Who dominated? (earlyBuyVol vs earlySellVol)
├── Second Half: Who dominated? (lateBuyVol vs lateSellVol)
└── Consistent? = Same side won BOTH halves
PRESSURE CONSISTENT = Buyers dominated early AND late
OR Sellers dominated early AND late
PRESSURE MIXED = Buyers dominated early, sellers late
OR Sellers dominated early, buyers late
```
**GOD MODE requires consistent pressure** when intrabar analysis is enabled.
### 5. GOD MODE DENIAL REASON IN TABLE
When a candle scores 9.0+ but fails a gate, the table now shows **WHY**:
```
DENIAL REASONS:
├── "DENIED: WICK" = Adverse wick too large (>20%)
├── "DENIED: DELTA" = Delta dominance too weak (<70%)
├── "DENIED: SESSION" = Not in active session
├── "DENIED: VOLUME" = Volume below 1.5x
└── "DENIED: PRESSURE" = Mixed pressure during formation
```
---
## 📊 NEW TABLE SECTIONS
### CANDLE QUALITY Section (NEW)
```
══ CANDLE QUALITY ══
Body | 78% | FAT
Adv Wick | 12% | CLEAN
CDI | 8.2/10 | 🔥
```
### INTRABAR Section (UPDATED)
```
══ INTRABAR ══
IB Data | 12 bars | ✓
IB Delta | 74% BUY | 🔥
Pressure | CONSISTENT | ✓ ← NEW
```
---
## ⚙️ NEW SETTINGS
### CANDLE DOMINANCE (v8.1) Group
```
GOD MODE: Min Body Ratio = 0.70 (body must be 70%+ of range)
GOD MODE: Max Adverse Wick = 0.20 (wick against direction ≤20%)
GOD MODE: Min Delta Dominance = 0.70 (70%+ buy/sell dominance)
GOD MODE: Min Intrabar Delta = 0.68 (intrabar delta ≥68%)
GOD MODE: Require Active Session = ON
GOD MODE: Require 1.5x+ Volume = ON
```
### SIGNAL DISPLAY (v8.1) Group
```
Show Signals: Last N Bars = 30
Show Historical FVG/OB Zones = ON (zones always visible)
```
---
## 🎯 PRACTICAL IMPACT
### Before v8.1 (Too Many False GOD MODE)
```
Candle: 35 point move, score 9.2, BUT:
- Body only 55% of range (thin)
- Upper wick 35% (buyers got pushed back hard)
- Intrabar showed mixed pressure
RESULT: GOD MODE ⚡ (WRONG!)
```
### After v8.1 (Strict GOD MODE)
```
Same candle: Score 9.2, but:
- Gate 2 FAILED: Body 55% < 70% required
- Gate 3 FAILED: Wick 35% > 20% allowed
- Gate 6 FAILED: Pressure inconsistent
RESULT: DENIED: WICK (Correct - this was a fake-out candle)
```
---
## 🏆 THE NEW GOD MODE STANDARD
A TRUE GOD MODE candle must show:
1. **HIGH SCORE** (≥9.0) - Multiple confluence factors aligned
2. **FAT BODY** (≥70%) - Clear directional commitment
3. **CLEAN WICKS** (≤20% adverse) - Minimal pushback
4. **STRONG DELTA** (≥70%) - One side clearly dominated
5. **IN SESSION** - Institutional participation
6. **CONSISTENT PRESSURE** - Same side controlled throughout
**Translation:** *"Institutions stepped in with size, pushed hard in one direction, and never let up. No hesitation, no give-back. This is a candle that means business."*
---
## 📈 YM/MYM OPTIMIZATION NOTES
The default settings are tuned for YM's characteristics:
- Lower volatility than NQ/GC/BTC → Tighter gates work better
- 50 pts for S-Tier is already conservative
- 70% body ratio filters out the indecisive noise
- Session requirement is crucial - YM moves on institutional flow
### Low Volume Conditions
The strict gates actually **help** in low volume:
- Wicky candles (common in low vol) get filtered
- Pressure consistency catches fake moves
- CDI prevents thin-body noise from triggering
---
## 🚀 QUICK START
1. Apply v8.1 to your 5-minute YM chart
2. Set intrabar to "1" (1-minute) or "100T" (tick)
3. Watch the CANDLE QUALITY section in the table
4. GOD MODE will now be RARE - but TRUSTWORTHY
5. Check the DENIAL reason if score is 9+ but no ⚡
---
*v8.1 SNIPER STRICT EDITION - "Fat Candles Only"*
*© Alexandro Disla*

MTC – Multi-Timeframe Trend Confirmator V2MTC – Multi-Timeframe Trend Confirmator V2
A comprehensive trend analysis indicator that systematically combines six technical indicators across three customizable timeframes, using a weighted scoring system to identify high-probability trend conditions.
ORIGINALITY AND CONCEPT
This indicator is original in its approach to multi-timeframe trend confirmation. Rather than relying on a single indicator or timeframe, it creates a composite score by evaluating six different technical conditions simultaneously across three timeframes. The scoring system weighs certain indicators more heavily based on their reliability in trend identification. The visual gauge provides an at-a-glance view of trend alignment across timeframes, making it easier to identify when multiple timeframes agree - a condition that typically produces stronger, more reliable trends.
HOW IT WORKS - DETAILED SCORING METHODOLOGY
The indicator evaluates six technical conditions on each timeframe. Each condition contributes to a composite score:
EMA 200 (Weight: 1 point)
Bullish: Price closes above EMA 200 (+1)
Bearish: Price closes below EMA 200 (-1)
Rationale: Long-term trend direction
SMA 50/200 Crossover (Weight: 1 point)
Bullish: SMA 50 above SMA 200 (+1)
Bearish: SMA 50 below SMA 200 (-1)
Rationale: Golden/Death cross confirmation
RSI 14 (Weight: 1 point)
Bullish: RSI above 55 (+1)
Bearish: RSI below 45 (-1)
Neutral: RSI between 45-55 (0)
Rationale: Momentum filter with buffer zone to avoid chop
MACD (12,26,9) (Weight: 1 point)
Bullish: MACD line above signal line (+1)
Bearish: MACD line below signal line (-1)
Rationale: Trend momentum confirmation
ADX 14 (Weight: 2 points - DOUBLE WEIGHTED)
Requires ADX above 25 to activate
Bullish: DI+ above DI- and ADX > 25 (+2)
Bearish: DI- above DI+ and ADX > 25 (-2)
Neutral: ADX below 25 (0)
Rationale: Trend strength filter - only counts when a strong trend exists. Double weighted because ADX is specifically designed to measure trend strength, making it more reliable than oscillators.
Supertrend (Factor: 3.0, ATR Period: 10) (Weight: 2 points - DOUBLE WEIGHTED)
Bullish: Direction indicator = -1 (+2)
Bearish: Direction indicator = +1 (-2)
Rationale: Dynamic support/resistance that adapts to volatility. Double weighted because Supertrend provides clear, objective trend signals with built-in stop-loss levels.
COMPOSITE SCORE CALCULATION:
Total possible score range: -10 to +10 points
Score interpretation:
Score > 2: UPTREND (majority of indicators bullish, especially weighted ones)
Score < -2: DOWNTREND (majority of indicators bearish, especially weighted ones)
Score between -2 and +2: NEUTRAL/RANGING (mixed signals or weak trend)
The threshold of +/- 2 was chosen because it requires more than just basic agreement - it typically means at least 3-4 indicators align, or that the heavily-weighted indicators (ADX, Supertrend) confirm the direction.
MULTI-TIMEFRAME LOGIC:
The indicator calculates the composite score independently for three timeframes:
Higher Timeframe (default: 4H) - Major trend direction
Mid Timeframe (default: 1H) - Intermediate trend
Lower Timeframe (default: 15min) - Entry timing
Main Trend Confirmation Rule:
The indicator only signals a confirmed trend when BOTH the higher timeframe AND mid timeframe scores agree (both > 2 for uptrend, or both < -2 for downtrend). This dual-timeframe confirmation significantly reduces false signals during choppy or ranging markets.
HOW TO USE IT
Setup:
Add indicator to chart
Customize timeframes based on your trading style:
Scalpers: 15min, 5min, 1min
Day traders: 4H, 1H, 15min (default)
Swing traders: Daily, 4H, 1H
Toggle individual indicators on/off based on your preference
Adjust Supertrend parameters if needed for your instrument's volatility
Reading the Gauge (Top Right Corner):
Each row shows one timeframe
Left column: Timeframe label
Middle column: Visual strength bars (10 bars = maximum score)
Green bars = Bullish score
Red bars = Bearish score
Yellow bars = Neutral/ranging
More filled bars = stronger trend
Right column: Numerical score
Trading Signals:
Entry Signals:
Long Entry: Wait for upward triangle arrow (appears when higher + mid TF both bullish)
Confirm gauge shows green bars on higher and mid timeframes
Lower timeframe should ideally turn green for entry timing
Chart background tints light green
Short Entry: Wait for downward triangle arrow (appears when higher + mid TF both bearish)
Confirm gauge shows red bars on higher and mid timeframes
Lower timeframe should ideally turn red for entry timing
Chart background tints light red
Position Management:
Stay in position while higher and mid timeframes remain aligned
Consider reducing position size when mid timeframe score weakens
Exit when higher timeframe trend reverses (daily label changes)
Avoiding False Signals:
Ignore signals when gauge shows mixed colors across timeframes
Avoid trading when scores are close to threshold (+/- 2 to +/- 4 range)
Best trades occur when all three timeframes align (all green or all red in gauge)
Use the numerical scores: higher absolute values (7-10) indicate stronger, more reliable trends
Practical Examples:
Example 1 - Strong Uptrend Entry:
Higher TF: +8 (strong green bars)
Mid TF: +6 (strong green bars)
Lower TF: +4 (moderate green bars)
Action: Look for long entries on lower timeframe pullbacks
Background is tinted green, upward arrow appears
Example 2 - Ranging Market (Avoid):
Higher TF: +3 (weak green)
Mid TF: -1 (weak red)
Lower TF: +2 (neutral yellow)
Action: Stay out, wait for alignment
Example 3 - Trend Reversal Warning:
Higher TF: +7 (still green)
Mid TF: -3 (turned red)
Lower TF: -5 (strong red)
Action: Consider exiting longs, prepare for potential higher TF reversal
Customization Options:
Timeframes: Adjust all three to match your trading horizon
Indicator Toggles: Disable indicators that don't suit your instrument:
Disable RSI for highly volatile crypto markets
Disable SMA crossover for range-bound instruments
Keep ADX and Supertrend enabled for trending markets
Visual Preferences:
Arrow size: 5 options from Tiny to Huge
Gauge size: Small/Medium/Large for different screen sizes
Toggle arrows on/off if you only want the gauge
Alert Setup:
Right-click chart, "Add Alert"
Condition: MTC v6 - UPTREND or DOWNTREND
Get notified when multi-timeframe confirmation occurs
Best Practices:
Use with Price Action: The indicator works best when combined with support/resistance levels, chart patterns, and volume analysis
Risk Management: Even with multi-timeframe confirmation, always use stop losses
Market Context: Works best in trending markets; less reliable in strong consolidation
Backtesting: Test the default settings on your specific instrument and timeframe before live trading
Patience: Wait for full multi-timeframe alignment rather than taking premature signals
Technical Notes:
All calculations use Pine Script's security function to fetch data from multiple timeframes
Prevents repainting by using confirmed bar data
Gauge updates in real-time on the last bar
Daily labels mark at the open of each new daily candle
Works on all instruments and timeframes
This indicator is ideal for traders who want objective, systematic trend identification without the complexity of analyzing multiple indicators manually across different timeframes.
-NATANTIA

DeepFlow Zones SNIPER# DeepFlow Zones SNIPER - Documentation & Cheatsheet
## 🎯 DeepFlow Zones - SNIPER Edition
**Horizontal Limit Order Zones | Institutional FVG + Single Prints**
> **Philosophy:** *Only mark the zones where institutions MUST have orders. Everything else is noise.*
---
## ⚡ QUICK CHEATSHEET
```
┌─────────────────────────────────────────────────────────────────────────────┐
│ DEEPFLOW ZONES SNIPER - QUICK REFERENCE │
├─────────────────────────────────────────────────────────────────────────────┤
│ │
│ 🎯 ZONE CREATION REQUIREMENTS (ALL MUST BE TRUE): │
│ ══════════════════════════════════════════════════ │
│ ✓ FVG exists → Gap between candle low and 2-bar-ago high │
│ ✓ Gap Size → At least 30% of ATR (significant gap) │
│ ✓ Impulse Candle → 1.8x average range + 65% body ratio │
│ ✓ Volume → 2.0x+ average on impulse candle │
│ ✓ Direction → Middle candle confirms gap direction │
│ │
├─────────────────────────────────────────────────────────────────────────────┤
│ │
│ 📊 ZONE TYPES: │
│ ══════════════ │
│ 🟢 BULLISH ZONE → Green box BELOW price (buy zone) │
│ 🔴 BEARISH ZONE → Red box ABOVE price (sell zone) │
│ ⚫ TESTED ZONE → Gray box (CE level touched) │
│ ⬛ BROKEN ZONE → Dark gray (price closed through) │
│ │
├─────────────────────────────────────────────────────────────────────────────┤
│ │
│ ⭐ SINGLE PRINT LINES: │
│ ══════════════════════ │
│ Requirements: │
│ • Range 1.8x+ average │
│ • Body 65%+ of range │
│ • Volume 2.0x+ average │
│ • Delta 60%+ confirms direction │
│ │
│ Usage: │
│ • Gold lines at HIGH and LOW of impulse candle │
│ • Price often returns to these levels │
│ • Use as support/resistance for entries │
│ │
├─────────────────────────────────────────────────────────────────────────────┤
│ │
│ 🚨 ENTRY SIGNALS: │
│ ═══════════════════ │
│ BUY🎯 appears when: │
│ • Price is inside BULLISH zone │
│ • Delta shows 60%+ buy dominance │
│ • Volume is 1.5x+ average │
│ │
│ SELL🎯 appears when: │
│ • Price is inside BEARISH zone │
│ • Delta shows 60%+ sell dominance │
│ • Volume is 1.5x+ average │
│ │
├─────────────────────────────────────────────────────────────────────────────┤
│ │
│ 📐 ZONE ANATOMY: │
│ ═════════════════ │
│ │
│ BULLISH FVG ZONE: BEARISH FVG ZONE: │
│ │
│ Current Low ───────────────── ───────────────── 2-bar-ago Low │
│ ┌─────────────────────────┐ ┌─────────────────────────┐ │
│ │ █████ ZONE █████████████│ │ █████ ZONE █████████████│ │
│ │- - - CE (50%) - - - - - │ │- - - CE (50%) - - - - - │ │
│ │ ████████████████████████│ │ ████████████████████████│ │
│ └─────────────────────────┘ └─────────────────────────┘ │
│ 2-bar-ago High ────────────── ───────────────── Current High │
│ │
│ Entry: At or near CE line Entry: At or near CE line │
│ Stop: Below zone bottom Stop: Above zone top │
│ Target: 1:1 or 2:1 R:R Target: 1:1 or 2:1 R:R │
│ │
├─────────────────────────────────────────────────────────────────────────────┤
│ │
│ ⛔ ZONE IS INVALID WHEN: │
│ ═════════════════════════ │
│ ✗ Gap size < 30% of ATR (too small) │
│ ✗ No impulse candle (weak move) │
│ ✗ Volume < 2x average (retail move) │
│ ✗ Zone age > 50 bars (stale) │
│ ✗ Price already closed through zone │
│ │
└─────────────────────────────────────────────────────────────────────────────┘
```
---
## 📋 DETAILED DOCUMENTATION
### What Makes SNIPER Zones Different?
Standard FVG indicators create zones everywhere. SNIPER zones only appear when there's **institutional footprint**:
| Filter | Standard FVG | SNIPER Zones | Why It Matters |
|--------|-------------|--------------|----------------|
| Gap Size | Any gap | **≥30% ATR** | Significant imbalance |
| Volume | Optional | **2.0x+ avg** | Institutional volume |
| Impulse | None | **1.8x range** | Real momentum |
| Body | None | **65%+ ratio** | Conviction candle |
| Max Zones | 20-50 | **10 max** | Only the best |
| Zone Life | 100 bars | **50 bars** | Fresh zones only |
---
### How Zones Are Created
```
BULLISH FVG FORMATION:
═══════════════════════
Bar 0 (2 bars ago): Bar 1 (Impulse): Bar 2 (Current):
┌─────┐ ┌─────┐ ┌─────┐
│ │ │█████│ │ │
│ │ HIGH ────── │█████│ │ │
│ │ │ │█████│ │ │
└─────┘ │ │█████│ │ │── LOW
│ └─────┘ └─────┘
│ │
└──────── GAP ────────────────┘
(FVG ZONE)
Requirements Met:
✓ Current LOW > 2-bar-ago HIGH (gap exists)
✓ Gap ≥ 30% of ATR (significant)
✓ Bar 1 range ≥ 1.8x average (impulse)
✓ Bar 1 body ≥ 65% of range (conviction)
✓ Bar 1 volume ≥ 2x average (institutional)
✓ Bar 1 was bullish (direction confirms)
RESULT: VALID SNIPER BULLISH ZONE CREATED
```
---
### Single Print Lines Explained
Single Prints mark **institutional impulse candles** where price moved so fast that no orders were filled at those levels. These levels often act as magnets for price.
```
SINGLE PRINT CANDLE:
════════════════════
HIGH ═══════════════════════════════ (Gold Line)
│
┌─────────────────┤
│█████████████████│ ← Large body (65%+)
│█████████████████│ ← Strong volume (2x+)
│█████████████████│ ← Clear delta (60%+)
│█████████████████│
└─────────────────┤
│
LOW ═══════════════════════════════ (Gold Line)
These horizontal lines extend 500 bars into the future.
Price often returns to test these levels.
```
---
### Entry Strategy
#### Zone Entry Checklist
```
□ Zone is active (green/red, not gray)
□ Price enters zone from outside
□ Wait for entry signal (BUY🎯 or SELL🎯)
□ Verify: Delta + Volume confirming
□ Enter at CE line (dotted white line)
□ Stop below/above zone
□ Target: Opposite side of zone (1:1) or 2:1
```
#### Single Print Entry
```
□ Price returns to single print level
□ Look for reaction (rejection candle)
□ Combine with GRA signal if possible
□ Enter on confirmation candle
□ Stop beyond the single print line
```
---
### Table Legend
| Field | Reading | Color Meaning |
|-------|---------|---------------|
| **Delta** | Buy/Sell % | 🟢 Buy dom, 🔴 Sell dom, ⚪ Neutral |
| **Vol** | Volume ratio | 🟢 ≥2x, ⚪ <2x |
| **Buy ⬚** | Active buy zones | Count of bullish zones |
| **Sell ⬚** | Active sell zones | Count of bearish zones |
| **Zone** | Current position | AT BUY / AT SELL / --- |
| **Impulse** | Current bar status | 🟡 Yes (impulse), ⚫ No |
---
### Zone States
| State | Visual | Meaning | Action |
|-------|--------|---------|--------|
| **Fresh** | Bright color | Never tested | Best entries |
| **Tested** | Gray | CE touched | Still valid, less reliable |
| **Broken** | Dark gray | Price closed through | Invalid, ignore |
---
### Integration with GRA v5
The magic happens when you combine both indicators:
```
HIGHEST PROBABILITY SETUP:
══════════════════════════
1. DeepFlow shows active zone (green/red box)
2. Price enters the zone
3. GRA5 fires a signal INSIDE the zone
4. Delta confirms on both indicators
5. Volume confirms on both indicators
This is your SNIPER entry. Take it.
Example:
┌─────────────────────────────────────────┐
│ Price enters BULLISH zone │
│ GRA5 shows: A🎯 LONG │
│ DFZ shows: BUY🎯 │
│ Table: Vol 2.1x, Delta 67%B │
│ │
│ ACTION: Full size LONG at CE │
│ STOP: Below zone bottom │
│ TARGET: 2:1 R:R │
└─────────────────────────────────────────┘
```
---
### Settings by Instrument
| Instrument | Vol Mult | Gap ATR | Impulse | Max Zones |
|------------|----------|---------|---------|-----------|
| **NQ/ES** | 2.0x | 30% | 1.8x | 10 |
| **YM** | 2.0x | 30% | 1.8x | 10 |
| **GC** | 2.5x | 40% | 2.0x | 8 |
| **BTC** | 2.0x | 25% | 1.5x | 10 |
---
### Common Mistakes
| Mistake | Why It's Bad | Solution |
|---------|-------------|----------|
| Trading every zone | Most zones fail | Wait for entry signal |
| Entering at zone edge | Wrong R:R | Enter at CE (middle) |
| Ignoring broken zones | Already invalidated | Gray = don't trade |
| No delta confirmation | Could be false zone | BUY🎯/SELL🎯 required |
| Too many zones | Chart noise | Max 10 zones |
---
### Alert Configuration
| Alert | Priority | Action |
|-------|----------|--------|
| 🎯 BUY/SELL ZONE ENTRY | 🔴 High | Check chart immediately |
| NEW BULL/BEAR ZONE | 🟠 Medium | Note new zone location |
| 🎯 SINGLE PRINT | 🟢 Low | Mark potential S/R |
---
### Pine Script v6 Notes
This indicator uses Pine Script v6 features:
- Array-based zone management
- `request.security_lower_tf()` for delta
- Dynamic zone state tracking
- Efficient garbage collection
**Minimum TradingView Plan:** Pro (for intrabar data)
---
## 🏆 Golden Rules
1. **Fewer zones = Better zones.** If you see more than 5 active zones, your settings are too loose.
2. **Fresh zones > Tested zones.** The first touch is always the best.
3. **CE is king.** The middle of the zone (50% level) is your entry point.
4. **Zone + GRA signal = Sniper entry.** This confluence is what we're hunting for.
5. **Gray zones don't exist.** Once broken, pretend the zone was never there.
---
*© Alexandro Disla - DeepFlow Zones SNIPER*
*Pine Script v6 | TradingView*

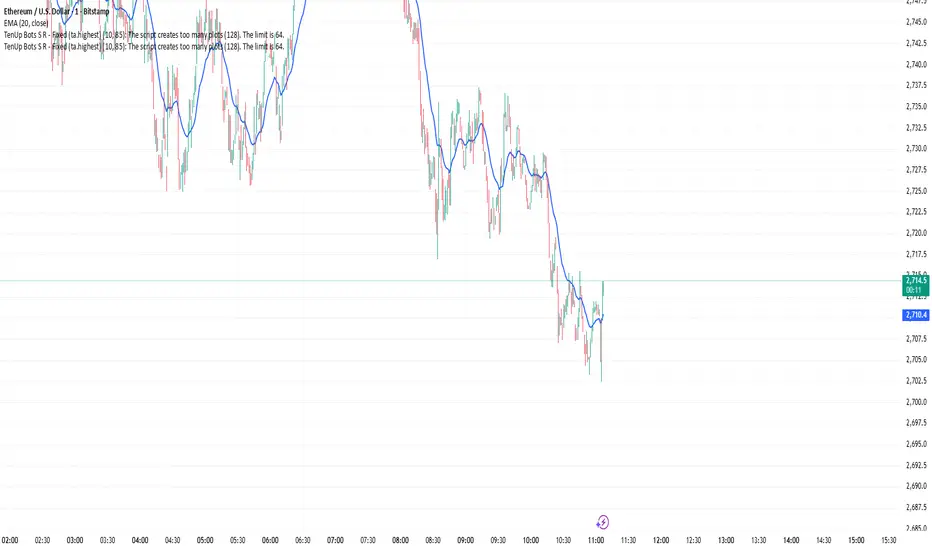
TenUp Bots S R - Fixed (ta.highest)//@version=5
indicator("TenUp Bots S R - Fixed (ta.highest)", overlay = true)
// Inputs
a = input.int(10, "Sensitivity (bars)", minval = 1, maxval = 9999)
d_pct = input.int(85, "Transparency (%)", minval = 0, maxval = 100)
// Convert 0-100% to 0-255 transparency (color.new uses 0..255)
transp = math.round(d_pct * 255 / 100)
// Colors with transparency applied
resColor = color.new(color.red, transp)
supColor = color.new(color.blue, transp)
// Helper (calculations only)
getRes(len) => ta.highest(high, len)
getSup(len) => ta.lowest(low, len)
// === PLOTS (all in global scope) ===
plot(getRes(a*1), title="Resistance 1", color=resColor, linewidth=2)
plot(getSup(a*1), title="Support 1", color=supColor, linewidth=2)
plot(getRes(a*2), title="Resistance 2", color=resColor, linewidth=2)
plot(getSup(a*2), title="Support 2", color=supColor, linewidth=2)
plot(getRes(a*3), title="Resistance 3", color=resColor, linewidth=2)
plot(getSup(a*3), title="Support 3", color=supColor, linewidth=2)
plot(getRes(a*4), title="Resistance 4", color=resColor, linewidth=2)
plot(getSup(a*4), title="Support 4", color=supColor, linewidth=2)
plot(getRes(a*5), title="Resistance 5", color=resColor, linewidth=2)
plot(getSup(a*5), title="Support 5", color=supColor, linewidth=2)
plot(getRes(a*6), title="Resistance 6", color=resColor, linewidth=2)
plot(getSup(a*6), title="Support 6", color=supColor, linewidth=2)
plot(getRes(a*7), title="Resistance 7", color=resColor, linewidth=2)
plot(getSup(a*7), title="Support 7", color=supColor, linewidth=2)
plot(getRes(a*8), title="Resistance 8", color=resColor, linewidth=2)
plot(getSup(a*8), title="Support 8", color=supColor, linewidth=2)
plot(getRes(a*9), title="Resistance 9", color=resColor, linewidth=2)
plot(getSup(a*9), title="Support 9", color=supColor, linewidth=2)
plot(getRes(a*10), title="Resistance 10", color=resColor, linewidth=2)
plot(getSup(a*10), title="Support 10", color=supColor, linewidth=2)
plot(getRes(a*15), title="Resistance 15", color=resColor, linewidth=2)
plot(getSup(a*15), title="Support 15", color=supColor, linewidth=2)
plot(getRes(a*20), title="Resistance 20", color=resColor, linewidth=2)
plot(getSup(a*20), title="Support 20", color=supColor, linewidth=2)
plot(getRes(a*25), title="Resistance 25", color=resColor, linewidth=2)
plot(getSup(a*25), title="Support 25", color=supColor, linewidth=2)
plot(getRes(a*30), title="Resistance 30", color=resColor, linewidth=2)
plot(getSup(a*30), title="Support 30", color=supColor, linewidth=2)
plot(getRes(a*35), title="Resistance 35", color=resColor, linewidth=2)
plot(getSup(a*35), title="Support 35", color=supColor, linewidth=2)
plot(getRes(a*40), title="Resistance 40", color=resColor, linewidth=2)
plot(getSup(a*40), title="Support 40", color=supColor, linewidth=2)
plot(getRes(a*45), title="Resistance 45", color=resColor, linewidth=2)
plot(getSup(a*45), title="Support 45", color=supColor, linewidth=2)
plot(getRes(a*50), title="Resistance 50", color=resColor, linewidth=2)
plot(getSup(a*50), title="Support 50", color=supColor, linewidth=2)
plot(getRes(a*75), title="Resistance 75", color=resColor, linewidth=2)
plot(getSup(a*75), title="Support 75", color=supColor, linewidth=2)
plot(getRes(a*100), title="Resistance 100", color=resColor, linewidth=2)
plot(getSup(a*100), title="Support 100", color=supColor, linewidth=2)
plot(getRes(a*150), title="Resistance 150", color=resColor, linewidth=2)
plot(getSup(a*150), title="Support 150", color=supColor, linewidth=2)
plot(getRes(a*200), title="Resistance 200", color=resColor, linewidth=2)
plot(getSup(a*200), title="Support 200", color=supColor, linewidth=2)
plot(getRes(a*250), title="Resistance 250", color=resColor, linewidth=2)
plot(getSup(a*250), title="Support 250", color=supColor, linewidth=2)
plot(getRes(a*300), title="Resistance 300", color=resColor, linewidth=2)
plot(getSup(a*300), title="Support 300", color=supColor, linewidth=2)
plot(getRes(a*350), title="Resistance 350", color=resColor, linewidth=2)
plot(getSup(a*350), title="Support 350", color=supColor, linewidth=2)
plot(getRes(a*400), title="Resistance 400", color=resColor, linewidth=2)
plot(getSup(a*400), title="Support 400", color=supColor, linewidth=2)
plot(getRes(a*450), title="Resistance 450", color=resColor, linewidth=2)
plot(getSup(a*450), title="Support 450", color=supColor, linewidth=2)
plot(getRes(a*500), title="Resistance 500", color=resColor, linewidth=2)
plot(getSup(a*500), title="Support 500", color=supColor, linewidth=2)
plot(getRes(a*750), title="Resistance 750", color=resColor, linewidth=2)
plot(getSup(a*750), title="Support 750", color=supColor, linewidth=2)
plot(getRes(a*1000), title="Resistance 1000", color=resColor, linewidth=2)
plot(getSup(a*1000), title="Support 1000", color=supColor, linewidth=2)
plot(getRes(a*1250), title="Resistance 1250", color=resColor, linewidth=2)
plot(getSup(a*1250), title="Support 1250", color=supColor, linewidth=2)
plot(getRes(a*1500), title="Resistance 1500", color=resColor, linewidth=2)
plot(getSup(a*1500), title="Support 1500", color=supColor, linewidth=2)
Elliott Wave + SMC Fusion # Elliott Wave + SMC Fusion
## TITLE:
Elliott Wave + Smart Money Concepts Fusion
---
## SHORT DESCRIPTION:
Automated Elliott Wave pattern detection with Smart Money Concepts confirmation, EWO oscillator integration, and confluence scoring system.
---
## FULL DESCRIPTION:
### 📊 OVERVIEW
This indicator combines three powerful trading methodologies into a unified system:
- **Elliott Wave Theory** - Automated detection of Wave 1-2 impulse patterns
- **Smart Money Concepts (SMC)** - Order Blocks and Fair Value Gaps for institutional confirmation
- **Elliott Wave Oscillator (EWO)** - Momentum-based signal validation
The core concept is to identify high-probability Wave 3 entries by detecting completed Wave 1-2 structures and validating them with SMC and momentum indicators.
---
### 🔧 HOW IT WORKS
**1. Pattern Detection (ZigZag Method)**
- Uses pivot high/low detection to identify swing points
- Validates Wave 2 retracement using Fibonacci ratios (default: 38.2% - 88.6%)
- Requires minimum wave size to filter noise
- Applies confirmation bars to avoid premature signals
**2. Wave Projections**
- Wave 3 target: Fibonacci extension of Wave 1 (default: 1.618)
- Wave 4 retracement: Percentage of Wave 3 (default: 38.2%)
- Wave 5 projection: Extension of Wave 1 from Wave 4
**3. Smart Money Validation**
- **Order Blocks**: Identifies last opposing candle before breakout (institutional footprint)
- **Fair Value Gaps**: Detects price imbalances for potential support/resistance
**4. EWO Confirmation**
- Calculates momentum: (EMA5 / EMA34 - 1) × 100
- Signal line crossovers confirm trend direction
- Strong signals occur at extremes (< -13 or > 13 threshold)
**5. Confluence Scoring (0-100%)**
Points awarded for:
- Fibonacci quality of Wave 2 retracement (10-30 pts)
- Order Block presence (15 pts)
- Fair Value Gap presence (10 pts)
- Volume confirmation (10-15 pts)
- Trend alignment with EMA50 (10 pts)
- EWO confirmation (10-20 pts)
---
### 🎯 UNIQUE FEATURES
**Pattern Locking System**
- Once a valid pattern is detected, it locks until:
- Pattern invalidates (price breaks Wave 0)
- Pattern completes (Wave 5 reached)
- Auto-timeout (configurable bars)
- Prevents rapid signal flipping and false alerts
**Signal Stability Controls**
- Adjustable cooldown between signals (default: 20 bars)
- Minimum bar distance between wave points
- Direction change requirement option
- Confirmation bars after Wave 2 formation
**Visual Wave Tracking**
- Solid lines for impulse waves (0→1, 2→3, 4→5)
- Dashed lines for corrective waves (1→2, 3→4)
- Numbered labels on each wave point
- Real-time projection lines to targets
**Comprehensive Dashboard**
- Current wave status and lock state
- Pattern grade (A+ to D based on confluence)
- Projected vs actual wave levels (✓ when completed)
- SMC confirmation status
- Risk/Reward ratio calculation
- EWO trend direction
---
### 📈 TRADING APPLICATION
**Entry Strategy**
- Wait for Wave 1-2 pattern detection (diamond signal)
- Check confluence score (>65% = higher probability)
- Verify EWO alignment with pattern direction
- Enter after 30% retracement of Wave 2 (customizable)
**Risk Management**
- Stop Loss: Below Wave 0 (with buffer)
- Take Profit 1: Wave 3 projection
- Take Profit 2: Wave 5 projection
- R:R displayed in dashboard
**Invalidation Rules**
- Price breaks below Wave 0 (bullish) or above (bearish)
- Wave 2 level violated before Wave 3 forms
- Pattern timeout exceeded
---
### ⚙️ KEY SETTINGS
**Elliott Wave**
- ZigZag Length: Pivot detection sensitivity
- Fib Tolerance: Acceptable retracement range
- Min Wave Size: Filter small movements
**Signal Stability**
- Signal Cooldown: Minimum bars between signals
- Lock Pattern Until Invalid: Prevent signal changes
- Confirmation Bars: Wait after Wave 2
**Wave Projection**
- Wave 3/4/5 Fibonacci extensions
- Projection display distance
**EWO Settings**
- Fast/Slow EMA lengths
- Signal smoothing
- Strength threshold
**SMC Settings**
- Order Block lookback period
- FVG minimum size percentage
---
### 🔔 ALERTS
- New bullish/bearish pattern detected
- High confluence setup (>75%)
- Pattern invalidation
- Wave completion
---
### ⚠️ IMPORTANT NOTES
- This indicator identifies **potential** Elliott Wave patterns based on mathematical rules
- Elliott Wave analysis is subjective - patterns may be interpreted differently
- Always combine with other analysis methods and proper risk management
- Past pattern performance does not guarantee future results
- Pattern locking prevents repainting but delays new pattern detection
- Best used on higher timeframes (1H+) for cleaner wave structures
---
### 📚 METHODOLOGY REFERENCES
**Elliott Wave Theory**
- Wave 2 typically retraces 38.2% - 88.6% of Wave 1
- Wave 3 is often the strongest, extending 161.8% of Wave 1
- Wave 4 usually retraces 38.2% of Wave 3
- Wave 5 completes the impulse structure
**Smart Money Concepts**
- Order Blocks represent institutional supply/demand zones
- FVGs indicate price inefficiencies that may act as magnets
**Elliott Wave Oscillator**
- Developed to identify wave momentum
- Crossovers signal potential wave transitions
- Extreme readings often coincide with wave completions
---
### 🎨 VISUAL ELEMENTS
- **Green**: Bullish patterns and projections
- **Red**: Bearish patterns and projections
- **Orange**: Wave projection levels
- **Purple**: Order Block zones
- **Yellow**: Fair Value Gaps
- **Blue**: Entry levels
- **Diamond shapes**: New pattern signals
- **Triangle shapes**: EWO crossover signals
---
### 💡 TIPS FOR BEST RESULTS
1. Use on liquid markets with clear trend behavior
2. Higher timeframes produce more reliable patterns
3. Look for confluence scores above 65%
4. Verify EWO alignment before entry
5. Consider market context (overall trend, key levels)
6. Adjust ZigZag length based on your trading style
7. Increase cooldown period for longer-term signals
---
**Indicator Type**: Overlay
**Markets**: All (Crypto, Forex, Stocks, Commodities)
**Timeframes**: All (1H+ recommended)
**Style**: Pattern Recognition + Momentum + Price Action

EMA Dynamic Crossover Detector with Real-Time Signal TableDescriptionWhat This Indicator Does:This indicator monitors all possible crossovers between four key exponential moving averages (20, 50, 100, and 200 periods) and displays them both visually on the chart and in an organized data table. Unlike standard EMA indicators that only plot the lines, this tool actively detects every crossover event, marks the exact crossover point with a circle, records the precise price level, and maintains a running log of all crossovers during the trading session. It's designed for traders who want comprehensive EMA crossover analysis without manually watching multiple moving average pairs.Key Features:
Four Essential EMAs: Plots 20, 50, 100, and 200-period exponential moving averages with color-coded thin lines for clean chart presentation
Complete Crossover Detection: Monitors all 6 possible EMA pair combinations (20×50, 20×100, 20×200, 50×100, 50×200, 100×200) in both directions
Precise Price Marking: Places colored circles at the exact average price where crossovers occur (not just at candle close)
Real-Time Signal Table: Displays up to 10 most recent crossovers with timestamp, direction, exact price, and signal type
Session Filtering: Only records crossovers during active trading hours (10:00-18:00 Istanbul time) to avoid noise from low-liquidity periods
Automatic Daily Reset: Clears the signal table at the start of each new trading day for fresh analysis
Built-In Alerts: Two alert conditions (bullish and bearish crossovers) that can be configured to send notifications
How It Works:The indicator calculates four exponential moving averages using the standard EMA formula, then continuously monitors for crossover events using Pine Script's ta.crossover() and ta.crossunder() functions:Bullish Crossovers (Green ▲):
When a faster EMA crosses above a slower EMA, indicating potential upward momentum:
20 crosses above 50, 100, or 200
50 crosses above 100 or 200
100 crosses above 200 (Golden Cross when it's the 50×200)
Bearish Crossovers (Red ▼):
When a faster EMA crosses below a slower EMA, indicating potential downward momentum:
20 crosses below 50, 100, or 200
50 crosses below 100 or 200
100 crosses below 200 (Death Cross when it's the 50×200)
Price Calculation:
Instead of marking crossovers at the candle's close price (which might not be where the actual cross occurred), the indicator calculates the average price between the two crossing EMAs, providing a more accurate representation of the crossover point.Signal Table Structure:The table in the top-right corner displays four columns:
Saat (Time): Exact time of crossover in HH:MM format
Yön (Direction): Arrow indicator (▲ green for bullish, ▼ red for bearish)
Fiyat (Price): Calculated average price at the crossover point
Durum (Status): Signal classification ("ALIŞ" for buy signals, "SATIŞ" for sell signals) with color-coded background
The table shows up to 10 most recent crossovers, automatically updating as new signals appear. If no crossovers have occurred during the session within the time filter, it displays "Henüz kesişim yok" (No crossovers yet).EMA Color Coding:
EMA 20 (Aqua/Turquoise): Fastest-reacting, most sensitive to recent price changes
EMA 50 (Green): Short-term trend indicator
EMA 100 (Yellow): Medium-term trend indicator
EMA 200 (Red): Long-term trend baseline, key support/resistance level
How to Use:For Day Traders:
Monitor 20×50 crossovers for quick entry/exit signals within the day
Use the time filter (10:00-18:00) to focus on high-volume trading hours
Check the signal table throughout the session to track momentum shifts
Look for confirmation: if 20 crosses above 50 and price is above EMA 200, bullish bias is stronger
For Swing Traders:
Focus on 50×200 crossovers (Golden Cross/Death Cross) for major trend changes
Use higher timeframes (4H, Daily) for more reliable signals
Wait for price to close above/below the crossover point before entering
Combine with support/resistance levels for better entry timing
For Position Traders:
Monitor 100×200 crossovers on daily/weekly charts for long-term trend changes
Use as confirmation of major market shifts
Don't react to every crossover—wait for sustained movement after the cross
Consider multiple timeframe analysis (if crossovers align on weekly and daily, signal is stronger)
Understanding EMA Hierarchies:The indicator becomes most powerful when you understand EMA relationships:Bullish Hierarchy (Strongest to Weakest):
All EMAs ascending (20 > 50 > 100 > 200): Strong uptrend
20 crosses above 50 while both are above 200: Pullback ending in uptrend
50 crosses above 200 while 20/50 below: Early trend reversal signal
Bearish Hierarchy (Strongest to Weakest):
All EMAs descending (20 < 50 < 100 < 200): Strong downtrend
20 crosses below 50 while both are below 200: Rally ending in downtrend
50 crosses below 200 while 20/50 above: Early trend reversal signal
Trading Strategy Examples:Pullback Entry Strategy:
Identify major trend using EMA 200 (price above = uptrend, below = downtrend)
Wait for pullback (20 crosses below 50 in uptrend, or above 50 in downtrend)
Enter when 20 re-crosses 50 in the trend direction
Place stop below/above the recent swing point
Exit when 20 crosses 50 against the trend again
Golden Cross/Death Cross Strategy:
Wait for 50×200 crossover (appears in the signal table)
Verify: Check if crossover occurs with increasing volume
Entry: Enter in the direction of the cross after a pullback
Stop: Place stop below/above the 200 EMA
Target: Swing high/low or when opposite crossover occurs
Multi-Crossover Confirmation:
Watch for multiple crossovers in the same direction within a short period
Example: 20×50 crossover followed by 20×100 = strengthening momentum
Enter after the second confirmation crossover
More crossovers = stronger signal but also means you're entering later
Time Filter Benefits:The 10:00-18:00 Istanbul time filter prevents recording crossovers during:
Pre-market volatility and gaps
Low-volume overnight sessions (for 24-hour markets)
After-hours erratic movements

Moving Average ProjectionDisplays 2-5 moving averages (solid lines) and projects their future trajectory (dashed lines) based on current trend momentum. This helps you anticipate where key MAs are heading and identify potential future support/resistance levels.
Important: Projections show where MAs would move IF the current trend continues—they're not predictions. Market conditions change, so use projections as planning tools, not trading signals.
General Settings
Number of MAs (2-5) controls how many moving averages display on your chart. Start with 2-3 to avoid clutter. Projection Bars (1-100) determines how far into the future to project—use 10-20 for intraday charts and 20-40 for daily charts. Lookback for Slope (2-100) sets the number of bars used to calculate trend slope, where shorter lookbacks are more responsive and longer ones are smoother. The default of 20 works well for most situations.
Individual MA Settings (MA 1-5)
Each MA has four settings: Length sets the period for the MA (common values are 9, 20, 50, 100, and 200), Type lets you choose between SMA, EMA, WMA, HMA, VWMA, or RMA (EMA is most popular), Color sets the historical MA line color, and Projection Color sets the projected line color (usually a lighter or transparent version of the main color).
MA Types Quick Reference: EMA is most popular and responsive to recent prices. SMA gives equal weight to all periods and is the smoothest. HMA is very responsive with low lag. VWMA incorporates volume data.
Quick Setup Examples
Day Trading: 3 MAs (9/21/50 EMA), 10-15 projection bars, 10-15 lookback
Swing Trading: 2 MAs (50/200 EMA), 20-30 projection bars, 20 lookback
Scalping: 2 MAs (9/20 EMA), 5-10 projection bars, 5-10 lookback
How to Use
Trend Identification: An uptrend shows price above rising MAs with projections pointing up. A downtrend shows price below falling MAs with projections pointing down. Consolidation appears as flat MAs with horizontal projections.
Support & Resistance: Rising MA projections act as future dynamic support levels, while falling MA projections act as future dynamic resistance levels.
Anticipating Changes: Watch for projected MA crossovers before they happen. When projections converge, expect volatility or consolidation. Steep projections suggest unsustainable trends, so be cautious. Flat projections indicate ranging markets.
Trade Planning: Check the current trend using MA alignment, then look at projections to gauge trend continuation likelihood. Use projected MA levels for potential targets or stop placement.
Important Tips
When Projections Work Best: Projections are most reliable in stable trending markets with consistent momentum, low volatility environments, and away from major news events.
When to Be Cautious: Use caution during high volatility or choppy price action, around major economic releases, when projections show extreme or parabolic angles, and during trend transitions.
Combine With Other Analysis: Don't trade projections alone. Use them alongside price action, volume, support and resistance levels, and other indicators for confirmation.
Best Practices
Start with 2-3 MAs to avoid chart clutter. Match your projection and lookback bars to your trading timeframe. Use consistent color schemes for quick interpretation. Adjust settings as market conditions change. Always use proper risk management—projections are planning tools, not guarantees.
Troubleshooting
Projections not showing: Check that Projection Bars > 0 and you're viewing the most recent bar
Chart too cluttered: Reduce number of MAs or increase projection color transparency
Projections too volatile: Increase lookback bars or switch to EMA/SMA from HMA
Can't see certain MAs: Verify "Number of MAs" setting includes them (MA 3 won't show if set to 2)

ADX Color Change by BehemothI find this tool to be the most valuable and accurate entry point indicator along with moving averages and the VWAP.
ADX Color Indicator - Controls & Intraday Trading Benefits
Indicator Controls:
1. ADX Length (default: 14)
- Controls the calculation period for ADX
- Lower values (7-10) = more sensitive, faster signals (better for scalping)
- Higher values (14-20) = smoother, fewer false signals (better for swing trades)
- *Intraday tip:* Try 10-14 for most intraday timeframes
2. Show Threshold Levels (default: On)
- Displays the 20 and 25 horizontal lines
- Helps you quickly identify when ADX crosses key strength levels
3. Use Custom Timeframe (default: Off)
- Allows viewing higher timeframe ADX on lower timeframe charts
- *Example:* Trade on 5-min chart but see 15-min or 1-hour ADX
4. Custom Timeframe
- Select any timeframe: 1m, 5m, 15m, 30m, 1H, 4H, D, etc.
- *Intraday tip:* Use 15m or 1H ADX on 5m charts for better trend context
5. Show +DI and -DI (default: Off)
- Shows directional movement indicators
- Green line (+DI) > Red line (-DI) = bullish trend
- Red line (-DI) > Green line (+DI) = bearish trend
6. Show Background Zon es (default: Off)
- Visual background colors for quick trend strength identification
- Green = strong trend (ADX > 25)
- Yellow = moderate trend (ADX 20-25)
Intraday Trading Benefits:
1. Avoid Choppy Markets
- When ADX < 20 (no background color), market is ranging
- Reduces false breakout trades and whipsaws
- Save time and capital by stepping aside during low-quality setups
2. Identify High-Probability Trend Trades
- **Green line + Green zone** = strong trend building, look for pullback entries
- Yellow line crossing above 20 = early trend formation signal
- Catch trends early when ADX starts rising from below 20
3. Multi-Timeframe Analysis
- Use custom timeframe to align with higher timeframe trends
- *Example:* If 1H ADX shows green (strong trend), take breakout trades on 5m chart in same direction
- Increases win rate by trading with the bigger picture
4. Exit Signals
- When ADX turns red (falling), trend is weakening
- Consider tightening stops or taking profits
- Avoid entering new positions when ADX is declining
5. Quick Visual Confirmation
- Color coding eliminates need to analyze numbers
- Instant recognition: Green = go, Yellow = caution, Red = trend dying
- Faster decision-making during fast market moves
6. Scalping Strategy
- Set ADX length to 7-10 for sensitive signals
- Only scalp when ADX is rising (blue, yellow, or green)
- Exit when ADX turns red
7. Breakout Confirmation
- Wait for ADX to rise above 20 after a breakout
- Filters false breakouts in ranging markets
- Yellow or green color confirms momentum behind the move
Optimal Intraday Settings:
- Day Trading (5-15 min charts):** ADX Length = 10-14
- Scalping (1-5 min charts):** ADX Length = 7-10, watch custom 15m timeframe
- Swing Intraday (30min-1H charts):** ADX Length = 14-20
Simple Trading Rules:
✅ Trade: ADX rising + above 20 (yellow or green)
⚠️ Caution: ADX flat or just crossed 20
❌ Avoid:*ADX falling (red) or below 20
The key advantage is staying out of low-quality, choppy price action which is where most intraday traders lose money!

v2.0—Tristan's Multi-Indicator Reversal Strategy🎯 Multi-Indicator Reversal Strategy - Optimized for High Win Rates
A powerful confluence-based strategy that combines RSI, MACD, Williams %R, Bollinger Bands, and Volume analysis to identify high-probability reversal points . Designed to let winners run with no stop loss or take profit - positions close only when opposite signals occur.
Also, the 3 hour timeframe works VERY well—just a lot less trades.
📈 Proven Performance
This strategy has been backtested and optimized on multiple blue-chip stocks with 80-90%+ win rates on 1-hour timeframes from Aug 2025 through Oct 2025:
✅ V (Visa) - Payment processor
✅ MSFT (Microsoft) - Large-cap tech
✅ WMT (Walmart) - Retail leader
✅ IWM (Russell 2000 ETF) - Small-cap index
✅ NOW (ServiceNow) - Enterprise software
✅ WM (Waste Management) - Industrial services
These stocks tend to mean-revert at extremes, making them ideal candidates for this reversal-based approach. I only list these as a way to show you the performance of the script. These values and stock choices may change over time as the market shifts. Keep testing!
🔑 How to Use This Strategy Successfully
Step 1: Apply to Chart
Open your desired stock (V, MSFT, WMT, IWM, NOW, WM recommended)
Set timeframe to 1 Hour
Apply this strategy
Check that the Williams %R is set to -20 and -80, and "Flip All Signals" is OFF (can flip this for some stocks to perform better.)
Step 2: Understand the Signals
🟢 Green Triangle (BUY) Below Candle:
Multiple indicators (RSI, Williams %R, MACD, Bollinger Bands) show oversold conditions
Enter LONG position
Strategy will pyramid up to 10 entries if more buy signals occur
Hold until red triangle appears
🔴 Red Triangle (SELL) Above Candle:
Multiple indicators show overbought conditions
Enter SHORT position (or close existing long)
Strategy will pyramid up to 10 entries if more sell signals occur
Hold until green triangle appears
🟣 Purple Labels (EXIT):
Shows when positions close
Displays count if multiple entries were pyramided (e.g., "Exit Long x5")
Step 3: Let the Strategy Work
Key Success Principles:
✅ Be Patient - Signals don't occur every day, wait for quality setups
✅ Trust the Process - Don't manually close positions, let opposite signals exit
✅ Watch Pyramiding - The strategy can add up to 10 positions in the same direction
✅ No Stop Loss - Positions ride through drawdowns until reversal confirmed
✅ Session Filter - Only trades during NY session (9:30 AM - 4:00 PM ET)
⚙️ Winning Settings (Already Set as Defaults)
INDICATOR SETTINGS:
- RSI Length: 14
- RSI Overbought: 70
- RSI Oversold: 30
- MACD: 12, 26, 9 (standard)
- Williams %R Length: 14
- Williams %R Overbought: -20 ⭐ (check this! And adjust to your liking)
- Williams %R Oversold: -80 ⭐ (check this! And adjust to your liking)
- Bollinger Bands: 20, 2.0
- Volume MA: 20 periods
- Volume Multiplier: 1.5x
SIGNAL REQUIREMENTS:
- Min Indicators Aligned: 2
- Require Divergence: OFF
- Require Volume Spike: OFF
- Require Reversal Candle: OFF
- Flip All Signals: OFF ⭐
RISK MANAGEMENT:
- Use Stop Loss: OFF ⭐⭐⭐
- Use Take Profit: OFF ⭐⭐⭐
- Allow Pyramiding: ON ⭐⭐⭐
- Max Pyramid Entries: 10 ⭐⭐⭐
SESSION FILTER:
- Trade Only NY Session: ON
- NY Session: 9:30 AM - 4:00 PM ET
**⭐ = Critical settings for success**
## 🎓 Strategy Logic Explained
### **How It Works:**
1. **Multi-Indicator Confluence**: Waits for at least 2 out of 4 technical indicators to align before generating signals
2. **Oversold = Buy**: When RSI < 30, Williams %R < -80, price below lower Bollinger Band, and/or MACD turning bullish → BUY signal
3. **Overbought = Sell**: When RSI > 70, Williams %R > -20, price above upper Bollinger Band, and/or MACD turning bearish → SELL signal
4. **Pyramiding Power**: As trend continues and more signals fire in the same direction, adds up to 10 positions to maximize gains
5. **Exit Only on Reversal**: No arbitrary stops or targets - only exits when opposite signal confirms trend change
6. **Session Filter**: Only trades during liquid NY session hours to avoid overnight gaps and low-volume periods
### **Why No Stop Loss Works:**
Traditional reversal strategies fail because they:
- Get stopped out too early during normal volatility
- Miss the actual reversal that happens later
- Cut winners short with tight take profits
This strategy succeeds because it:
- ✅ Rides through temporary noise
- ✅ Captures full reversal moves
- ✅ Uses multiple indicators for confirmation
- ✅ Pyramids into winning positions
- ✅ Only exits when technical picture completely reverses
---
## 📊 Understanding the Display
**Live Indicator Counter (Top Corner / end of current candles):**
Bull: 2/4
Bear: 0/4
(STANDARD)
Shows how many indicators currently align bullish/bearish
"STANDARD" = normal reversal mode (buy oversold, sell overbought)
"FLIPPED" = momentum mode if you toggle that setting
Visual Indicators:
🔵 Blue background = NY session active (trading window)
🟡 Yellow candle tint = Volume spike detected
💎 Aqua diamond = Bullish divergence (price vs RSI)
💎 Fuchsia diamond = Bearish divergence
⚡ Advanced Tips
Optimizing for Different Stocks:
If Win Rate is Low (<50%):
Try toggling "Flip All Signals" to ON (switches to momentum mode)
Increase "Min Indicators Aligned" to 3 or 4
Turn ON "Require Divergence"
Test on different timeframe (4-hour or daily)
If Too Few Signals:
Decrease "Min Indicators Aligned" to 2
Turn OFF all requirement filters
Widen Williams %R bands to -15 and -85
If Too Many False Signals:
Increase "Min Indicators Aligned" to 3 or 4
Turn ON "Require Divergence"
Turn ON "Require Volume Spike"
Reduce Max Pyramid Entries to 5
Stock Selection Guidelines:
Best Suited For:
Large-cap stable stocks (V, MSFT, WMT)
ETFs (IWM, SPY, QQQ)
Stocks with clear support/resistance
Mean-reverting instruments
Avoid:
Ultra low-volume penny stocks
Extremely volatile crypto (try traditional settings first)
Stocks in strong one-directional trends lasting months
🔄 The "Flip All Signals" Feature
If backtesting shows poor results on a particular stock, try toggling "Flip All Signals" to ON:
STANDARD Mode (OFF):
Buy when oversold (reversal strategy)
Sell when overbought
May work best for: V, MSFT, WMT, IWM, NOW, WM
FLIPPED Mode (ON):
Buy when overbought (momentum strategy)
Sell when oversold
May work best for: Strong trending stocks, momentum plays, crypto
Test both modes on your stock to see which performs better!
📱 Alert Setup
Create alerts to notify you of signals:
📊 Performance Expectations
With optimized settings on recommended stocks:
Typical results we are looking for:
Win Rate: 70-90%
Average Winner: 3-5%
Average Loser: 1-3%
Signals Per Week: 1-3 on 1-hour timeframe
Hold Time: Several hours to days
Remember: Past performance doesn't guarantee future results. Always use proper risk management.

Fib OscillatorWhat is Fib Oscillator and How to Use it?
🔶 1. Conceptual Overview
The Fib Oscillator is a Fibonacci-based relative position oscillator.
Instead of measuring momentum (like RSI or MACD), it measures where price currently sits between the recent swing high and swing low, expressed as a percentage within the Fibonacci range.
In other words:
It answers: “Where is price right now within its most recent dynamic range?”
It visualizes retracement and extension zones numerically, providing continuous feedback between 0% and 100% (and beyond if extended).
🔶 2. What the Script Does
The indicator:
Automatically detects recent high and low levels using an adaptive lookback window, which depends on ATR volatility.
Calculates the current price’s position between those levels as a percentage (0–100).
Plots that percentage as an oscillator — showing visually whether price is near the top, middle, or bottom of its recent range.
Overlays Fibonacci retracement levels (23.6%, 38.2%, 50%, 61.8%, 78.6%) as reference zones.
Generates alerts when the oscillator crosses key Fib thresholds — which can signal retracement completion, breakout potential, or pullback exhaustion.
🔶 3. Technical Flow Breakdown
(a) Inputs
Input Description Default Notes
atrLength ATR period used for volatility estimation 14 Used to dynamically tune lookback sensitivity
minLookback Minimum lookback window (candles) 20 Ensures stability even in low volatility
maxLookback Maximum lookback window 100 Limits over-expansion during high volatility
isInverse Inverts chart orientation false Useful for inverse markets (e.g. shorts or inverse BTC view)
(b) Volatility-Adaptive Lookback
Instead of using a fixed lookback, it calculates:
lookback
=
SMA(ATR,10)
/
SMA(Close,10)
×
500
lookback=SMA(ATR,10)/SMA(Close,10)×500
Then it clamps this between minLookback and maxLookback.
This makes the oscillator:
More reactive during high volatility (shorter lookback)
More stable during calm markets (longer lookback)
Essentially, it self-adjusts to market rhythm — you don’t have to constantly tweak lookback manually.
(c) High-Low Reference Points
It takes the highest and lowest points within the dynamic lookback window.
If isInverse = true, it flips the candle logic (useful if viewing inverse instruments like stablecoin pairs or when analyzing bearish setups invertedly).
(d) Oscillator Core
The main oscillator line:
osc
=
(
close
−
low
)
(
high
−
low
)
×
100
osc=
(high−low)
(close−low)
×100
0% = Price is at the lookback low.
100% = Price is at the lookback high.
50% = Midpoint (balanced).
Between Fibonacci percentages (23.6%, 38.2%, 61.8%, etc.), the oscillator indicates retracement stages.
(e) Fibonacci Levels as Reference
It overlays horizontal reference lines at:
0%, 23.6%, 38.2%, 50%, 61.8%, 78.6%, 100%
These act as support/resistance bands in oscillator space.
You can read it similar to how traders use Fibonacci retracements on charts, but compressed into a single line oscillator.
(f) Alerts
The script includes built-in alert conditions for crossovers at each major Fibonacci level.
You can set TradingView alerts such as:
“Oscillator crossed above 61.8%” → possible bullish continuation or breakout.
“Oscillator crossed below 38.2%” → possible pullback or correction starting.
This allows automated monitoring of fib retracement completions without manually drawing fib levels.
🔶 4. How to Use It
🔸 Visual Interpretation
Oscillator Value Zone Market Context
0–23.6% Deep Retracement Potential exhaustion of a down-move / early reversal
23.6–38.2% Shallow retracement zone Possible continuation phase
38.2–50% Mid retracement Neutral or indecisive structure
50–61.8% Key pivot region Common trend resumption zone
61.8–78.6% Late retracement Often “last pullback” area
78.6–100% Near high range Possible overextension / profit-taking
>100% Range breakout New leg formation / expansion
🔸 Practical Application Steps
Load the indicator on your chart (set overlay = false, so it’s below the main price chart).
Observe oscillator position relative to fib bands:
Use it to determine retracement depth.
Combine with structure tools:
Trend lines, swing points, or HTF market structure.
Use crossovers for timing:
Crossing above 61.8% in an uptrend often confirms breakout continuation.
Crossing below 38.2% in a downtrend signals renewed downside momentum.
For range markets, oscillator swings between 23.6% and 78.6% can define accumulation/distribution boundaries.
🔶 5. When to Use It
During Retracements: To gauge how deep the pullback has gone.
During Range Markets: To identify relative overbought/oversold positions.
Before Breakouts: Crossovers of 61.8% or 78.6% often precede impulsive moves.
In Multi-Timeframe Contexts:
LTF (15M–1H): Detect intraday retracement exhaustion.
HTF (4H–1D): Confirm major range expansions or key reversal zones.
🔶 6. Ideal Companion Indicators
The Fib Oscillator works best when contextualized with structure, volatility, and trend bias indicators.
Below are optimal pairings:
Companion Indicator Purpose Integration Insight
Market Structure MTF Tool Identify active trend direction Use Fib Oscillator only in trend direction for cleaner signals
EMA Ribbon / Supertrend Trend confirmation Align oscillator crossovers with EMA bias
ATR Bands / Volatility Envelope Validate breakout strength If oscillator >78.6% & ATR rising → valid breakout
Volume Oscillator Confirm retracement strength Volume contraction + oscillator under 38.2% → potential reversal
HTF Fib Retracement Tool Combine LTF oscillator with HTF fib confluence Powerful multi-timeframe setups
RSI or Stochastic Measure momentum relative to position RSI divergence while oscillator near 78.6% → exhaustion clue
🔶 7. Understanding the Settings
Setting Function Practical Impact
ATR Period (14) Controls volatility sampling Higher = smoother lookback adaptation
Min Lookback (20) Smallest window allowed Lower = more reactive but noisier
Max Lookback (100) Largest window allowed Higher = smoother but slower to react
Inverse Candle Chart Flips oscillator vertically Useful when analyzing bearish or inverse scenarios (e.g. short-side fib mapping)
Recommended Configs:
For scalping/intraday: ATR 10–14, lookback 20–50
For swing/position trading: ATR 14–21, lookback 50–100
🔶 8. Example Trade Logic (Practical Use)
Scenario: Uptrend on 4H chart
Oscillator drops to below 38.2% → retracement zone
Price consolidates → oscillator stabilizes
Oscillator crosses above 50% → pullback ending
Entry: Long when oscillator crosses above 61.8%
Exit: Near 78.6–100% zone or upon divergence with RSI
For Short Bias (Inverse Setup):
Enable isInverse = true to visually flip the oscillator (so lows become highs).
Use the same thresholds inversely.
🔶 9. Strengths & Limitations
✅ Strengths
Dynamic, self-adapting to volatility
Quantifies Fib retracement as a continuous function
Compact oscillator view (no clutter on chart)
Works well across all timeframes
Compatible with both trending and ranging markets
⚠️ Limitations
Doesn’t define trend direction — must be used with structure filters
Can whipsaw during choppy consolidations
The “lookback auto-adjust” may lag in sudden volatility shifts
Shouldn’t be used standalone for entries without structural confluence
🔶 10. Summary
The “Fib Oscillator” is a dynamic Fibonacci-relative positioning tool that merges retracement theory with adaptive volatility logic.
It gives traders an intuitive, quantified view of where price sits within its recent fib range, allowing anticipation of pullbacks, reversals, or breakout momentum.
Think of it as a "Fibonacci RSI", but instead of momentum strength, it shows positional depth — the vibrational location of price within its natural swing cycle.

Buying Climax + Spring [Darwinian]Buying Climax + Spring Indicator
Overview
Advanced Wyckoff-based indicator that identifies potential market reversals through **Buying Climax** patterns (exhaustion tops) and **Spring** patterns (accumulation bottoms). Designed for traders seeking high-probability reversal signals with strict uptrend validation.
---
Method
🔴 Buying Climax Detection
Identifies exhaustion patterns at market tops using multi-condition analysis:
**Base Buying Climax (Red Triangle)**
- Volume spike > 1.8x average
- Range expansion > 1.8x average
- New 20-bar high reached
- Close finishes in lower 30% of bar range
- **Strict uptrend validation**: Price must be 30%+ above 20-day low
**Enhanced Buying Climax (Maroon Triangle)**
- All Base BC conditions PLUS:
- Gap up from previous high
- Intraday fade (close < open and below midpoint)
- **Higher confidence reversal signal**
🟢 Wyckoff Spring Detection
Identifies accumulation patterns at support levels:
- Price breaks below recent pivot low (false breakdown)
- Close recovers above pivot level (rejection)
- Occurs at trading range low
- Optional volume confirmation (1.5x+ average)
- Limited to 3 attempts per pivot (prevents over-signaling)
✅ Uptrend Validation Filter
**Four-condition composite filter** prevents false signals in sideways/downtrending markets:
1. Close-to-close rise ≥ 5% over lookback period
2. Price structure: Close > MA(10) > MA(20)
3. Swing low significantly below current price
4. **Primary requirement**: Current high ≥ 30% above 20-day low
---
Input Tuning Guide
Buying Climax Settings:
**Volume & Range Thresholds**
- `Volume Spike Threshold`: Default 1.8x
- Lower (1.5x) = More signals, more noise
- Higher (2.0-2.5x) = Fewer but stronger exhaustion signals
- `Range Spike Threshold`: Default 1.8x
- Adjust parallel to volume threshold
- Higher values = extreme volatility required
**Pattern Detection**
- `New High Lookback`: Default 20 bars
- Shorter (10-15) = Recent highs only
- Longer (30-50) = Major breakout detection
- `Close Off High Fraction`: Default 0.3 (30%)
- Lower (0.2) = Stricter rejection requirement
- Higher (0.4-0.5) = Allow weaker intraday fades
- `Gap Threshold`: Default 0.002 (0.2%)
- Increase (0.005-0.01) for stocks with wider spreads
- Decrease (0.001) for tight-spread instruments
- `Confirmation Window`: Default 5 bars
- Shorter (3) = Faster confirmation, more false positives
- Longer (7-10) = Wait for deeper automatic reaction
Uptrend Filter Settings
**Critical for Signal Quality**
- `Minimum Rise from 20-day Low`: Default 0.30 (30%)
- **Most important parameter**
- Lower (0.20-0.25) = More signals in moderate uptrends
- Higher (0.40-0.50) = Only extreme parabolic moves
- `Pole Lookback`: Default 30 bars
- Shorter (20) = Recent momentum focus
- Longer (40-50) = Longer-term trend validation
- `Minimum Rise % for Pole`: Default 0.05 (5%)
- Adjust based on market volatility
- Higher in strong bull markets (7-10%)
Wyckoff Spring Settings
- `Pivot Length`: Default 6 bars
- Shorter (3-4) = More frequent pivots, more signals
- Longer (8-10) = Major support/resistance only
- `Volume Threshold`: Default 1.5x
- Higher (1.8-2.0x) = Stronger conviction required
- Disable volume requirement for low-volume stocks
- `Trading Range Period`: Default 20 bars
- Match to consolidation timeframe being traded
- Shorter (10-15) for intraday patterns
- Longer (30-40) for weekly consolidations
---
Recommended Workflow
1. **Start with defaults** on daily timeframe
2. **Adjust uptrend filter** first (30% rise parameter)
- Too many signals? Increase to 35-40%
- Too few? Decrease to 25%
3. **Fine-tune volume/range multipliers** based on instrument volatility
4. **Enable alerts** for real-time monitoring:
- Base BC → Initial warning
- Enhanced BC → High-priority reversal
- Confirmed BC (AR) → Strong follow-through
- Spring → Accumulation opportunity
---
Alert System
- **Base Buying Climax**: Standard exhaustion pattern detected
- **Enhanced BC (Gap+Fade)**: Higher confidence reversal setup
- **Confirmed BC (AR)**: Automatic reaction validated (price drops below BC midline)
- **Wyckoff Spring**: Accumulation pattern at support
---
Best Practices
- Combine with support/resistance analysis
- Watch for BC clusters (multiple timeframes)
- Spring patterns work best after Buying Climax distribution
- Backtest parameters on your specific instruments
- Higher timeframes (daily/weekly) = higher reliability
---
Technical Notes
- Built with Pine Script v6
- No repainting (signals finalize on bar close)
- Minimal CPU usage (optimized calculations)
- Works on all timeframes and instruments
- Overlay indicator (displays on price chart)
---
*Indicator follows classical Wyckoff methodology with modern volatility filters*
