ka66: Auto-Guppy Multiple Moving Average (GMMA)This implements a Guppy Multiple Moving Average (GMMA) with the following twists, which may be a feature or a bug, depending on your perspective:
For both fast and slow group of MAs, only a starting MA (the fastest in that group) is specified.
For either group, a configurable factor is set, which will be used to calculate subsequent MAs.
Automatically selects colours as gradients within a configurable colour range, clearly differentiating between the short-term and long-term groups of averages.
Use Weighted Moving Average (WMAs) as the averaging mechanism. More on this later.
For example, if in the fast group, we start with MA 3, and a factor of 2, then the 6 MAs in the group will be: 3, 6, 12, 24, 48, 96.
The calculated lookbacks are displayed on a table on the top-right, in case further indicators need to be calculated based on these values.
Use of WMAs : This is an annoyance of the implementation: As I use arrays to store lookback calculations (12 of them, individual variables would be a pani to work with!), getting these back out of the array returns a series rather than a simple value. For some unfathomable reason, PineScript doesn't allow copying/conversion of these into a simple value. To add insult to the injury, a bunch of moving averaging functions (e.g.: ta.ema, ta.hma) only work with simple int lookback values. Go figure. SMAs and WMAs are the two that allow series lookback values, and WMAs are less laggy than SMAs but remain smooth, so WMAs it is!
Cerca negli script per "豪24配债"

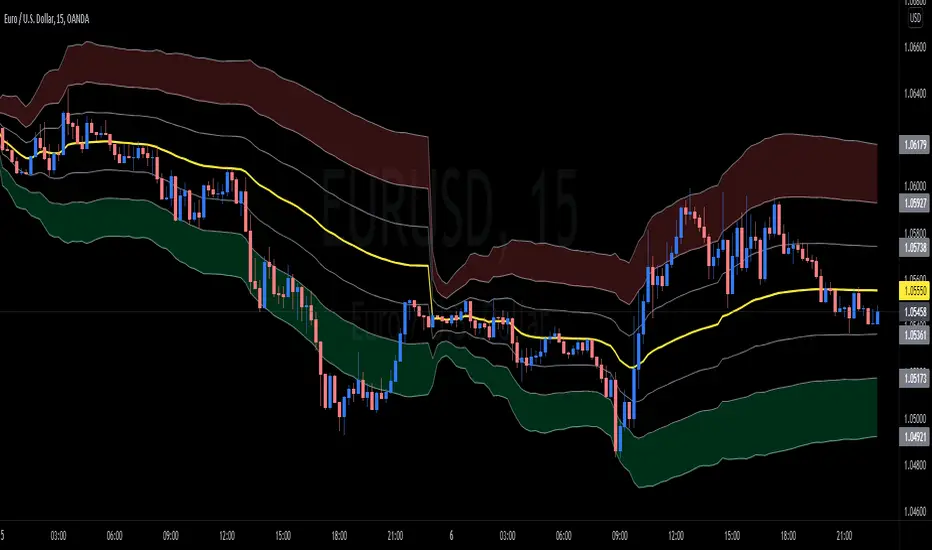
SigmaSpikes Background Highlight [vnhilton]SigmaSpikes is an indicator created by Adam H Grimes. It's a volatility indicator which applies a standard deviation measure on candles for a set period of time, in order to find big candles/moves relative to the other candles. These big moves could be the outcome of setups being traded by market players, large market orders put in by big money players, &/or HFT algorithms reacting to events (usually fundamental events).
These big moves can also be seen as inefficient as it doesn't fit in with the mostly efficient market - this is very similar to gaps of which price would want to fill as they're inefficient, in order to "restore order" to the market.
This indicator attempts to give better information at a glance, by highlighting the background of candles that have sigma spikes over the set standard deviation threshold.
In the chart snapshot image above featuring EURUSD, we can see at 24/06/22 3PM BST, a big move has occurred (highlighted in green showing upward move) leaving an inefficiency area that needs to be filled. The high end of the inefficiency area was reached in the following candle as there was no gap between that candle's open & the previous big candle's close. The low end of the inefficiency area was finally reached almost 4 hours later, at 6:55PM BST.

CRYPTO MARKET SESSION ANALYZER INDICATORCrypto Market Session Analyzer is an easy-to-use yet powerful analysis tool that helps the trader visualize and analyze price movements over three different trading sessions:
1) European Session
2) US session
3) Asian session
Automatically tracks the corresponding levels for each market session.
This indicator can be used on all timeframes equal to or less than 15 minutes.
Although this is a simple indicator to use, some care must be taken when using it. The trader must be careful to set the correct times for each session according to his UTC timezone. By default the indicator uses UTC. If your console is set to UTC + 2 for example, you will need to take this into account and align the times correctly. You can adjust the time for each session from the user interface. Following the example, if the opening of the UE session is set to 9 and UTC of your console is set to UTC + 2, the script will proceed to create the level at opening time 11.
HOW IT WORK
The indicator automatically draws a horizontal line at the open and a horizontal line at the close of each session. The indicator clears past support and resistance every 24 hours to provide a clean and easy-to-read chart, updating new levels session after session.
Blue indicates the EU session.
Orange indicates the US session.
Purple indicates the Asian session.

wnG - VWAP MOD Modified version of VWAP :
Classic VWAP with 6 levels based on the Average True Range to identify the distance and distribution of the prices around the VWAP.
There are 2 calcul methodologies for the bands
- Last 24 Hours Average True Range
- Progressive Average True Range starting from 00:00
As prices tend to move around the VWAP level, favor LONG positions in the GREEN ZONE (and SHORT in the RED ZONE).
How to use it :
Avoid taking long position when price is in the RED ZONE
Avoid taking short position when price is in the GREEN ZONE
==> Adjust the settings depending on your timeframe and asset
rth vwap and midMidpoint and VWAP are often important inflection points in daytrading. I managed to find a script providing me with a 24 hour session midline by NorthStarDayTrading and a RTH VWAP script by LDBC. So I decided to merge those two to get a RTH mid and vwap.

Momentum CloudThis is a modified Ichimoku Cloud:
-The default Lookback-Length and Displacement settings have been modified to operate optimally on 24/7 markets - which is popular among Crypto analysts.
-The Lagging Span, Base Line, and Conversion Line have been removed - leaving just the bare cloud.
-Additionally, the Cloud's color will shift blue when it is compressed. (More specifically - when Leading Span A retreats to Leading Span B, the color changes.)
This allows the user to easily identify when the Cloud is "thinning", either to the upside, or the downside.
Being that the "spread" or "width" of an Ichimoku Cloud generally gauges it's efficacy as potential Support or Resistance, this tool is particularly useful for highlighting when momentum is weakening.
*This script will be updated in the future to allow the user to view the Momentum Cloud of alternate time-frames! (e.g, Viewing the 1D Momentum Cloud on the 1H timeframe)

HighTimeframeTimingLibrary "HighTimeframeTiming"
@description Library for sampling high timeframe (HTF) historical data at an arbitrary number of HTF bars back, using a single security() call.
The data is fixed and does not alter over the course of the HTF bar. It also behaves consistently on historical and elapsed realtime bars.
‼ LIMITATIONS: This library function depends on there being a consistent number of chart timeframe bars within the HTF bar. This is almost always true in 24/7 markets like crypto.
This might not be true if the chart doesn't produce an update when expected, for example because the asset is thinly traded and there is no volume or price update from the feed at that time.
To mitigate this risk, use this function on liquid assets and at chart timeframes high enough to reliably produce updates at least once per bar period.
The consistent ratio of bars might also break down in markets with irregular sessions and hours. I'm not sure if or how one could mitigate this.
Another limitation is that because we're accessing a multiplied number of chart bars, you will run out of chart bars faster than you would HTF bars. This is only a problem if you use a large historical operator.
If you call a function from this library, you should probably reproduce these limitations in your script description.
However, all of this doesn't mean that this function might not still be the best available solution, depending what your needs are.
If a single chart bar is skipped, for example, the calculation will be off by 1 until the next HTF bar opens. This is certainly inconsistent, but potentially still usable.
@function f_offset_synch(float _HTF_X, int _HTF_H, int _openChartBarsIn, bool _updateEarly)
Returns the number of chart bars that you need to go back in order to get a stable HTF value from a given number of HTF bars ago.
@param float _HTF_X is the timeframe multiplier, i.e. how much bigger the selected timeframe is than the chart timeframe. The script shows a way to calculate this using another of my libraries without using up a security() call.
@param int _HTF_H is the historical operator on the HTF, i.e. how many bars back you want to go on the higher timeframe. If omitted, defaults to zero.
@param int _openChartBarsIn is how many chart bars have been opened within the current HTF bar. An example of calculating this is given below.
@param bool _updateEarly defines whether you want to update the value at the closing calculation of the last chart bar in the HTF bar or at the open of the first one.
@returns an integer that you can use as a historical operator to retrieve the value for the appropriate HTF bar.
🙏 Credits: This library is an attempt at a solution of the problems in using HTF data that were laid out by Pinecoders in "security() revisited" -
Thanks are due to the authors of that work for an understanding of HTF issues. In addition, the current script also includes some of its code.
Specifically, this script reuses the main function recommended in "security() revisited", for the purposes of comparison. And it extends that function to access historical data, again just for comparison.
All the rest of the code, and in particular all of the code in the exported function, is my own.
Special thanks to LucF for pointing out the limitations of my approach.
~~~~~~~~~~~~~~~~|
EXPLANATION
~~~~~~~~~~~~~~~~|
Problems with live HTF data: Many problems with using live HTF data from security() have been clearly explained by Pinecoders in "security() revisited"
In short, its behaviour is inconsistent between historical and elapsed realtime bars, and it changes in realtime, which can cause calculations and alerts to misbehave.
Various unsatisfactory solutions are discussed in "security() revisited", and understanding that script is a prerequisite to understanding this library.
PineCoders give their own solution, which is to fix the data by essentially using the previous HTF bar's data. Importantly, that solution is consistent between historical and realtime bars.
This library is an attempt to provide an alternative to that solution.
Problems with historical HTF data: In addition to the problems with live HTF data, there are different issues when trying to access historical HTF data.
Why use historical HTF data? Maybe you want to do custom calculations that involve previous HTF bars. Or to use HTF data in a function that has mutable variables and so can't be done in a security() call.
Most obviously, using the historical operator (in this description, represented using { } because the square brackets don't render) on variables already retrieved from a security() call, e.g. HTF_Close{1}, is not very useful:
it retrieves the value from the previous *chart* bar, not the previous HTF bar.
Using {1} directly in the security() call instead does get data from the previous HTF bar, but it behaves inconsistently, as we shall see.
This library addresses these concerns as well.
Housekeeping: To follow what's going on with the example and comparisons, turn line labels on: Settings > Scales > Indicator Name Label.
The following explanation assumes "close" as the source, but you can change it if you want.
To quickly see the difference between historical and realtime bars, set the HTF to something like 3 minutes on a 15s chart.
The bars at the top of the screen show the status. Historical bars are grey, elapsed realtime bars are red, and the realtime bar is green. A white vertical line shows the open of a HTF bar.
A: This library function f_offset_synch(): When supplied with an input offset of 0, it plots a stable value of the close of the *previous* HTF bar. This value is thus safe to use for calculations and alerts.
For a historical operator of {1}, it gives the close of the *last-but-one* bar. Sounds simple enough. Let's look at the other options to see its advantages.
B: Live HTF data: Represented on the line label as "security(){0}". Note: this is the source that f_offset_synch() samples.
The raw HTF data is very different on historical and realtime bars:
+ On historical bars, it uses a flat value from the end of the previous HTF bar. It updates at the close of the HTF bar.
+ On realtime bars, it varies between and within each chart bar.
There might be occasions where you want to use live data, in full knowledge of its drawbacks described above. For example, to show simple live conditions that are reversible after a chart bar close.
This library transforms live data to get the fixed data, thus giving you access to both live and fixed data with only one security() call.
C: Historical data using security(){H}: To see how this behaves, set the {H} value in the settings to 1 and show options A, B, and C.
+ On historical bars, this option matches option A, this library function, exactly. It behaves just like security(){0} but one HTF bar behind, as you would expect.
+ On realtime bars, this option takes the value of security(){0} at the end of a HTF bar, but it takes it from the previous *chart* bar, and then persists that.
The easiest way to see this inconsistency is on the first realtime bar (marked red at the top of the screen). This option suddenly jumps, even if it's in the middle of a HTF bar.
Contrast this with option A, which is always constant, until it updates, once per HTF bar.
D: PineCoders' original function: To see how this behaves, show options A, B, and D. Set the {H} value in the settings to 0, then 1.
The PineCoders' original function (D) and extended function (E) do not have the same limitations as this library, described in the Limitations section.
This option has all of the same advantages that this library function, option A, does, with the following differences:
+ It cannot access historical data. The {H} setting makes no difference.
+ It always updates at the open of the first chart bar in a new HTF bar.
By contrast, this library function, option A, is configured by default to update at the close of the last chart bar in a HTF bar.
This little frontrunning is only a few seconds but could be significant in trading. E.g. on a 1D HTF with a 4H chart, an alert that involves a HTF change set to trigger ON CLOSE would trigger 4 hours later using this method -
but use exactly the same value. It depends on the market and timeframe as to whether you could actually trade this. E.g. at the very end of a tradfi day your order won't get executed.
This behaviour mimics how security() itself updates, as is easy to see on the chart. If you don't want it, just set in_updateEarly to false. Then it matches option D exactly.
E: PineCoders' function, extended to get history: To see how this behaves, show options A and E. Set the {H} value in the settings to 0, then 1.
I modified the original function to be able to get historical values. In all other respects it is the same.
Apart from not having the option to update earlier, the only disadvantage of this method vs this library function is that it requires one security() call for each historical operator.
For example, if you wanted live data, and fixed data, and fixed data one bar back, you would need 3 security() calls. My library function requires just one.
This is the essential tradeoff: extra complexity and less robustness in certain circumstances (the PineCoders function is simple and universal by comparison) for more flexibility with fewer security() calls.

CDOI ProfileCumulative Delta of Open Interest Profile
This script lets you visualize where there were Open Interest build-ups and discharges on a price basis.
It only supports pairs where TradingView added the appropriate Open Interest data (at the time of posting that is only Binance and Kraken perpetual contracts)
The script uses my own functions to poll lower timeframe data and compile it into a higher timeframe profile. And as such, it needs some tweaking to adjust it to your timeframe until Tradingview lets me do it codewise (hopefully one day)
The instructions for using the Indicators are as follows:
Condition: How often a new profile should be generated
Sampling Rate and 1/Nth of the TF: These have to be calculated together to have a product that should correspond to the current timeframe in minutes. A few examples below
----------- Sampling - 1Nth of the TF
5 min ------- 5 --------------- 1
10 min ------ 10 ------------- 1
15 min ------ 5 --------------- 3
20 min ------ 10 ------------- 2
30 min ------ 10 -------------- 3
45 min ------- 9 -------------- 5
1 hour ------- 10 ------------- 6
4 hours ----- 10 -------------- 24
1 day -------- 10 ------------- 144
Transparency: This one is pretty self-explanatory but only applies to the Profile bars
% change for a bar: This one indicates how precise each bar will be, but if you go too low the script becomes too heavy and stop running
Bar limit: Limits the amounts of bars the script is run for (ae for the last 1000 bars). Lower = faster loading, too high will stop running
UI color: Color and transparency of the center line and the box surrounding the whole profile

CHOPORSI
CHOPORSI is a multiindicator.
This indicator help You to recognize potential in or out singal.
Base singals are from Choppines, RSI, AND DMI indicators.
It is a combination of 3 separate indicators like choppines RSI and DMI.
Then our new indicator see like bellow on next image.
Yellow line is sum of CHOP index and RSI , in this case we can say its a CHOPORSI Index.
Green line is DMI- line , this show us strength of sell position on the market.
We schould use other signals, like LSMA 50/100 to improve trend changing. Like on next picture.
Now how this indicator works?
Yellow line is the sum oF Chop and RSI value - 50.
Max and minimum value of CHOP and RSI are the same from 0 to 100.
We have sum of them.
Our minimum signal is 0+0-50=-50
maximum signal is 100+100-50= 150
Most times if both of tem are on top level ( then we have 150) the trend is chanhing from bullish to bearish.
The same way if the RSI ist on 0 and chop is over 50 ( then we have index 0 ) wee changing the tren from bearish to bullish.
Off course it not every time. We see other signals, to take our risk self not sugested by some art of indicators.
But if we are abowe topline, witch is set to 85 we can sey, we have have oversold signal.
Underline 30 isour potentialy buy signal.
Midrange 50 is mostly trand changin line.
This valu of top, mid bottom line you can change on the setting.
Every Coin have another level of this lines, and need to be checked individual to the coin.
Standard, settings are set fo timeframe : 12 min. 24 min, 1H and 4 H >
Blue crosses signalize possibilities trend changing.
This picture shou us how this indicator works.
Buy long signal : If yellow line is mostly at the bottom and green mostly on the top.
Sell long signal l. Yellow -top , green -bottom.
The Green line is from Directional Movement Index and is - DI line. Its show us selling trend. even higher position then mor sell of .
Standard value of CHOPPINES is 14 , works fin on 1H and abowe also wit the value of 28
Standard value for RSI AND -DI unchanging 14.
I tjink this is a simplu helpfull indycator.
WARNING!!! IF YOU AT THIS POINT CANT UNDERSUD THIS INDICATOR, PLEASE DONT USE THEM .
Signal, schould be confirmed with other indicators like MA, EMA even better with LSMA .
Please try it an make only paper trading, to undertand how its realy works.
Thank You!

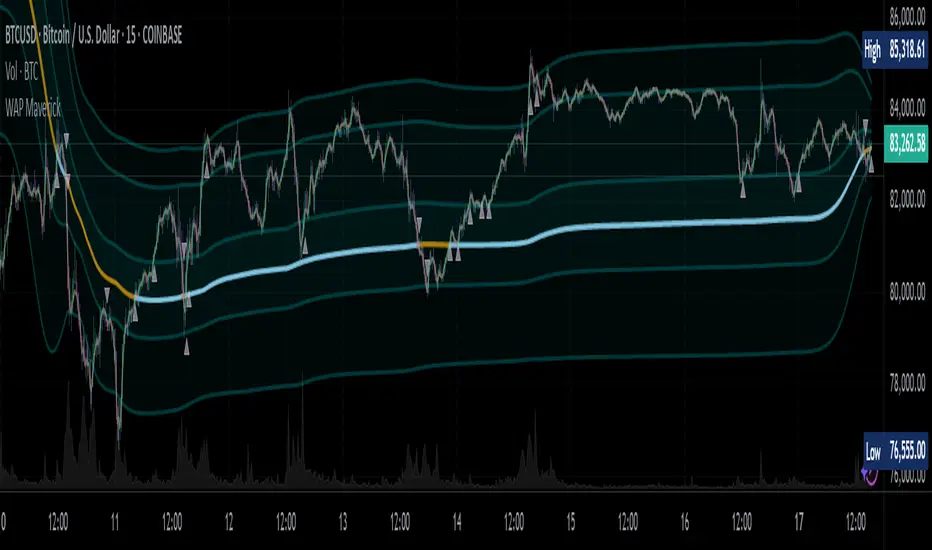
WAP Maverick - (Dual EMA Smoothed VWAP) - [mutantdog]Short Version:
This here is my take on the popular VWAP indicator with several novel features including:
Dual EMA smoothing.
Arithmetic and Harmonic Mean plots.
Custom Anchor feat. Intraday Session Sizes.
2 Pairs of Bands.
Side Input for Connection to other Indicator.
This can be used 'out of the box' as a replacement VWAP, benefitting from smoother transitions and easy-to-use custom alerts.
By design however, this is intended to be a highly customisable alternative with many adjustable parameters and a pseudo-modular input system to connect with another indicator. Well suited for the tweakers around here and those who like to get a little more creative.
I made this primarily for crypto although it should work for other markets. Default settings are best suited to 15m timeframe - the anchor of 1 week is ideal for crypto which often follows a cyclical nature from Monday through Sunday. In 15m, the default ema length of 21 means that the wap comes to match a standard vwap towards the end of Monday. If using higher chart timeframes, i recommend decreasing the ema length to closely match this principle (suggested: for 1h chart, try length = 8; for 4h chart, length = 2 or 3 should suffice).
Note: the use of harmonic mean calculations will cause problems on any data source incorporating both positive and negative values, it may also return unusable results on extremely low-value charts (eg: low-sat coins in /btc pairs).
Long version:
The development of this project was one driven more by experimentation than a specific end-goal, however i have tried to fine-tune everything into a coherent usable end-product. With that in mind then, this walkthrough will follow something of a development chronology as i dissect the various functions.
DUAL-EMA SMOOTHING
At its core this is based upon / adapted from the standard vwap indicator provided by TradingView although I have modified and changed most of it. The first mod is the dual ema smoothing. Rather than simply applying an ema to the output of the standard vwap function, instead i have incorporated the ema in a manner analogous to the way smas are used within a standard vwma. Sticking for now with the arithmetic mean, the basic vwap calculation is simply sum(source * volume) / sum(volume) across the anchored period. In this case i have simply applied an ema to each of the numerator and denominator values resulting in ema(sum(source * volume)) / ema(sum(volume)) with the ema length independent of the anchor. This results in smoother (albeit slower) transitions than the aforementioned post-vwap method. Furthermore in the case when anchor period is equal to current timeframe, the result is a basic volume-weighted ema.
The example below shows a standard vwap (1week anchor) in blue, a 21-ema applied to the vwap in purple and a dual-21-ema smoothed wap in gold. Notably both ema types come to effectively resemble the standard vwap after around 24 hours into the new anchor session but how they behave in the meantime is very different. The dual-ema transitions quite gradually while the post-vwap ema immediately sets about trying to catch up. Incidentally. a similar and slower variation of the dual-ema can be achieved with dual-rma although i have not included it in this indicator, attempted analogues using sma or wma were far less useful however.
STANDARD DEVIATION AND BANDS
With this updated calculation, a corresponding update to the standard deviation is also required. The vwap has its own anchored volume-weighted st.dev but this cannot be used in combination with the ema smoothing so instead it has been recalculated appropriately. There are two pairs of bands with separate multipliers (stepped to 0.1x) and in both cases high and low bands can be activated or deactivated individually. An example usage for this would be to create different upper and lower bands for profit and stoploss targets. Alerts can be set easily for different crossing conditions, more on this later.
Alongside the bands, i have also added the option to shift ('Deviate') the entire indicator up or down according to a multiple of the corrected st.dev value. This has many potential uses, for example if we want to bias our analysis in one direction it may be useful to move the wap in the opposite. Or if the asset is trading within a narrow range and we are waiting on a breakout, we could shift to the desired level and set alerts accordingly. The 'Deviate' parameter applies to the entire indicator including the bands which will remain centred on the main WAP.
CUSTOM (W)ANCHOR
Ever thought about using a vwap with anchor periods smaller than a day? Here you can do just that. I've removed the Earnings/Dividends/Splits options from the basic vwap and added an 'Intraday' option instead. When selected, a custom anchor length can be created as a multiple of minutes (default steps of 60 mins but can input any value from 0 - 1440). While this may not seem at first like a useful feature for anyone except hi-speed scalpers, this actually offers more interesting potential than it appears.
When set to 0 minutes the current timeframe is always used, turning this into the basic volume-weighted ema mentioned earlier. When using other low time frames the anchor can act as a pre-ema filter creating a stepped effect akin to an adaptive MA. Used in combination with the bands, the result is a kind of volume-weighted adaptive exponential bollinger band; if such a thing does not already exist then this is where you create it. Alternatively, by combining two instances you may find potential interesting crosses between an intraday wap and a standard timeframe wap. Below is an example set to intraday with 480 mins, 2x st.dev bands and ema length 21. Included for comparison in purple is a standard 21 ema.
I'm sure there are many potential uses to be found here, so be creative and please share anything you come up with in the comments.
ARITHMETIC AND HARMONIC MEAN CALCULATIONS
The standard vwap uses the arithmetic mean in its calculation. Indeed, most mean calculations tend to be arithmetic: sma being the most widely used example. When volume weighting is involved though this can lead to a slight bias in favour of upward moves over downward. While the effect of this is minor, over longer anchor periods it can become increasingly significant. The harmonic mean, on the other hand, has the opposite effect which results in a value that is always lower than the arithmetic mean. By viewing both arithmetic and harmonic waps together, the extent to which they diverge from each other can be used as a visual reference of how much price has changed during the anchored period.
Furthermore, the harmonic mean may actually be the more appropriate one to use during downtrends or bearish periods, in principle at least. Consider that a short trade is functionally the same as a long trade on the inverse of the pair (eg: selling BTC/USD is the same as buying USD/BTC). With the harmonic mean being an inverse of the arithmetic then, it makes sense to use it instead. To illustrate this below is a snapshot of LUNA/USDT on the left with its inverse 1/(LUNA/USDT) = USDT/LUNA on the right. On both charts is a wap with identical settings, note the resistance on the left and its corresponding support on the right. It should be easy from this to see that the lower harmonic wap on the left corresponds to the upper arithmetic wap on the right. Thus, it would appear that the harmonic mean should be used in a downtrend. In principle, at least...
In reality though, it is not quite so black and white. Rarely are these values exact in their predictions and the sort of range one should allow for inaccuracies will likely be greater than the difference between these two means. Furthermore, the ema smoothing has already introduced some lag and thus additional inaccuracies. Nevertheless, the symmetry warrants its inclusion.
SIDE INPUT & ALERTS
Finally we move on to the pseudo-modular component here. While TradingView allows some interoperability between indicators, it is limited to just one connection. Any attempt to use multiple source inputs will remove this functionality completely. The workaround here is to instead use custom 'string' input menus for additional sources, preserving this function in the sole 'source' input. In this case, since the wap itself is dependant only price and volume, i have repurposed the full 'source' into the second 'side' input. This allows for a separate indicator to interact with this one that can be used for triggering alerts. You could even use another instance of this one (there is a hidden wap:mid plot intended for this use which is the midpoint between both means). Note that deleting a connected indicator may result in the deletion of those connected to it.
Preset alertconditions are available for crossings of the side input above and below the main wap, alongside several customisable alerts with corresponding visual markers based upon selectable conditions. Alerts for band crossings apply only to those that are active and only crossings of the type specified within the 'crosses' subsection of the indicator settings. The included options make it easy to create buy alerts specific to certain bands with sell alerts specific to other bands. The chart below shows two instances with differing anchor periods, both are connected with buy and sell alerts enabled for visible bands.
Okay... So that just about covers it here, i think. As mentioned earlier this is the product of various experiments while i have been learning my way around PineScript. Some of those experiments have been branched off from this in order to not over-clutter it with functions. The pseudo-modular design and the 'side' input are the result of an attempt to create a connective framework across various projects. Even on its own though, this should offer plenty of tweaking potential for anyone who likes to venture away from the usual standards, all the while still retaining its core purpose as a traders tool.
Thanks for checking this out. I look forward to any feedback below.
Range Volume ChangeI was looking for a way to see if today's premarket volume is higher or lower than the previous day's premarket, but did not find any, hence, I made my own which I share with you now.
I call it 'Range Volume Change' or just RVC.
RVC will show the percentage of change between the selected time range and the previous day for the same time range.
This will allow us to see if the volume is increasing or decreasing today compared to the previous day by a specific time range that we set in PVC settings. It can do more than just premarket, you can use it for any time range of your interest which will work on 24hours assets like crypto and forex.
RVC visualizes the incremental of the volume using increasing size columns giving you a better view of how the volume changes compared to the past. The column shows the accumulated volume from when the time range started.
As an extra feature, it will also show the volume percentage of change outside the time range (can be disabled from settings).
In addition, RVC is also designed to work on real-time data.
Example of BTCUSDT (24-hour asset) with volume 'outside the time range', enabled (purple columns):
Follow for more awesome indicators/strategies: www.tradingview.com

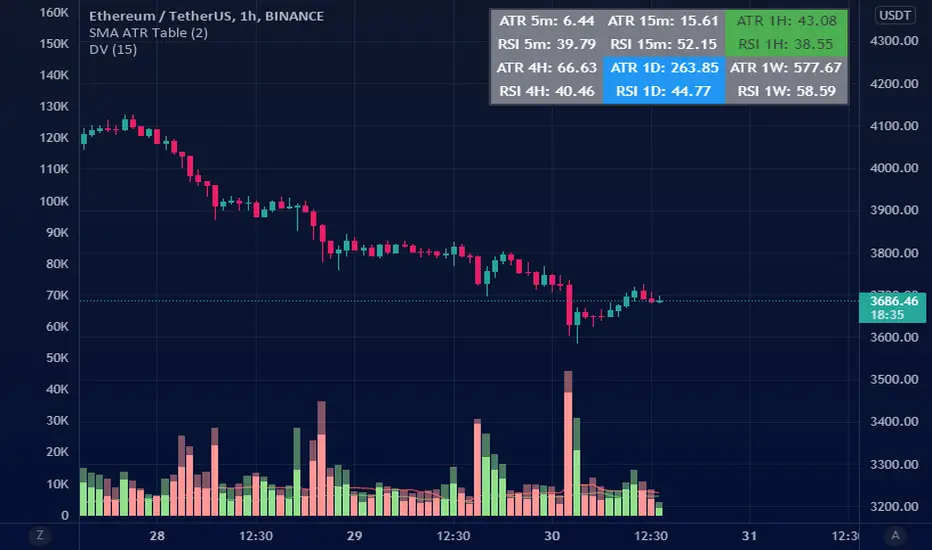
ATR Table (SMA)ATR table for select time frames.
Using Simple Moving Average (SMA) to get ATR.
MA periods is based on numbers suggested by Saeed Khakestar (Trigger Price Action)
You can change them in code
5m => 12
15m => 16
1H => 24
4H => 42
1D => 30
1W => 52
RSI is calculated the same way
SetSessionTimesLibrary "SetSessionTimes"
Function to automatically set session times for symbols and eventually timezone.
Useful mainly for futures contracts, to differentiate between pit and overnight sessions, and for 24 hours symbols if you want to "create" sessions for them
This library only returns correct session times to the calling script and does nothing by itself on the chart. the calling script must then use the returned session times to do anything.
For example, in the attached chart this library is used by my initial balance indicator, which calls it to retrieve the correct session times for the selected symbol in the chart, given that different futures contracts have different pit session times (RTH times) and Tradingview hasn't implemented that yet.
SetSessionTimes()

F&G_IndexIntroduction.
This indicator shows the behavior of Fear and Greed Index (F&G_Index) for the cryptocurrency market in an intuitive way for traders. This indicator has been modified from a script developed by @cptpat called "Fear and Greed Index FGI (Daily Update) alternative.me" (Tradingview user). The Fear and Greed Index values are taken directly from alternative.me.
The novelty of this proposal is to indicate the extreme levels (lower/upper) of the Fear and Greed Index according to a statistical analysis of the historical data. Also its daily update. It is not recommended to use in isolation. The appropriate way is in consensus with other indicators.
The extreme values.
Two upper and lower limits are established that correspond to the first standard deviation (1·SD) and 1.5 standard deviation (1.5·SD), respectively. These limits will help to know different important levels of greed or fear in the market based on real and historical data. The values obtained for each case are shown below, which will mark the extremes. These values may be modified in the future. If so, they will be updated and the community will be informed.
1·SD higher = 69 (F&G_Index).
1·SD lower = 24 (F&G_Index).
1.5·SD higher = 81 (F&G_Index).
1.5·SD lower = 12 (F&G_Index).
These limits are statistically significant and representative of extreme values of the Fear and Greed Index. Above all, for the case of 1.5·SD higher/lower, whose occurrence of the cases are significantly lower. These data are obtained for a daily record from August 2017 to December 2021, for a total of 1407 data. The occurrence of the Fear and Greed Index value exceeding the indicated levels is shown below.
F&G_Index > 1·SD higher (Greed). Occurrence <22,5%
F&G_Index < 1·SD lower (Fear). Occurrence <19%
1·SD lower < F&G_Index < 1·SD higher (Neutral). Occurrence ≈59%
F&G_Index > 1.5·SD higher (Extreme Greed). Occurrence <8%
F&G_Index < 1.5·SD lower (Extreme Fear). Occurrence <3%
How to use the indicator.
Its use is very simple and intuitive and is based on the levels indicated above. The blue line shows the historical value of F&G_Index. When the value of F&G_Index exceeds the levels indicated above, a vertical band of color will be tinted (brown/red, green/lime green or gray with transparency) as indicated below. This allows you to locate important areas in a very visual way.
F&G_Index > 1·SD higher (Greed). Brown color
F&G_Index < 1·SD lower (Fear). Green color.
1·SD lower < F&G_Index < 1·SD higher (Neutral). Gray color with transparency.
F&G_Index > 1.5·SD higher (Extreme Greed). Red color.
F&G_Index < 1.5·SD lower (Extreme Fear). Lime green color.
Image of the indicator.

Koalafied Initial Balance Levels and ExtensionsShows the Initial Balance and range extensions for either the Daily session or individual market sessions (Asia, London, New York).
Initial Balance is the range represented by the first two segments (typically half-hour segments) of a trading session. Range extensions are a function of the longer-term trader participation, pushing price outside of the beginning 'fair' range established by the local traders. With the introduction of 24/7 markets the initial balance is often now regarded as less important than in the past, however re-calculating IB for multiple trading sessions may reinstitute insight to Market Direction and Confidence

40+ Coin Screener (workaround to 40 Security Limit Per Script) This is a far inferior method for a screener/scanner (compared to my first publication) but after looking at that script from a noobs eyes again, I could see how this form would be a lot easier to take in/understand so wanted to publish it. Everything that I could think of to mention about this is in my 1st pub so ill leave it to you to check it out...though I did include some comments in the script. It is pretty straight forward but if you have any questions don't hold them in. I'll answer them if I can. The only thing that is not in this one is setting up the alert feature so that you only have to create 1 alert per iteration of the script and it takes care of all of the coins for that iteration/set that is chosen in the settings (so please see previous script if would like to do this for your screener/scanner).
To be PERFECTLY CLEAR, the workaround is to the issue of not being able to scan but only 40 coins per script. You can scan more than 40 per script but only if you create "batches" or "sets" that the user can select within the settings which set to use for each iteration of the script on the chart. That being, you have to the script multiple times to the chart and merge them into 1 window and merge the scales (instructions in first publications). Here in this script I am scanning 72 different coins that are the Margin Coins on KUCOIN. I have split them up into 3 sets (24 coins per set). I could have made 2 sets but the script will be slower to load and to respond (like, when it comes to receiving alerts), thus I split them up the way I did. If you want to change any of this there are slightly more details in the previous script.
One great use-case that I LOVE about this particular version (and the way I use it) is right at the end of when I see a whole market dump/pump coming to an end and want to know which horse to bet on. Used to think whichever coin come out the fastest from the dump was the one to bet on but quickly learned that 1-2 (or even a few) hrs needs to go by first bc the ones that look the strongest in the beginning are NOT the ones to have performed the best when viewing the results 12 hrs later. IN FACT, many instances of using this exact script for reasons as such has taught me that the manipulators (I believe this to be the case as least) WANT everyone to bet on these that come out the gate the hardest and thus they make them move REALLY hard in the beginning then they QUICKLY become stagnant (moreso, they become WORSE than stagnant, they actually quickly retrace to put you into the negative so that you get out to get into the others now moving (to provide the market with more liquidity. They WANT you to get into a coin thats moving crazy hard so that they can then cease that movement once many fall for the trick just to then make that once strong looking coin now stagnant and make others move crazy hard. They wait for you to get out of the 1st and into the next set of movers just to do this time and time again bc hey, what are we sheep good for other than to provide the big guns with liquidity, am I right? Thats rhetorical, which you would know if you've ever had this happen to you (without a doubt MANY of you have). Let this script (above all other things) provide good evidence to back up this cynical way of viewing the markets to anyone that is questioning it.
This prolonged time between when the dump is over and when the ACTUAL movers REALLY start moving can actually be of great benefit to us sheep if used correctly, Firstly, it gives us some time to determine if when we thought was the bottom, ACTUALLY was the bottom. That bottom is easily determined if there are no (or very few) coins that went any lower than the point in time that the script began calculating on. Secondly, it allows us time to wait for the REAL movers and shakers to start moving and shaking.
One new feature that I LOVE that TV has implemented is the ability (once the script is added to the chart) to be able to click a point in time on the chart where you want the script to begin its calculations. If this point needs to be changed at any point in time then you can either go into the setting and input the time you wish or simply remove the script and add it again so that you are prompted to select another point in time. Ok, I think that everything I wanted to say. The next version that I will add will be probably my favorite and most used by yours truly...not to mention unique in a way that I have yet to see an implementation anything like it in all of TV's public library. Not to say its not there, but I have yet to come across it and I have DEFINITELY done my fair share of searching for it when I couldn't figure out how to code it for the longest time (though, I was and still am a noob so might get some great feedback on better ways to approach it, but we'll save that jabbering for the next of the publications.
I hope each and every one of ya'll (yes, Im from the South) have the GREATEST of Thanksgivings (if in the US that is...I graced my parents with the best gift anyone could have given them 35 years ago on Thanksgiving....MEEEE ;) So I will sure as hell be having a great holiday. Thanks for checking out my script...you can "like" and leave a comment if you so feel the urge to...or not. Im not doing this for me, but rather to stretch my arms out as far as possible to benefit the most people as possible and more people would see the script if it has more likes/comments/traffic pointing towards it...not to mention as other publishers have...it IS gratifying to see a few likes in my side window, which btw, I have MANY more variations and completely diff types of scanners/screeners Ill be publishing in the future and to know that they've become of use....I"VE become of use to the community is very....pleasing to me and does (as I've also seen many publishers mention as well) drive me to want to publish ones that I originally thought I would keep for myself. Peace out people.

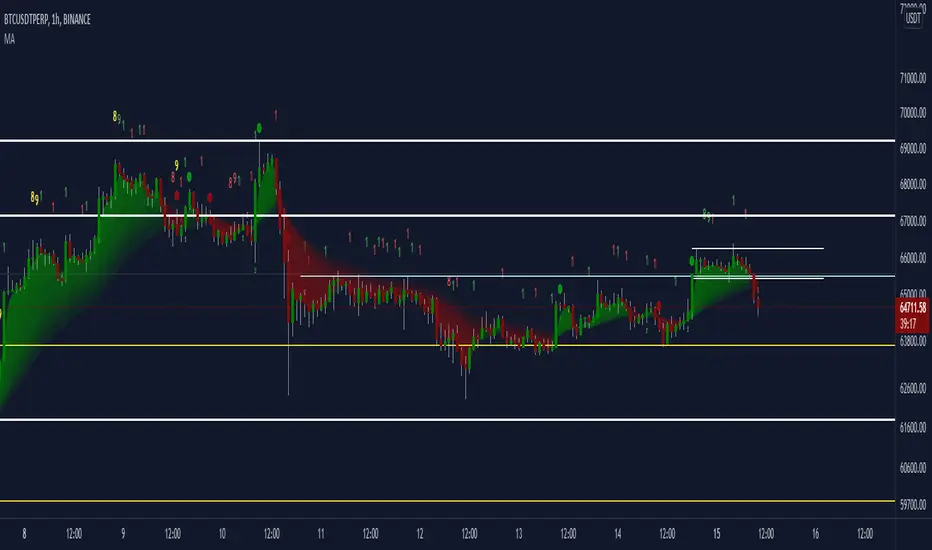
Moving Average Trend█ OVERVIEW
This is a Moving Average Script that contains both a cloud and a ribbon that has independent MA-type selection.
⬆ green arrow up = up trend flip
⬇ red arrow down = down trend flip
🟢 Green Dot = Potential Long
🔴 Red Dot = Potential Short
█ CONCEPTS
1 — Cloud, like most trading algo, the cloud is made of 8 short term MA , with MA cross and MA cross (longema)
2 — Ribbon, this is by default turned off, the default values , an option in setting to change longema to look for ribbon cross
3 — Sequence, It goes from 1 – 9 at 9 the sequence resets. The sequence changes colour depending on if it’s a down trend(red) or uptrend(green) or an over extended trend (yellow)
Setup definitions
Red sell start = current close < the close 4 candles back
Yellow sell extended = current close < last close and current close < two closes back
Green buy start = current close > the close 4 candles back
Yellow buy extended = current close last close and current close < two closes back
This can help you find when it’s time to get out, or sit out of a choppy trend.
4 - Moving Average types:
sma = Simple Moving Average
ema = Exponential Moving Average
wma = Weighted Moving Average
vwma = Volume Weighted Moving Average
rma = Running Moving Average
alma = Arnaud Legoux Moving Average
hma = Hull Moving Average
jma = Jurik Moving Average
frama-o = frama
frama-m = frama mod
dema = Double Exponential Moving Average
tema = Triple Exponential Moving Average
zlema = Zero lag Exponential Moving Average
smma = Smoothed Moving Average
kma = kaufman Moving Average
tma = triangular Moving Average
gmma = Geometric Mean Moving Average
vida = Variable Index Dynamic Average
cma = Corrective Moving average
rema = Range Exponential Moving average
█ OTHER SECTIONS
• FEATURES: to describe the detailed features of the script, usually arranged in the same order as users will find them in the script's inputs.
• HOW TO USE
• LIMITATIONS: Like with any MA script there is a lag factor associated with is.
• RAMBLINGS: Experiment to your hearts content with all the MA types, I'm impartial to HMA as is
• NOTES: some of the MA's are more taxing, therefore take longer to load, be patience, this is a trimmed down version of an existing invite only script i have
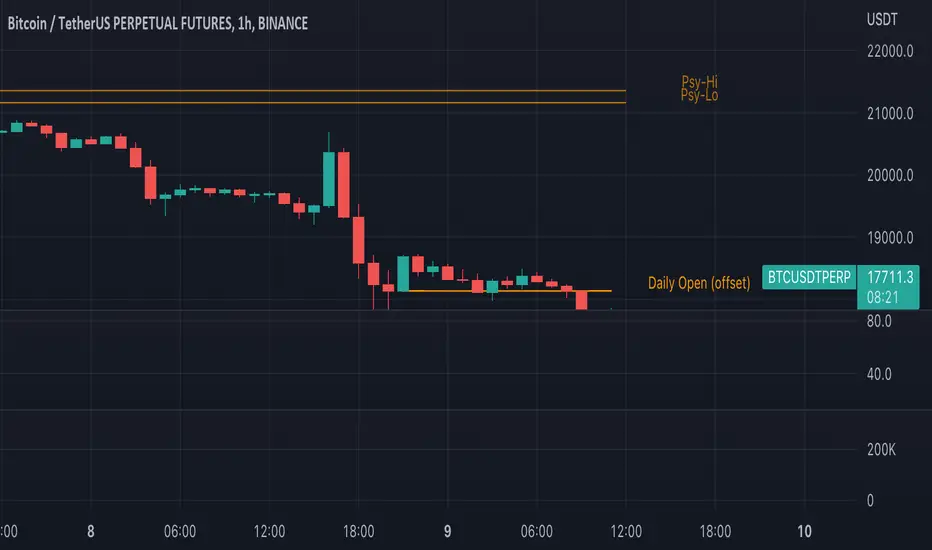
Traders Reality Psy Levels/Daily Open GMT AwareTraders Reality Psy Levels/Daily Open GMT Aware
This indicator serves as the Tradingview equivalent of an MT4 indicator suite (Psy Levels and Daily Open)
Functionality:
In general we define Asia session to start with the Sydney exchange open.
For all intends and purposes for this indicator Asia session is defined as the open of the NZX market and close of the ASX market according to the 24 hour market clock.
The Daily Open is defined as the open of the Asia session.
The Psychological High and Low are defined as the first high and first low the Asian session starting at Saturday night and going into Sunday morning.
These are 2 key confluences that can be used in various strategies. These are in some sense similar to pivot points.
The script is GMT ( UTC ) offset aware meaning you can adjust the start of the day to any point within the allowed GMT offsets (-12 to 14)
For example if your exchange timezone is UTC+0 then the start of the Asia session starts at 2000 (UTC+0) and ends at 0400 (UTC+0) when Sydney if not in DST
You will set the offset to 4. When Sydney is in DST you will set the offset to 3
Naturally since the offset allows the entire range of GMT offsets to be used you do not need to choose the Asia market as the start of the day.
The default setting is set to 4 as of Nov 1st 2021
The GMT offset puts the calculation in the correct place regardless of exchange timezone so you do not need to adjust any settings
when working with exchanges not on UTC+0
Psy levels works only on exchanges that are open on the weekends that provide with 24x7 data.
The GMT offset puts the calculation in the correct place regardless of exchange timezone.
Features:
1) Plot the current Daily Open for timeframes between 4 hour and 1 min.
2) Plot the current weekly Psychological High and Low for timeframes between 4 hour and 1 min.
3) Configurable GMT offset, default set to Sydney open (as defined above)
4) Toggle to show historical Daily Open values (line)
5) Toggle to show historical Psychological High and Low values (line)
6) Turn labels on and off
7) Change line/label colors
Foot notes:
Use at your own risk and your own responsibility. No guarantees are provided and no responsibility is assumed by the developers of this script.
Original @plasmapug, additional edits (with permission) by @infernixx and @Peshocore
INSECURITY() from @JayRogers (enhanced for gmt offset)
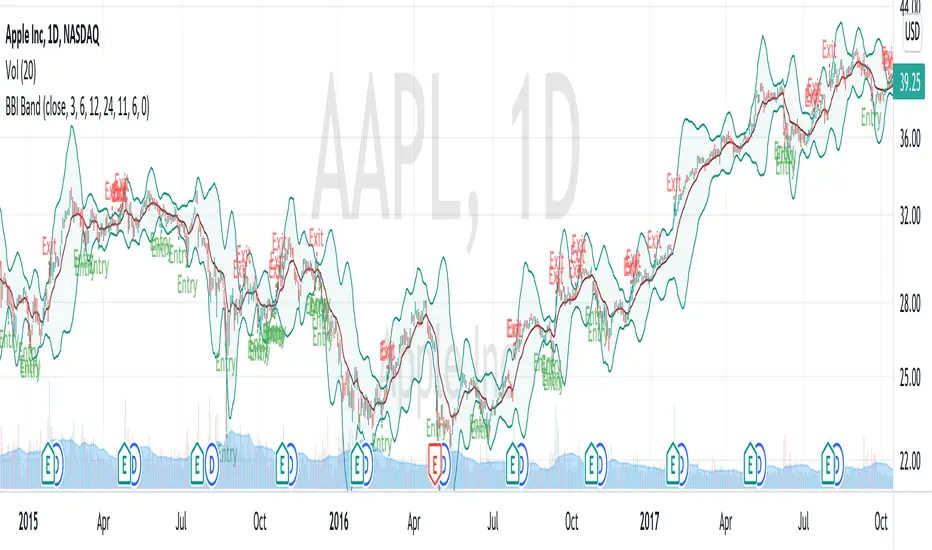
BBI Bollinger BandsBBI (Bull and Bear Index) is an indicator aims on measuring the general short/mid-term (< 1 month) trend and sentiment of the stock/market. It used an average of 4 SMAs (3, 6, 12, 24) as a cut-off of a bullish/bearish trend. In general, YMMV, you can enter when close> BBI and exit when close
Indicators & Conditions Test Framework [DTU]Hello All,
This script is a framework to build strategies by combining indicators and conditions (long, short, exits). You are able to analyze your strategies in realtime by changing the input parameters related to indicators, conditions and their combinations.
OVERVIEW
With this Study/Strategy framework, you will be able to create strategy conditions, display them on the chart, and test them using existing indicators as well as external and custom indicators that you can add.
The main purpose of the Framework is to choose your indicators to be used in the conditions and test your strategy by producing your "Long, short, Exit long, Exit short" combinations.
Although may be, it can be a bit difficult and complicated at first start, but you can understand the logic on its use in a very short time.
Notes:
I removed external links off descriptive images and video to be comply with Trading view violation House Rules
Since I am new in the community and still trying to understand the pine script language I can make errors and violations on my script. Please Inform me on any issue that I made..
HOW TO
STEP 1: SETTINGS ______________________________________________________________________________________________________
SOURCE, TIMEFRAME, SECURITY
Select the Source, timeframe and Secure type that your indicators will use.
Here, the Secure entry consists of 3 parts and the f_security function is used to determine it.
a)Secure
This option is defined as reducing repaint in tradingview calculations as much as possible. The following function is used.
request.security(_symbol, _res, _src , lookahead=barmerge.lookahead_on)
b)Semi Secure
While this option can reduce repaint in tradingview calculations as much as possible, it is less secure. The following function is used.
request.security(_symbol, _res, _src )
c)Repaint
This option turns on the repaint feature. The following function is used.
request.security(_symbol, _res, _src ) : na
Ind Source:
You can the source that indicators will use their own calculations
Ext Source:
You can import external Indicator sources from here . It appears on condition/combination area as "EXT".
To export the External indicator plot it with a title. It will be visible in source dropdown input
PERIOD , ALERTS...
Period:
Determine your strategy testing period by selecting start and end date/time
(!!! According to your tradingview subscription, it takes the last 5000, 10000.. bars.
The extra bar option may cause problems such as not appearing in the calculations or errors).
Plot Alerts:
Plot condition result as alerts arrows on the chart's bottom for "LONG" and the top for "SHORT" entries, exits
Close on opposite:
When selected, a long entry gets closed when a short entry opens and vice versa
Show Profit:
It appears if script is in strategy mode (not in study) this can display current or open profit for better reanalyzing your strategy entry exit points. (Currently under development)
PLOT TYPE OPERATIONS
This option has 4 entries
a) Mult
Sets the multiplier for the selected Plot Type (stochastic, Percentrank, Org Range (-1,1) ) except for "Original" in the range (-1,1).
EXAMPLE: When 1000 is selected, the indicator in the range of (-1,1) will appear in the range of (-1000, 1000) on the screen.
b) Shift
It determines the shift that will appear on the screen for the selected Plot Type (stochastic, Percentrank,Org Range (-1,1) ) in the range (-1,1) other than "Original".
EXAMPLE: When Shift:35000 and mult:1000 are selected, the indicator will appear in the range (34000, 36000) on the screen.
c) Smooth
This option (only for Stochastic & PercentRank) allows to smooth the indicator to be displayed.
Here, tradinview ta.swma function is used.
b) hline
Adjusts the horizontal lines to appear on the screen according to the mult factor for the range (-1,1)
The lines represent the values (-1, -05, 0, 05, 1)
STEP 2: INDICATORS ______________________________________________________________________________________________________
You need to choose indicators that you can use in strategy conditions.
Here, the indicators come from the dturkuler/lib_Indicators_DT open script library defined in the code
In addition, you can add the indicators that you will create in the area defined in the code to this list..
You can also import external indicators and test them with other variables on the system..
You can choose a maximum of 5 indicators that you can use in total. (can be increased in new versions)
Indicators are categorized in 3 main sections
Indicator Selection:
You can select your indicators from this area
a)Moving Averages
These are indicators such as EMA, SMA that you can show on the stock. They come from the library.
These indicators are fed from Settings/source. Only the length value can be used as a parameter.
In addition, line colors can be changed..
As of now, there are 28 indicators in the library in total and 5 indicators are left as future use for this field for now.
b)Other Indicators
These are different indicators from the stock value such as RSI, COG. They come from the library. These indicators are fed from Settings/source.
Only the length value can be used as a parameter. In addition, line colors can be changed.
As of now, there are 24 indicators in the library in total and 5 indicators are left as a future use for this field for now.
c)Custom Indicators
These indicators are the ones you can create by programming yourself in the source code..
The area at the bottom of the settings screen is reserved for the parameters of this type of indicators.
Indicator Length:
You can update your selected indicator length value from here. (Not: it doesn't work for custom indicators since they have their parameter on cust. Ind. input screen )
Indicator Plot Type:
Next to the indicators, there is an input selection field about how they will be displayed on the screen.
a)Original
The indicator is displayed on the screen with its current values. It is an ideal solution for displaying moving average indicators such as (EMA, SMA) over current stock.
Since the values of indicators such as (RSI, COB) are low (-100,100 : -1.1), they appear at the bottom of the screen and make analysis difficult.
For this reason, other options may be more suitable for these.
b)Stochastic
The indicator is displayed on the screen with stochastic calculation in the range of -1.1.
It uses the stochastic(50) calculation method to spread indicators such as (RSI, COB) over the range (-1,1).
Indicators in this selection can be fixed and monitored under stock on the screen with the parameters under the Plot Type section.
You can see the original values of the relevant indicator on the Data Window screen.
(!!! Do not use the values on the chart in your condition calculations. Instead, get the values from Data Window)
c)PercentRank
The indicator is displayed on the screen with stochastic calculation in the range of -1.1. .
Since the values of indicators such as (RSI, COB) are low (-100,100 : -1.1), they appear at the bottom of the screen and make analysis difficult.
Indicators in this selection can be fixed and monitored under stock on the screen with the parameters under the Plot Type section.
You can see the original values of the relevant indicator on the Data Window screen
((!!! Do not use the values on the chart in your condition calculations. Instead, get the values from Data Window)
d)Org Range (-1,1)
If your indicator is in the range of -1.1, your indicator will be displayed on the screen with its original calculation in the range of -1.1.
Indicators in this selection can be fixed and monitored under stock on the screen with the parameters under the Plot Type section.
You can see the original values of the relevant indicator on the Data Window screen.
(!!! Do not use the values on the chart in your fitness calculations. Instead, get the values from Data Window)
STEP 2 NOTES:
STEP 3: CONDITIONS ______________________________________________________________________________________________________
After choosing the indicators you will use in the conditions, you move on to the "CONDITIONS" section.
There are 4 conditions type here.
• LONG ENTRY CONDITION
• SHORT ENTRY CONDITION
• LONG CLOSE CONDITION
• SHORT CLOSE CONDITION
The use of each condition is the same.
There are 3 combinations you can use in each condition. (can be increased in new versions)
a)COMBINATIONS
There are 3 combinations you can use in each condition. (can be increased in new versions)
Each combination are build from 4 parts
1)1st Indicator
If set to "NONE" this combination will not be used on calculations. You can select
IND1-5: from indicators (See above),
EXT: value from externally imported indicator
Stock built-in values: close, open...
2)Operator
Selected Operator compares 1st Indicator with the 2nd one. You can select different operators such as
crossover, crossunder, cross,>,<,=....
3)2nd Indicator
This indicator will be compared with the 1st one via selected Operator. You can select
IND1-5: from indicators (See above),
VALUE: a float value defined in the combinations value parameter
EXT: value from externally imported indicator
Stock builtin values: close,open...
4)Value
When the 2nd indicator field is "VALUE", value area compares the entered value.
ex: 1st indicator="open", op=">", 2nd indicator="VALUE", value=3000.12 means is(close>3000.12)
In other conditions, it compares the previous values of the indicator.
ex: 1st indicator="open", op=">" 2nd indicator is "close" and value is 2 means is(open>close )
EXAMPLES:
indicator 1= "IND1", Operator=">", indicator 2= "IND2" => is(IND1>IND2)
indicator 1= "IND1", Operator=">", indicator 2= "VALUE", "0.1" => is(IND1>0.9)
indicator 1= "IND2", Operator="crossover", indicator 2= "IND1" => is(IND2 crossover IND1) : like a=ta.crossover(IND2, IND1)
indicator 1= "IND1", Operator="<", indicator 2= "close" => is(IND1>close)
indicator 1= "IND1", Operator="<", indicator 2= "EXT" => is(IND1>EXT) , EXT mean external imported indicator that define on settings section
indicator 1= "IND1", Operator="<", indicator 2= "IND1", Value="1" => is (IND1>IND1 )
b)JOIN COMBINATIONS
Each combination in Condition is compared with the next one via JOIN operator
The join operator can be selected as AND or OR.
Examples:
1st combination= is(IND1>0.9) true
2nd combination= is(IND2 crossover IND1) false
1st combination "AND" 2ndcombination" => false (is(IND1>0.9) AND is(IND2 crossover IND1))
1st combination "OR" 2nd combination" => true (is(IND1>0.9) OR is(IND2 crossover IND1))
STEP 3 NOTES:
When the 2nd indicator field is "VALUE", value area compares the entered value. In other conditions, it compares the previous values of the indicator.
In cases where "VALUE" is not selected, integer values must be entered in this field. (float should not be entered. ie 1, 2 should be entered)
!!!If the 1st indicator is "NONE" in the combination, that combination is cancelled.
Each combination returns true/false, allowing the selected value to be compared with another value
Example: EMA(21)>EMA(50) returns true under all conditions or (EMA(21) crossover EMA(50)) returns true when passed.
You can use , Value of 5 indicators (IND1-IND5) or (VALUE) that you have defined in combinations or import indicator (EXT) or stock values (close, open, high...) in your calculations.
combination Compares the 1st indicator with 2nd indicator via the operator.
STEP 4: CUSTOM INDICATORS ______________________________________________________________________________________________________
There is an area in the code for designing Custom Indicators.
Here you can design your own indicators and use them in the framework.
You can also create unlimited parameters for your indicators in the SETTINGS custom indicator field.
For now, only 3 Custom indicators have been defined.
Examples are entered in the code for custom indicators.
STEP 4 NOTES:
Including / updating custom to the code is explained in the source code
• LIMITATIONS:
!!! According to your tradingview subscription, it takes the last 5000, 10000.. bars. More bar options may cause problems such as not appearing in the calculations or errors.
• RAMBLINGS:
• NOTES [ /i]
This Script can be used as an indicator if the last strategy parts in the code are commented out and converted to the initial strategy study.
It was originally prepared for my use with my own strategy framework and has export functions accordingly.
When integrated to my own strategy framework it brings many more features over strategy definition of trades.
• TODO [ /i]
TODO: Add tooltips to the settings screen
TODO: Add double triple, Quatr factor for all indicators (convert any indicator to factor2-4 facotr. ex: EMA to DEMA, TEMA, QEMA...)
TODO: Add factorized Fibo avg range indicator (good for trend definition and entry exit points)
TODO: Add bands to the indicator and conditions
TODO: Add debug window for exporting indicator's parameters
TODO: Add isRising(value) isFalling(value), is...(value) .... to combinations (they can be used as custom indicator also
TODO: Reassess condition entry screen for user friendly GUI
TODO: Increase # conditions from 3 to 4
TODO: Reassess strategy entries, exit and close (should be improved)
TODO: Add Alerts, Condiional alerts for indicator (study) part
TODO: Create export function v3 for Pinecoders Indicator framework
• THANKS:
For Pine script format docs RicardoSantos .
For Pine script coding standards Pinecoders .
For moving average script used on library s RodrigoKazuma .

MAD indicator Enchanced (MADH, inspired by J.Ehlers)This oscillator was inspired by the recent J. Ehler's article (Stocks & Commodities V. 39:11 (24–26): The MAD Indicator, Enhanced by John F. Ehlers). Basically, it shows the difference between two move averages, an "enhancement" made by the author in the last version comes down to replacement SMA to a weighted average that uses Hann windowing. I took the liberty to add colors, ROC line (well, you know, no shorts when ROC's negative and no long's when positive, etc), and optional usage of PVT (price-volume trend) as the source (instead of just price).
[LanZhu] - Bias With DivergenceDescription
Bias is also known as deviation rate which is a technical index derived from the moving average principle. Its function is to measure the deviation degree between the stock price and the moving average line in the process of fluctuation.
Usage
Generally ,
Moving averages of period 6,12,24 and 72 are used in the calculation. Of course, it is adjustable and result in different sensitivity of the deviation rate.
When the stock price is above the moving average, it is positive.
When the stock price is below the moving average, it is negative.
When the stock price is consistent with the moving average, it is zero.
Example,
1. During weak market, we may take when 6-day deviation rate cross both 5 and -5 level to indicate possible overbought and oversold respectively. Reversal or rebound might happen.
2. During strong market, we may take when 6-day deviation rate cross both 8 and -8 level to indicate possible overbought and oversold respectively. Reversal or rebound might happen.
3. When all the bias lines are moving upward and across 0 line, a strong bullish trend might formed and Vice Versa for strong bearish trend
4. Divergence also added to find possible bull or bear reversal on the default bias period which is configurable.

Session/Day VWAP & Std Dev Bands/VWAP and Standard Deviation Bands for intra-day & Day sessions
/Intra-day sessions be default are set to crypto
- Asia session
- London Session
- New York Session
- Close Session
Day broken up into sessions as a 24 hour period consists of different market participants and therefore different behaviour.
