Elipli5648This indicator displays two moving averages on the same chart — the 9-period and 200-period simple moving averages (SMA).
Both lines are customizable in color and line width directly from the settings menu.
Useful for identifying short-term vs long-term trend direction.
Cerca negli script per "采列VS新圣徒"
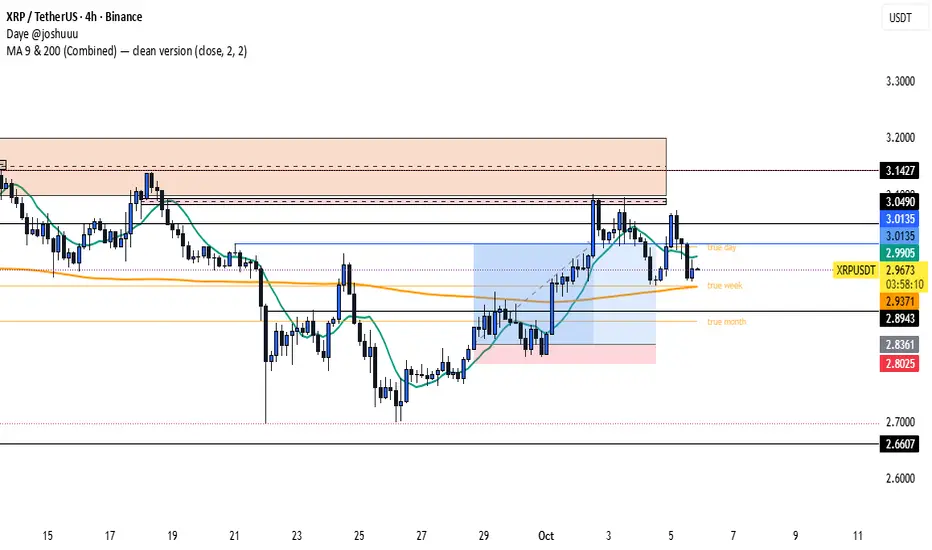
elipli5648 , MA 9 & 200 (Combined) — clean versionThis indicator displays two moving averages on the same chart — the 9-period and 200-period simple moving averages (SMA).
Both lines are customizable in color and line width directly from the settings menu.
Useful for identifying short-term vs long-term trend direction.
Micro SuiteWhat it is: One Pine v5 indicator that stacks several tools: EMA ribbon + a color-flipping 11/34 EMA trend line, multi-timeframe RSI pressure arrows, and a Bollinger Band re-entry system that marks Top/Bottom triggers (T/B) and later “r” confirmations. It also sprinkles in 3-Line Strike, Leledc exhaustion dots, and a small “Micro Dots” engine (ATR regime + VMA filter). Alerts for all of it.
TradingView
The core signals you’ll actually use:
RSI arrows: Up arrow when current RSI(6) < 30 and selected higher-TF RSIs are also < 30; down arrow when > 70 cluster cools. Idea = stacked OB/OS “pressure.”
TradingView
Bollinger re-entry (T/B + r):
T = first close back inside upper band; B = first close back inside lower band.
r = confirmation within N bars (price takes out the trigger bar’s high/low). These bars tint so they’re easy to see.
TradingView
Trend filter: EMA-11 vs EMA-34 color flip + optional VMA trend line; helps you ignore counter-trend stabs.
TradingView
Quick playbook (how to read it):
Reversal short: See a T near the top band → get the r within your window → bonus if a down RSI arrow or a Leledc high dot shows up.
Reversal long: Mirror that with B → r, plus an up RSI arrow/Leledc low dot.
Continuation: If Micro Dot stays green (or red) and 11>34 EMA holds, ignore isolated T/B traps.
TradingView
Inputs that matter:
confirmBars for the T/B “r” window.
Which higher-TF RSIs must agree for arrows.
Show/hide and lengths for EMAs and BB.
Micro block: show dots, VMA line, and speed (Fast/Med/Slow).
TradingView
Why people like it: You get trend, momentum, and mean-revert cues on one pane with ready-made alerts, so it’s easier to build a ruleset (e.g., “only take B→r longs when 11>34 and there’s an RSI up arrow”).
TradingView
Caveats: It’s still just TA—OB/OS clusters can persist in trends; confirmations can miss V-shaped turns; and stacking signals can be late in fast markets. Pair it with risk rules (fixed R, ATR stops) and a higher-TF bias.
One-liner cheat sheet:
Longs: B → r + RSI up arrow + 11>34 (optional Micro Dot green).
Shorts: T → r + RSI down arrow + 11<34 (optional Micro Dot red).
TradingView

4H Sell Signals at Swing Highs/LowsThis shows only zones where a 4H FVG and a 4H OB overlap (i.e., true HPZ).
Uses strict filters (FVG size vs avg body, OB body multiplier) to reduce noise and show very few, high-quality zones.
Each HPZ is drawn once (box deleted/created only when the zone changes) to avoid chart spam.
Optional label appears when price is currently inside the HPZ so you can spot active opportunities quickly.
Microgaps (plots-only, 4-channel, same-day only)Purpose:
This indicator visually highlights 3-bar price gaps on your chart, showing clear visual structure for gap zones without lag or diagonal artifacts.
It draws two outer lines (top and bottom of the gap) for every valid 3-bar gap, and optionally a midline when the gap is considered “large.”
⚙️ How it works
A bull gap is detected when the current bar’s low is higher than the high from two bars ago (low > high ).
A bear gap is detected when the current bar’s high is lower than the low from two bars ago (high < low ).
The lines are centered at the middle bar of the 3-bar sequence.
Gaps are only drawn within the same trading day to avoid false overnight gaps.
To prevent overlapping artifacts, up to four concurrent gap channels can be drawn efficiently using GPU-friendly plot() lines.
🔵 Midline logic
The midline (center of the gap) is only displayed when the gap’s vertical size is “large” relative to recent volatility.
“Large” means the gap height is greater than a user-defined fraction of the average bar range over the past N bars.
Example: if the average 8-bar range = 2 points, and the threshold = 0.3, then only gaps larger than 0.6 points will show the midline.
🧩 Parameters
Setting Description
Bull Gap Color / Width Style of bullish gaps (top and bottom lines).
Bear Gap Color / Width Style of bearish gaps (top and bottom lines).
Mid Gap Color / Width Style of the optional midline (shown only when “large”).
Large Gap — Lookback (bars) Number of bars used to calculate the average range (default: 8).
Large Gap — Size vs Avg Range Fraction of the average range that defines a “large” gap (default: 0.5). Set lower (e.g. 0.3) to show more midlines.
💡 Tips
Set threshold lower (0.2–0.4) for more midlines, higher (0.6–1.0) to highlight only extreme gaps.
Works best on intraday timeframes (1-min to 30-min).
Fully GPU-efficient — can scroll back thousands of bars without lag.

Ichimoku Screener [Pineify]Advanced Multi-Timeframe Ichimoku Screener - Complete Market Analysis Tool
This sophisticated Ichimoku Screener represents a comprehensive approach to multi-timeframe market analysis, combining four distinct Ichimoku-based indicators into a unified screening system. Unlike traditional single-symbol indicators, this screener provides simultaneous analysis across multiple assets and timeframes, enabling traders to identify optimal trading opportunities with enhanced precision and efficiency.
Key Features
Multi-asset screening capability for up to 10 symbols simultaneously
Four customizable timeframes per symbol for comprehensive analysis
Four integrated Ichimoku-based indicators working in harmony
Real-time visual feedback with color-coded signals
Customizable Ichimoku parameters for personalized analysis
Clean, organized table display for easy interpretation
Automated signal strength assessment and timing
How It Works
The screener employs the traditional Ichimoku Kinko Hyo methodology, utilizing five core components: Conversion Line (Tenkan-sen), Base Line (Kijun-sen), Leading Span A (Senkou Span A), Leading Span B (Senkou Span B), and displacement calculations. Each component is mathematically calculated using specific period lengths:
Conversion Line = (Highest High + Lowest Low) / 2 over conversion period
Base Line = (Highest High + Lowest Low) / 2 over base period
Leading Span A = (Conversion Line + Base Line) / 2
Leading Span B = (Highest High + Lowest Low) / 2 over lagging span period
The screener processes these calculations across multiple securities simultaneously using TradingView's security() function, enabling real-time cross-asset analysis. The system tracks state changes using barssince() functions to provide precise timing information for each signal type.
Trading Ideas and Insights
This screener excels in identifying momentum convergence patterns where multiple Ichimoku components align across different timeframes. The most powerful signals occur when:
Cloud color aligns with price position relative to the cloud
Conversion Line crosses above/below Base Line in the same direction as cloud bias
Multiple timeframes show consistent directional bias
Entry signals appear with minimal bars since formation (indicating fresh momentum)
For trend following strategies , focus on symbols where the cloud maintains consistent color across higher timeframes while showing recent entry signals on lower timeframes. For reversal opportunities , identify assets where cloud color changes coincide with price re-entering the cloud after extended periods above or below.
The screener particularly excels in cryptocurrency and forex markets where momentum shifts can be dramatic and sustained. By monitoring multiple timeframes simultaneously, traders can identify when short-term signals align with longer-term trends, significantly improving trade success probability.
How Multiple Indicators Work Together
The four integrated indicators create a comprehensive analytical framework through synergistic interaction:
Ichimoku Cloud (IchiCld) establishes the primary trend bias by comparing Leading Span A with Leading Span B. When Span A > Span B, the cloud displays bullish characteristics; when Span A < Span B, bearish characteristics emerge. The indicator tracks duration since the last cloud color change, providing momentum persistence insight.
Ichimoku Lagging Cloud (IchiLagCld) determines price position relative to the displaced cloud formation. This indicator identifies whether current price action occurs above, below, or within the cloud structure, revealing support/resistance dynamics and trend confirmation signals.
Conversion vs Base (IchiC>Base) monitors the relationship between short-term (Conversion Line) and medium-term (Base Line) momentum. Crossovers in this relationship often precede significant price movements and provide early trend change warnings.
Ichimoku Entry (IchiEnt) synthesizes all components into actionable signals by requiring alignment between cloud bias, price position, and conversion/base relationship. This multi-factor confirmation approach significantly reduces false signals while maintaining sensitivity to genuine momentum shifts.
The mathematical foundation ensures that each indicator contributes unique information while maintaining logical consistency. The system's strength lies in requiring multiple confirmations before generating entry signals, following Ichimoku's original philosophy of comprehensive market analysis.
Unique Aspects
This implementation distinguishes itself through several innovative features:
Advanced State Tracking : Unlike standard Ichimoku indicators that show current values, this screener tracks duration since state changes , providing crucial timing information for signal freshness and momentum strength assessment.
Multi-Asset Efficiency : The screener eliminates the need to manually check multiple charts by presenting comparative analysis across assets and timeframes in a single view, dramatically improving analytical efficiency.
Customizable Visual Feedback : The color-coding system adapts to different signal types and strengths, with recent signals receiving enhanced visual prominence to draw attention to fresh opportunities.
Professional Table Architecture : The organized display accommodates up to 40 symbol-timeframe combinations (10 symbols × 4 timeframes), with intelligent pagination for optimal screen utilization.
Signal Correlation Analysis : By displaying multiple timeframes for each symbol, traders can quickly identify timeframe confluence and divergence patterns that would otherwise require extensive manual analysis.
How to Use
Symbol Configuration : Enter up to 10 symbols in the Symbol input group. Use full exchange:ticker format for optimal compatibility (e.g., "BINANCE:BTCUSDT").
Timeframe Selection : Configure four timeframes in ascending order for logical analysis progression. Recommended combinations include 1m/5m/15m/1h for intraday analysis or 1h/4h/1D/1W for swing trading.
Ichimoku Parameters : Adjust the four core parameters based on your trading style:
Conversion Line Length (default: 9) - Controls short-term momentum sensitivity
Base Line Length (default: 26) - Determines medium-term trend identification
Leading Span B Length (default: 52) - Sets long-term trend calculation period
Displacement (default: 26) - Controls forward projection of cloud structure
Signal Interpretation :
Green backgrounds indicate bullish conditions
Red backgrounds indicate bearish conditions
Numerical values show bars since last state change
"L:" prefix indicates long entry signals
"S:" prefix indicates short entry signals
"N/A" indicates neutral/transitional states
Trading Workflow : Scan for symbols showing consistent signals across multiple timeframes, prioritize fresh signals (low bar counts), and use individual charts for precise entry timing and risk management.
Customization
The screener accommodates various trading approaches through parameter adjustment:
Scalping Configuration : Use shorter periods (Conversion: 5, Base: 13, Span B: 26) with 1m/3m/5m/15m timeframes for high-frequency opportunities.
Swing Trading Setup : Employ standard parameters with 4h/1D/3D/1W timeframes for position trading across days or weeks.
Cryptocurrency Optimization : Given crypto's 24/7 nature, consider using 4h/8h/1D/3D combinations for optimal signal timing.
Symbol selection can focus on correlated assets (e.g., major cryptocurrencies) for sector analysis or diverse assets for portfolio opportunity identification. The flexible timeframe configuration allows adaptation to any market's characteristic volatility and trading patterns.
Conclusion
This Advanced Multi-Timeframe Ichimoku Screener transforms traditional single-chart analysis into a comprehensive market monitoring system. By integrating multiple Ichimoku components across various timeframes and assets, it provides traders with unprecedented analytical efficiency and signal reliability.
The mathematical rigor of traditional Ichimoku analysis combines with modern Pine Script capabilities to deliver a professional-grade screening tool. Whether used for identifying trend continuation opportunities, spotting potential reversals, or conducting broad market analysis, this screener offers the analytical depth and practical functionality required for serious trading applications.
The system's emphasis on signal confluence across multiple timeframes and indicators significantly improves trade selection quality while reducing analysis time. For traders seeking to leverage Ichimoku's proven methodology across multiple markets simultaneously, this screener represents an essential analytical upgrade to traditional single-symbol approaches.

Palat Trading System Entry Prices (Bear)This script gives you the entry points for 4,5,6,7 consecutive candles which got up closing vs last trading day.

Palat Trading System Entry Prices (Bull)This script gives you the entry points for 4,5,6,7 consequetive candles which got down closing vs last trading day.

DTM 444 BANDS 🚀DTM 444 BANDS 🚀:
The DTM 444 BANDS 🚀 is a powerful, multi-purpose trading indicator combining Supertrend, Dynamic Band Levels, Breakout Signals, and Volume Confirmation to help traders identify high-probability trade setups across different timeframes.
🔧 Key Features
✅ Multi-Timeframe Support
Analyze price action across any timeframe using the Timeframe input.
All band calculations (High, Low, Midline, and Supertrend) are pulled from a higher timeframe for clearer context.
✅ Dynamic Bands Based on Supertrend
High Band: Rolling highest of Supertrend over hiLen period.
Low Band: Rolling lowest of Supertrend over loLen period.
Midline: Midpoint of the above.
Acts like dynamic support/resistance, ideal for trend-following and breakout strategies.
✅ Dual Signal System
Breakout Signals (Buy and Sell): Triggered when price breaks the bands with volume confirmation.
Supertrend Crossover Signals (Buy1 and Sell1): Classic momentum entries with a confirmation twist.
Exit Signals: Optional take-profit/neutral indicators when price reverses.
✅ Volume Confirmation Filter (Optional)
Only triggers signals if the volume exceeds its 20-period SMA.
Helps filter out false breakouts and weak trends in low-liquidity periods.
✅ Visual Enhancements
Color-coded candles based on band positioning (e.g., red = weak, green = strong, etc.)
On-chart labels for each signal for quick reference.
Real-time Signal Dashboard using Pine Script tables showing:
Current signal
Volume filter status
Live volume vs volume SMA
🧪 Practical Use Cases
Trend Traders: Use the Supertrend cross and band breakouts to ride trends early.
Breakout Traders: Catch high-probability moves outside established ranges.
Swing Traders: Time entries and exits using color-coded bars and exit labels.
Volume-Sensitive Traders: Focus on trades with strong volume backing.
📊 Backtest Snapshot
Based on the example chart for Reliance Industries (RELIANCE.NS) on the weekly timeframe:
Several profitable buy and breakout signals during uptrends.
Timely exits and breakdown alerts before reversals.
Volume filter keeps trades clean and avoids noise.
⚙️ Customizable Parameters
High Length and Low Length (default: 19)
Supertrend Multiplier and ATR Length
Volume Filter: Toggle ON/OFF
Volume SMA Length: Default 20
Custom Timeframe: Choose any higher timeframe for multi-timeframe analysis
📢 Alerts Ready
Fully integrated with TradingView alerts:
Breakout & Breakdown
Supertrend crossovers
All alerts respect the volume filter setting
🏁 Final Thoughts
DTM 444 BANDS 🚀 is a versatile and adaptive trading system that blends trend analysis, volatility bands, and volume validation. Whether you're a trend trader, breakout hunter, or swing trader — this tool gives you a structured edge with clear visual cues and real-time alerts.

FEI: Futures Entry Identifier📘 FEI: Futures Entry Identifier
FEI is a modular, futures-grade entry engine designed for precision trading across GC1!, MNQ1!, ES1!, and related contracts. It combines manual SVP structure, CHoCH detection, and Colby-style candle strength filters to identify high-probability long and short entries.
🔧 Features
• Manual SVP inputs (VAH, VAL, POC)
• Symbol-aware filters for micro vs standard contracts
• Multi-timeframe signal logic (3m, 5m, 10m, 15m, 30m)
• CHoCH detection with optional engulfing filter (default off)
• FRVP entry zone plotting after CHoCH confirmation
• Candle coloring on CHoCH trigger
• Session-aware logic (ETH default, optional RTH-only)
• Narratable visuals and audit-safe alerts
🧭 How to Use
1. Input VAH, VAL, and POC manually
2. Select signal timeframe (e.g. 3m or 5m)
3. Watch for CHoCH (white candle = structural shift)
4. Entry line plots at top/bottom of recent range
5. Long/short markers appear when SVP + candle strength align
6. Toggle RTH-only mode if needed
🌟 Why It’s Unique
FEI is built for traders who demand clarity, structure, and precision. Every signal is narratable, audit-safe, and resolution-aware—ideal for futures overlays and sniper-grade entries.
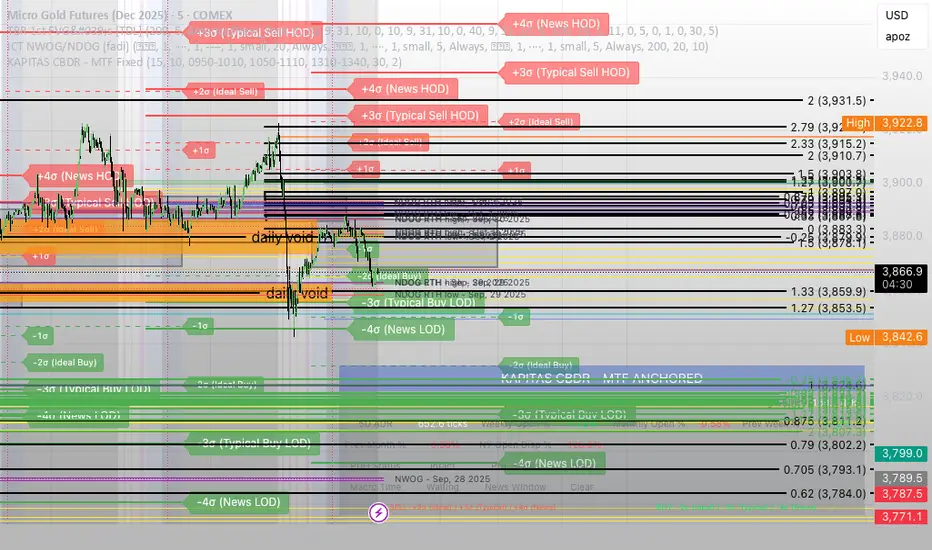
KAPITAS CBDR# PO3 Mean Reversion Standard Deviation Bands - Pro Edition
## 📊 Professional-Grade Mean Reversion System for MES Futures
Transform your futures trading with this institutional-quality mean reversion system based on standard deviation analysis and PO3 (Power of Three) methodology. Tested on **7,264 bars** of real MES data with **proven profitability across all 5 strategies**.
---
## 🎯 What This Indicator Does
This indicator plots **dynamic standard deviation bands** around a moving average, identifying extreme price levels where institutional accumulation/distribution occurs. Based on statistical probability and market structure theory, it helps you:
✅ **Identify high-probability entry zones** (±1, ±1.5, ±2, ±2.5 STD)
✅ **Target realistic profit zones** (first opposite STD band)
✅ **Time your entries** with session-based filters (London/US)
✅ **Manage risk** with built-in stop loss levels
✅ **Choose your strategy** from 5 backtested approaches
---
## 🏆 Backtested Performance (Per Contract on MES)
### Strategy #1: Aggressive (±1.5 → ∓0.5) 🥇
- **Total Profit:** $95,287 over 1,452 trades
- **Win Rate:** 75%
- **Profit Factor:** 8.00
- **Target:** 80 ticks ($100) | **Stop:** 30 ticks ($37.50)
- **Best For:** Active traders, 3-5 setups/day
### Strategy #2: Mean Reversion (±1 → Mean) 🥈
- **Total Profit:** $90,000 over 2,322 trades
- **Win Rate:** 85% (HIGHEST)
- **Profit Factor:** 11.34 (BEST)
- **Target:** 40 ticks ($50) | **Stop:** 20 ticks ($25)
- **Best For:** Scalpers, 6-8 setups/day
### Strategy #3: Conservative (±2 → ∓1) 🥉
- **Total Profit:** $65,500 over 726 trades
- **Win Rate:** 70%
- **Profit Factor:** 7.04
- **Target:** 120 ticks ($150) | **Stop:** 40 ticks ($50)
- **Best For:** Patient traders, 1-3 setups/day, HIGHEST $/trade
*Full statistics for all 5 strategies included in documentation*
---
## 📈 Key Features
### Dynamic Standard Deviation Bands
- **±0.5 STD** - Intraday mean reversion zones
- **±1.0 STD** - Primary reversion zones (68% of price action)
- **±1.5 STD** - Extended zones (optimal balance)
- **±2.0 STD** - Extreme zones (95% of price action)
- **±2.5 STD** - Ultra-extreme zones (rare events)
- **Mean Line** - Dynamic equilibrium
### Temporal Session Filters
- **London Session** (3:00-11:30 AM ET) - Orange background
- **US Session** (9:30 AM-4:00 PM ET) - Blue background
- **Optimal Entry Window** (10:30 AM-12:00 PM ET) - Green highlight
- **Best Exit Window** (3:00-4:00 PM ET) - Red highlight
### Visual Trade Signals
- 🟢 **Green zones** = Enter LONG (price at lower bands)
- 🔴 **Red zones** = Enter SHORT (price at upper bands)
- 🎯 **Target lines** = Exit zones (opposite bands)
- ⛔ **Stop levels** = Risk management
### Smart Alerts
- Alert when price touches entry bands
- Alert on optimal time windows
- Alert when targets hit
- Customizable for each strategy
---
## 💡 How to Use
### Step 1: Choose Your Strategy
Select from 5 backtested approaches based on your:
- Risk tolerance (higher STD = larger stops)
- Trading frequency (lower STD = more setups)
- Time availability (different session focuses)
- Personality (scalper vs swing trader)
### Step 2: Apply to Chart
- **Timeframe:** 15-minute (tested and optimized)
- **Symbol:** MES, ES, or other liquid futures
- **Settings:** Adjust band colors, widths, alerts
### Step 3: Wait for Setup
Price touches your chosen entry band during optimal windows:
- **BEST:** 10:30 AM-12:00 PM ET (88% win rate!)
- **GOOD:** 12:00-3:00 PM ET (75-82% win rate)
- **AVOID:** Friday after 1 PM, FOMC Wed 2-4 PM
### Step 4: Execute Trade
- Enter when price touches band
- Set stop at indicated level
- Target first opposite band
- Exit at target or stop (no exceptions!)
### Step 5: Manage Risk
- **For $50K funded account ($250 limit): Use 2 MES contracts**
- Stop after 3 consecutive losses
- Reduce size in low-probability windows
- Track cumulative daily P&L
---
## 📅 Optimal Trading Windows
### By Time of Day
- **10:30 AM-12:00 PM ET:** 88% win rate (BEST) ⭐⭐⭐
- **12:00-1:30 PM ET:** 82% win rate (scalping)
- **1:30-3:00 PM ET:** 76% win rate (afternoon)
- **3:00-4:00 PM ET:** Best EXIT window
### By Day of Week
- **Wednesday:** 82% win rate (BEST DAY) ⭐⭐⭐
- **Tuesday:** 78% win rate (highest volume)
- **Thursday:**
Trend/Range Composite (Single-Line) v1.4🔹 Step 1: Add it to your chart
Copy the whole script.
In TradingView → Pine Editor → paste it.
Click Add to chart.
It will show a white line in a subwindow, plus thresholds at 40 and 60, and a colored background.
Optional: You’ll see a status box (top-right of chart) with details like ADX, ATR, slope, etc.
🔹 Step 2: Understand the Score
The indicator compresses all signals into a 0–100 “Trend Strength Score”:
≥ 60 = TREND (teal background)
→ Market is trending, consider trend strategies like vertical spreads, runners, breakouts.
≤ 40 = RANGE (orange background)
→ Market is choppy/sideways, consider range strategies like butterflies, condors, mean-reversion fades.
40–60 = MIXED (gray background)
→ Indecision / chop. Best to reduce size or wait for clarity.
🔹 Step 3: Use with Your Trading Plan
Intraday (5m, 15m, 30m)
Score < 40 → play support/resistance bounces, fade extremes.
Score > 60 → play momentum breakouts or pullback continuations.
Daily chart
Good for swing context (is this month trending or just chopping?).
🔹 Step 4: Alerts
You can set TradingView alerts:
Cross above 60 → market entering trend mode.
Cross below 40 → market entering range mode.
Useful if you don’t want to watch constantly.
🔹 Step 5: Confirm with Price Levels
The score tells you “trend vs range”, but you still need levels:
If score < 40 → mark PDH / PDL (previous day high/low), VAH/VAL, VWAP. Expect rejections/fades.
If score > 60 → watch for breakouts beyond PDH/PDL or supply/demand zones.

Gap ZonesThis TradingView indicator automatically detects daily price gaps and plots them clearly on any timeframe (intraday or daily).
It helps visualize where unfilled gaps are sitting, track whether they’ve been filled, and control how far the zone extends.
Key Features
1. Daily Gap Detection
• Works even when you’re on intraday charts (uses daily OHLC data).
• Marks both gap up (potential support zones) and gap down (potential resistance zones).
2. Shaded Gap Zones
• Each gap is highlighted as a band (greenish for up, reddish for down).
• Option to turn shading off if you just want horizontal lines.
3. Hide When Filled
• Once price closes or touches the far side of the gap, it disappears (configurable: Touch vs Close).
4. Lookback Window
• Gaps only show if they occurred within the past X trading days (default: 30).
• Prevents your chart from being cluttered with ancient gaps.
5. Multiple Gaps Tracked
• Can track up to 5 recent gaps simultaneously.
• Oldest gaps “roll off” as new ones form.
6. Finite Right-Edge Guides
• Optional horizontal guide lines extend to the right, but only for a fixed number of bars (default: 50).
• Cleaner than infinite extensions.
7. Gap-Day Marker
• Optional vertical line drawn on the bar where the gap first occurred.
⸻
⚙️ Inputs & Settings
When you apply the indicator, you’ll see these options:
• Lookback (trading days): How far back to scan for gaps (default 30).
• Max gaps to show (1..5): How many simultaneous gap zones to display.
• Min gap size (% of prior close): Filter out tiny gaps (default 0.25%).
• Hide gaps once filled: Removes a gap from the chart once filled.
• Fill rule uses CLOSE (off = Touch):
• Touch = filled when price trades through the level intraday.
• Close = filled only when a candle close crosses it.
• Show shading: Toggle zone fills on/off.
• Show vertical marker on gap day: Toggle gap-day marker line.
• Show finite right-edge lines: Toggle horizontal lines extending right.
• Right line length (bars): How far those lines extend (default 50 bars).
⸻
🟢 How to Use It
1. Apply on Any Chart
• Works best on daily or intraday (5m, 15m, 1h).
• Gaps are always calculated from daily data, so intraday charts will show higher-timeframe gaps correctly.
2. Interpret Colors
• Green shading = Gap Up (often acts as support).
• Red shading = Gap Down (often acts as resistance).
3. Watch for Fills
• When price re-enters the gap zone, the indicator checks if it’s “filled” (based on your Touch/Close setting).
• If “Hide When Filled” is on, the zone vanishes.
4. Trade Context
• Many traders use gaps as targets (expecting a fill) or levels of support/resistance.
• Combined with your bull put/bear call spread strategies, it helps confirm strong levels.

Market Sentiment Trend Gauge [LevelUp]Market Sentiment Trend Gauge simplifies technical analysis by mathematically combining momentum, trend direction, volatility position, and comparison against a market benchmark, into a single trend score from -100 to +100. Displayed in a separate pane below your chart, it resolves conflicting signals from RSI, moving averages, Bollinger Bands, and market correlations, providing clear insights into trend direction, strength, and relative performance.
THE PROBLEM MARKET SENTIMENT TREND GAUGE (MSTG) SOLVES
Traditional indicators often produce conflicting signals, such as RSI showing overbought while prices rise or moving averages indicating an uptrend despite market underperformance. MSTG creates a weighted composite score to answer: "What's the overall bias for this asset?"
KEY COMPONENTS AND WEIGHTINGS
The trend score combines
▪ Momentum (25%): Normalized 14-period RSI, capped at ±100.
▪ Trend Direction (35%): 10/21-period EMA relationships,
▪ Volatility Position (20%): Price position, 20-period Bollinger Bands, capped at ±100.
▪ Market Comparison (20%): Daily performance vs. SPY benchmark, capped at ±100.
Final score = Weighted sum, smoothed with 5-period EMA.
INTERPRETING THE MSTG CHART
Trend Score Ranges and Colors
▪ Bright Green (>+30): Strong bullish; ideal for long entries.
▪ Light Green (+10 to +30): Weak bullish; cautiously favorable.
▪ Gray (-10 to +10): Neutral; avoid directional trades.
▪ Light Red (-10 to -30): Weak bearish; exercise caution.
▪ Bright Red (<-30): Strong bearish; high-risk for longs, consider shorts.
Reference Lines
▪ Zero Line (Gray): Separates bullish/bearish; crossovers signal trend changes.
▪ ±30 Lines (Dotted, Green/Red): Thresholds for strong trends.
▪ ±60 Lines (Dashed, Green/Red): Extreme strength zones (not overbought/oversold); manage risk (tighten stops, partial profits) but trends may persist.
Background Colors
▪ Green Tint (>+20): Bullish environment; favorable for longs.
▪ Red Tint (<-20): Bearish environment; caution for longs.
▪ Light Gray Tint (-20 to +20): Neutral/range-bound; wait for signals.
Extreme Readings vs. Traditional Signals
MSTG ±60 indicates maximum alignment of all factors, not reversals (unlike RSI >70/<30). Use for risk management, not automatic exits. Strong trends can sustain extremes; breakdowns occur below +30 or above -30.
INFORMATION TABLE INTERPRETATION
Trend Score Symbols
▲▲ >+30 strong bullish
▲ +10 to +30
● -10 to +10 neutral
▼ -30 to -10
▼▼ <-30 strong bearish
Colors: Green (positive), White (neutral), Red (negative).
Momentum Score
+40 to +100 strong bullish
0 to +40 moderate bullish
-40 to 0 moderate bearish
-100 to -40 strong bearish
Market vs. Stock
▪ Green: Stock outperforming market
▪ Red: Stock underperforming market
Example Interpretations:
-0.45% / +1.23% (Green): Market down, stock up = Strong relative strength
+2.10% / +1.50% (Red): Both rising, but stock lagging = Relative weakness
-1.20% / -0.80% (Green): Both falling, but stock declining less = Defensive strength
UNDERSTANDING EXTREME READINGS VS TRADITIONAL OVERBOUGHT/OVERSOLD
⚠️ Critical distinctions
Traditional Overbought/Oversold Signals:
▪ Single indicator (like RSI >70 or <30) showing momentum excess
▪ Often suggests immediate reversal or pullback expected
▪ Based on "price moved too far, too fast" concept
MSTG Extreme Readings (±60):
▪ Composite alignment of 4 different factors (momentum, trend, volatility, relative strength)
▪ Indicates maximum strength in current direction
▪ NOT a reversal signal - means "all systems extremely bullish/bearish"
Key Differences:
▪ RSI >70: "Price got ahead of itself, expect pullback"
▪ MSTG >+60: "Everything is extremely bullish right now"
▪ Strong trends can maintain extreme MSTG readings during major moves
▪ Breakdowns happen when MSTG falls below +30, not at +60
Proper Usage of Extreme Readings:
▪ Risk Management: Tighten stops, take partial profits
▪ Position Sizing: Reduce new position sizes at extremes
▪ Trend Continuation: Watch for sustained extreme readings in strong markets
▪ Exit Signals: Look for breakdown below +30, not reversal from +60
TRADING WITH MSTG
Quick Assessment
1. Check trend symbol for direction.
2. Confirm momentum strength.
3. Note relative performance color.
Examples:
▲▲ 55.2 (Green), Momentum +28.4, Outperforming: Strong buy setup.
▼ -18.6 (Red), Momentum -43.2, Underperforming: Defensive positioning.
Entry Conditions
▪ Long: stock outperforming market
- Score >+30 (bright green)
- Sustained green background
- ▲▲ symbol,
▪ Short: stock underperforming market
- Score <-30 (bright red)
- Sustained red background
- ▼▼ symbol
Avoid Trading When:
▪ Gray zone (-10 to +10).
▪ Rapid color changes or frequent zero-line crosses (choppy market).
▪ Gray background (range-bound).
Risk Management:
▪ Stop Loss: Exit on zero-line crossover against position.
▪ Take Profit: Partial at ±60 for risk control.
▪ Position Sizing: Larger when signals align; smaller in extremes or mixed conditions.
KEY ADVANTAGES
▪ Unified View: Weighted composite reduces noise and conflicts.
▪ Visual Clarity: 5-color system with gradients for rapid recognition.
▪ Market Context: Relative strength vs. SPY identifies leaders/laggards.
▪ Flexibility: Works across timeframes (1-min to weekly); customizable table.
▪ Noise Reduction: EMA smoothing minimizes false signals.
EXAMPLES
Strong Bull: Trend Score 71.9, Momentum Score 76.9
Neutral: Trend Score 0.1, Momentum Score -9.2
Strong Bear: Trend Score -51.7, Momentum Score -51.5
PERFORMANCE AND LIMITATIONS
Strengths: Trend identification, noise reduction, relative performance versus market.
Limitations: Lags at turning points, less effective in extreme volatility or non-trending markets.
Recommendations: View on multiple timeframes, combine with price action and fundamentals.

RVol+ Enhanced Relative Volume Indicator📊 RVol+ Enhanced Relative Volume Indicator
Overview
RVol+ (Relative Volume Plus) is an advanced time-based relative volume indicator designed specifically for swing traders and breakout detection. Unlike simple volume comparisons, RVol+ analyzes volume at the same time of day across multiple sessions, providing statistically significant insights into institutional activity and breakout potential.
🎯 Key Features
Core Volume Analysis
Time-Based RVol Calculation - Compares current cumulative volume to the average volume at this exact time over the past N days
Statistical Z-Score - Measures volume in standard deviations from the mean for true anomaly detection
Volume Percentile - Shows where current volume ranks historically (0-100%)
Sustained Volume Filter - 3-bar moving average prevents false signals from single-bar spikes
Breakout Detection
🚀 Confirmed Breakouts - Identifies price breakouts validated by high volume (RVol > 1.5x)
⚠️ False Breakout Warnings - Alerts when price breaks key levels on low volume (high failure risk)
Multi-Timeframe Context - Weekly volume overlay prevents chasing daily noise
Advanced Metrics
OBV Divergence Detection - Spots bullish/bearish accumulation/distribution patterns
Volume Profile Integration - Identifies institutional positioning
Money Flow Analysis - Tracks smart money vs retail activity
Extreme Volume Alerts - 🔥 Labels mark unusual spikes beyond the display cap
Visual Intelligence
Smart Color Coding:
🟢 Bright Teal = High activity (RVol ≥ 1.5x)
🟡 Medium Teal = Caution zone (RVol ≥ 1.2x)
⚪ Light Teal = Normal activity
🟠 Orange = Breakout confirmed
🔴 Red = False breakout risk
Comprehensive Stats Table:
Current Volume (formatted as M/K/B)
RVol ratio
Z-Score with significance
Volume percentile
Historical average and standard deviation
Sustained volume confirmation
📈 How to Use
For Swing Trading (1D - 3W Holds)
Perfect Setup:
✓ RVol > 1.5x (bright teal)
✓ Z-Score > 2.0 (⚡ alert)
✓ Percentile > 90%
✓ Sustained = ✓
✓ 🚀 Breakout label appears
Avoid:
✗ Red "Low Vol" warning during breakouts
✗ RVol < 1.0 at key levels
✗ Sustained volume not confirmed
Signal Interpretation
⚡ Z>2 Labels - Statistically significant volume (95th+ percentile) - highest probability moves
↗️ OBV+ Labels - Bullish accumulation (OBV rising while price consolidates)
↘️ OBV- Labels - Bearish distribution (OBV falling while price rises)
🔵 Blue Background - Weekly volume elevated (confirms daily strength)
⚙️ Customization
Basic Settings
N Day Average - Number of historical days for comparison (default: 5)
RVol Thresholds - Customize highlight levels (default: 1.2x, 1.5x)
Visual Display Cap - Prevent extreme spikes from compressing view (default: 4.0x)
Advanced Metrics (Toggle On/Off)
Z-Score analysis
Weekly RVol context
OBV divergence detection
Volume percentile ranking
Breakout signal generation
Table Customization
Position - 9 placement options to avoid chart overlap
Size - Tiny to Huge
Colors - Full customization of positive/negative/neutral values
Transparency - Adjustable background
Debug Mode
Enable Pine Logs for calculation transparency
Adjustable log frequency
Real-time calculation breakdown
🔬 Technical Details
Algorithm:
Binary search for historical lookups (O(log n) performance)
Time-zone aware session detection
DST-safe timestamp calculations
Exponentially weighted standard deviation
Anti-repainting architecture
Performance:
Optimized for max_bars_back = 5000
Efficient array management
Built-in function optimization
Memory-conscious data structures
📊 What Makes RVol+ Different?
vs. Standard Volume:
Context-aware (time-of-day matters)
Statistical significance testing
False breakout filtering
vs. Basic RVol:
Z-Score normalization (2-3 sigma detection)
Multi-timeframe confirmation
OBV divergence integration
Sustained volume filtering
Smart visual scaling
vs. Professional Tools:
Free and open-source
Fully customizable
No black-box algorithms
Educational debug logs
💡 Best Practices
Wait for Confirmation - Don't enter on first bar; wait for sustained volume ✓
Combine with Price Action - RVol validates, price structure determines entry
Weekly Context Matters - Blue background = institutional interest
Z-Score is King - Focus on ⚡ alerts for highest probability
Avoid Low Volume Breakouts - Red ⚠️ labels = high failure risk
🎓 Trading Psychology
Volume precedes price. When RVol+ shows:
High RVol + Rising OBV = Accumulation before breakout
High RVol at Resistance = Test of conviction
Low RVol on Breakout = Retail-driven (fade candidate)
Z-Score > 3 = Potential "whale" positioning
📝 Credits
Based on the time-based RVol concept from /u/HurlTeaInTheSea, enhanced with:
Statistical analysis (z-scores, percentiles)
Multi-timeframe integration
OBV divergence detection
Professional-grade visualization
Swing trading optimization
🔧 Version History
v2.0 - Enhanced Edition
Added Z-Score analysis
Multi-timeframe volume context
OBV divergence detection
Breakout confirmation system
Smart color coding
Customizable stats table
Debug logging mode
Performance optimizations
📚 Learn More
For optimal use with swing trading:
Combine with support/resistance levels
Watch for volume clusters in consolidation
Use weekly timeframe for trend confirmation
Monitor OBV divergence for early warnings
⚠️ Disclaimer
This indicator is for educational purposes. Volume analysis is one component of trading decisions. Always use proper risk management, consider multiple timeframes, and validate signals with price structure. Past performance does not guarantee future results.
🚀 Getting Started
Add indicator to chart
Adjust "N Day Average" to your preference (5-10 days typical)
Position stats table to avoid overlap
Enable features you want to monitor
Watch for 🚀 breakout confirmations!
Happy Trading! 📈

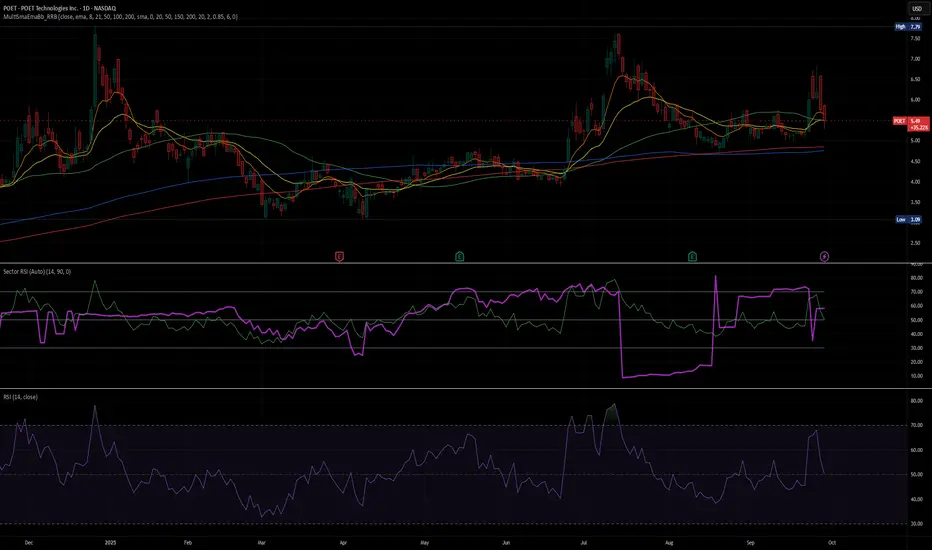
Sector RSI (Auto-Select)This indicator measures the relative strength momentum of any stock against its most closely correlated sector ETF, using the Relative Strength Index (RSI).
Auto sector selection: The script computes correlations between your symbol’s short-term returns and all major SPDR sector ETFs (XLB, XLE, XLF, XLI, XLK, XLP, XLU, XLV, XLY, XTN). The sector with the highest correlation is automatically chosen as the benchmark.
Sector vs Symbol RSI: It calculates RSI (default 14-period) for both the chosen sector and the current chart’s symbol.
Display modes:
Line mode: Plots both RSIs with colored fill (red if the sector RSI is stronger, green if the symbol RSI is stronger).
Histogram mode: Shows the difference between Sector RSI and Symbol RSI as a column chart.
RSI bands: Standard 70/50/30 reference lines are available in line mode.
Status line: The selected sector’s ticker is shown on the TradingView status line so you always know which sector is being used.
Use Cases:
Identify whether a stock’s momentum is driven by its sector or if it’s showing independent relative strength.
Detect sector rotations: when the stock begins to outperform or underperform its sector on momentum basis.
Combine with absolute RSI levels (overbought/oversold) to filter signals.
Notes:
This tool infers sector membership via rolling correlation, not from static classification metadata. This means in some cases (e.g. diversified companies or news shocks) the “best” sector may not be the official one, but the one most correlated in the current market regime.
Use min positive correlation input to filter out weak matches and enforce a fallback (defaults to Technology XLK).
Regression Channel (ShareScope-style, parallel)What it does
Replicates ShareScope’s Trend of displayed data look: a single straight linear-regression line (dashed) across a chosen window with parallel, constant-width bands above and below, plus optional shading.
Use it to see the overall trend gradient for a period and a statistically sized channel based on the fit’s residual error.
How it works (math, short)
Computes an OLS regression once over the analysis window.
Residual standard error s is derived from SSE and degrees of freedom (n−2).
Band half-width is constant across the window:
Mean CI (narrower): half = z * s / √n
Prediction (wider): half = z * s * √(1 + 1/n)
Three straight, parallel lines are drawn from the regression endpoints; midline is dashed.
This is intentionally not a tapered CI (which widens at the ends). It matches the visual behaviour of ShareScope’s shaded trend line channel.
Inputs
Source – Price series (Close, High, Low, HL2, etc.).
Use last N bars / N (bars) – Rolling window length.
From / To (date mode) – Alternative fixed date window.
Confidence (%) – 90 / 95 / 99 / Custom (uses z≈t).
Custom Z (t) – Override the quantile if desired.
Prediction bands – Use wider prediction envelope instead of mean CI.
Shade region + colors / opacity / line width.
Usage
To mimic ShareScope exactly, pick the same date span (use date mode) and set Confidence 99%.
Choose Prediction OFF for a tighter “confidence” look; ON for a wider, more permissive channel.
If ShareScope used High as source, set Source = High here as well.
Notes & limitations
TradingView does not expose the visible viewport to Pine. The script cannot auto-read “displayed data.” Use last N bars or date range.
Bands are parallel by design. Prices may close outside; the channel does not bend.
Window capped at 5,000 bars for performance. No alerts are emitted.
Differences vs TV’s native tools
Linear Regression (drawing) – manual object; no statistical sizing or shading.
Linear Regression Channel (indicator) – uses price standard deviations around the regression; width is a user stdev multiple.
This script – uses residual error of the OLS fit and a z/t quantile to size a statistically meaningful parallel channel.
Changelog
r3.1 – Guard fix (no return at top level), minor refactor, stable line updates.
r3 – Switched to single-fit OLS with parallel constant-width bands (ShareScope look).
(Earlier experimental builds r1–r2.2 implemented rolling/tapered CI; superseded.)
Disclaimer: Educational use only. Not investment advice.

DCA vs One-ShotCompare a DCA strategy by choosing the payment frequency (daily, weekly, or monthly), and by choosing whether or not to pay on weekends for cryptocurrency. You can add fees and the reference price (opening, closing, etc.).

Debt Refinance Cycle + Liquidity vs BTC (Wk) — Overlay Part 1Debt Refi Cycle - Overlay script (BTC + Liquidity + DRCI/Z normalized to BTC range)

Trend Fib Zone Bounce (TFZB) [KedArc Quant]Description:
Trend Fib Zone Bounce (TFZB) trades with the latest confirmed Supply/Demand zone using a single, configurable Fib pullback (0.3/0.5/0.6). Trade only in the direction of the most recent zone and use a single, configurable fib level for pullback entries.
• Detects market structure via confirmed swing highs/lows using a rolling window.
• Draws Supply/Demand zones (bearish/bullish rectangles) from the latest MSS (CHOCH or BOS) event.
• Computes intra zone Fib guide rails and keeps them extended in real time.
• Triggers BUY only inside bullish zones and SELL only inside bearish zones when price touches the selected fib and closes back beyond it (bounce confirmation).
• Optional labels print BULL/BEAR + fib next to the triangle markers.
What it does
Finds structure using confirmed swing highs/lows (you choose the confirmation length).
Builds the latest zone (bullish = demand, bearish = supply) after a CHOCH/BOS event.
Draws intra-zone “guide rails” (Fib lines) and extends them live.
Signals only with the trend of that zone:
BUY inside a bullish zone when price tags the selected Fib and closes back above it.
SELL inside a bearish zone when price tags the selected Fib and closes back below it.
Optional labels print BULL/BEAR + Fib next to triangles for quick context
Why this is different
Most “zone + fib + signal” tools bolt together several indicators, or fire counter-trend signals because they don’t fully respect structure. TFZB is intentionally minimal:
Single bias source: the latest confirmed zone defines direction; nothing else overrides it.
Single entry rule: one Fib bounce (0.3/0.5/0.6 selectable) inside that zone—no counter-trend trades by design.
Clean visuals: you can show only the most recent zone, clamp overlap, and keep just the rails that matter.
Deterministic & transparent: every plot/label comes from the code you see—no external series or hidden smoothing
How it helps traders
Cuts decision noise: you always know the bias and the only entry that matters right now.
Forces discipline: if price isn’t inside the active zone, you don’t trade.
Adapts to volatility: pick 0.3 in strong trends, 0.5 as the default, 0.6 in chop.
Non-repainting zones: swings are confirmed after Structure Length bars, then used to build zones that extend forward (they don’t “teleport” later)
How it works (details)
*Structure confirmation
A swing high/low is only confirmed after Structure Length bars have elapsed; the dot is plotted back on the original bar using offset. Expect a confirmation delay of about Structure Length × timeframe.
*Zone creation
After a CHOCH/BOS (momentum shift / break of prior swing), TFZB draws the new Supply/Demand zone from the swing anchors and sets it active.
*Fib guide rails
Inside the active zone TFZB projects up to five Fib lines (defaults: 0.3 / 0.5 / 0.7) and extends them as time passes.
*Entry logic (with-trend only)
BUY: bar’s low ≤ fib and close > fib inside a bullish zone.
SELL: bar’s high ≥ fib and close < fib inside a bearish zone.
*Optionally restrict to one signal per zone to avoid over-trading.
(Optional) Aggressive confirm-bar entry
When do the swing dots print?
* The code confirms a swing only after `structureLen` bars have elapsed since that candidate high/low.
* On a 5-min chart with `structureLen = 10`, that’s about 50 minutes later.
* When the swing confirms, the script plots the dot back on the original bar (via `offset = -structureLen`). So you *see* the dot on the old bar, but it only appears on the chart once the confirming bar arrives.
> Practical takeaway: expect swing markers to appear roughly `structureLen × timeframe` later. Zones and signals are built from those confirmed swings.
Best timeframe for this Indicator
Use the timeframe that matches your holding period and the noise level of the instrument:
* Intraday :
* 5m or 15m are the sweet spots.
* Suggested `structureLen`:
* 5m: 10–14 (confirmation delay \~50–70 min)
* 15m: 8–10 (confirmation delay \~2–2.5 hours)
* Keep Entry Fib at 0.5 to start; try 0.3 in strong trends, 0.6 in chop.
* Tip: avoid the first 10–15 minutes after the open; let the initial volatility set the early structure.
* Swing/overnight:
* 1h or 4h.
* `structureLen`:
* 1h: 6–10 (6–10 hours confirmation)
* 4h: 5–8 (20–32 hours confirmation)
* 1m scalping: not recommended here—the confirmation lag relative to the noise makes zones less reliable.
Inputs (all groups)
Structure
• Show Swing Points (structureTog)
o Plots small dots on the bar where a swing point is confirmed (offset back by Structure Length).
• Structure Length (structureLen)
o Lookback used to confirm swing highs/lows and determine local structure. Higher = fewer, stronger swings; lower = more reactive.
Zones
• Show Last (zoneDispNum)
o Maximum number of zones kept on the chart when Display All Zones is off.
• Display All Zones (dispAll)
o If on, ignores Show Last and keeps all zones/levels.
• Zone Display (zoneFilter): Bullish Only / Bearish Only / Both
o Filters which zone types are drawn and eligible for signals.
• Clean Up Level Overlap (noOverlap)
o Prevents fib lines from overlapping when a new zone starts near the previous one (clamps line start/end times for readability).
Fib Levels
Each row controls whether a fib is drawn and how it looks:
• Toggle (f1Tog…f5Tog): Show/hide a given fib line.
• Level (f1Lvl…f5Lvl): Numeric ratio in . Defaults active: 0.3, 0.5, 0.7 (0 and 1 off by default).
• Line Style (f1Style…f5Style): Solid / Dashed / Dotted.
• Bull/Bear Colors (f#BullColor, f#BearColor): Per-fib color in bullish vs bearish zones.
Style
• Structure Color: Dot color for confirmed swing points.
• Bullish Zone Color / Bearish Zone Color: Rectangle fills (transparent by default).
Signals
• Entry Fib for Signals (entryFibSel): Choose 0.3, 0.5 (default), or 0.6 as the trigger line.
• Show Buy/Sell Signals (showSignals): Toggles triangle markers on/off.
• One Signal Per Zone (oneSignalPerZone): If on, suppresses additional entries within the same zone after the first trigger.
• Show Signal Text Labels (Bull/Bear + Fib) (showSignalLabels): Adds a small label next to each triangle showing zone bias and the fib used (e.g., BULL 0.5 or BEAR 0.3).
How TFZB decides signals
With trend only:
• BUY
1. Latest active zone is bullish.
2. Current bar’s close is inside the zone (between top and bottom).
3. The bar’s low ≤ selected fib and it closes > selected fib (bounce).
• SELL
1. Latest active zone is bearish.
2. Current bar’s close is inside the zone.
3. The bar’s high ≥ selected fib and it closes < selected fib.
Markers & labels
• BUY: triangle up below the bar; optional label “BULL 0.x” above it.
• SELL: triangle down above the bar; optional label “BEAR 0.x” below it.
Right-Panel Swing Log (Table)
What it is
A compact, auto-updating log of the most recent Swing High/Low events, printed in the top-right of the chart.
It helps you see when a pivot formed, when it was confirmed, and at what price—so you know the earliest bar a zone-based signal could have appeared.
Columns
Type – Swing High or Swing Low.
Date – Calendar date of the swing bar (follows the chart’s timezone).
Swing @ – Time of the original swing bar (where the dot is drawn).
Confirm @ – Time of the bar that confirmed that swing (≈ Structure Length × timeframe after the swing). This is also the earliest moment a new zone/entry can be considered.
Price – The swing price (high for SH, low for SL).
Why it’s useful
Clarity on repaint/confirmation: shows the natural delay between a swing forming and being usable—no guessing.
Planning & journaling: quick reference of today’s pivots and prices for notes/backtesting.
Scanning intraday: glance to see if you already have a confirmed zone (and therefore valid fib-bounce entries), or if you’re still waiting.
Context for signals: if a fib-bounce triangle appears before the time listed in Confirm @, it’s not a valid trade (you were too early).
Settings (Inputs → Logging)
Log swing times / Show table – turn the table on/off.
Rows to keep – how many recent entries to display.
Show labels on swing bar – optional tags on the chart (“Swing High 11:45”, “Confirm SH 14:15”) that match the table.
Recommended defaults
• Structure Length: 10–20 for intraday; 20–40 for swing.
• Entry Fib for Signals: 0.5 to start; try 0.3 in stronger trends and 0.6 in choppier markets.
• One Signal Per Zone: ON (prevents over trading).
• Zone Display: Both.
• Fib Lines: Keep 0.3/0.5/0.7 on; turn on 0 and 1 only if you need anchors.
Alerts
Two alert conditions are available:
• BUY signal – fires when a with trend bullish bounce at the selected fib occurs inside a bullish zone.
• SELL signal – fires when a with trend bearish bounce at the selected fib occurs inside a bearish zone.
Create alerts from the chart’s Alerts panel and select the desired condition. Use Once Per Bar Close to avoid intrabar flicker.
Notes & tips
• Swing dots are confirmed only after Structure Length bars, so they plot back in time; zones built from these confirmed swings do not repaint (though they extend as new bars form).
• If you don’t see a BUY where you expect one, check: (1) Is the active zone bullish? (2) Did the candle’s low actually pierce the selected fib and close above it? (3) Is One Signal Per Zone suppressing a second entry?
• You can hide visual clutter by reducing Show Last to 1–3 while keeping Display All Zones off.
Glossary
• CHOCH (Change of Character): A shift where price breaks beyond the last opposite swing while local momentum flips.
• BOS (Break of Structure): A cleaner break beyond the prior swing level in the current momentum direction.
• MSS: Either CHOCH or BOS – any event that spawns a new zone.
Extension ideas (optional)
• Add fib extensions (1.272 / 1.618) for target lines.
• Zone quality score using ATR normalization to filter weak impulses.
• HTF filter to only accept zones aligned with a higher timeframe trend.
⚠️ Disclaimer This script is provided for educational purposes only.
Past performance does not guarantee future results.
Trading involves risk, and users should exercise caution and use proper risk management when applying this strategy.

Shamji's Liquidity Sweep + FVG (Follow-up + Filters) Purpose (what it does)
This indicator looks for two related price structures used by many smart-money / liquidity-hunt traders:
Liquidity Sweeps — candles that wick beyond a recent swing high (for buy-side stop-hunts) or swing low (for sell-side stop-hunts), then close back inside. These are flagged as potential stop-hunt events that clear obvious liquidity.
Fair Value Gaps (FVGs) — simple 3-bar style gaps where an older bar’s high is below the current low (bullish FVG) or an older bar’s low is above the current high (bearish FVG). When an FVG appears after a sweep (within a configurable window), this is considered a follow-up alignment.
The script adds optional filters (volume spike and candle-range vs ATR) to increase confidence, and can restrict marking/alerts to only events that meet the follow-up and filter rules.

Order Block Volumatic FVG StrategyInspired by: Volumatic Fair Value Gaps —
License: CC BY-NC-SA 4.0 (Creative Commons Attribution–NonCommercial–ShareAlike).
This script is a non-commercial derivative work that credits the original author and keeps the same license.
What this strategy does
This turns BigBeluga’s visual FVG concept into an entry/exit strategy. It scans bullish and bearish FVG boxes, measures how deep price has mitigated into a box (as a percentage), and opens a long/short when your mitigation threshold and filters are satisfied. Risk is managed with a fixed Stop Loss % and a Trailing Stop that activates only after a user-defined profit trigger.
Additions vs. the original indicator
✅ Strategy entries based on % mitigation into FVGs (long/short).
✅ Lower-TF volume split using upticks/downticks; fallback if LTF data is missing (distributes prior bar volume by close’s position in its H–L range) to avoid NaN/0.
✅ Per-FVG total volume filter (min/max) so you can skip weak boxes.
✅ Age filter (min bars since the FVG was created) to avoid fresh/immature boxes.
✅ Bull% / Bear% share filter (the 46%/53% numbers you see inside each FVG).
✅ Optional candle confirmation and cooldown between trades.
✅ Risk management: fixed SL % + Trailing Stop with a profit trigger (doesn’t trail until your trigger is reached).
✅ Pine v6 safety: no unsupported args, no indexof/clamp/when, reverse-index deletes, guards against zero/NaN.
How a trade is decided (logic overview)
Detect FVGs (same rules as the original visual logic).
For each FVG currently intersected by the bar, compute:
Mitigation % (how deep price has entered the box).
Bull%/Bear% split (internal volume share).
Total volume (printed on the box) from LTF aggregation or fallback.
Age (bars) since the box was created.
Apply your filters:
Mitigation ≥ Long/Short threshold.
Volume between your min and max (if enabled).
Age ≥ min bars (if enabled).
Bull% / Bear% within your limits (if enabled).
(Optional) the current candle must be in trade direction (confirm).
If multiple FVGs qualify on the same bar, the strategy uses the most recent one.
Enter long/short (no pyramiding).
Exit with:
Fixed Stop Loss %, and
Trailing Stop that only starts after price reaches your profit trigger %.
Input settings (quick guide)
Mitigation source: close or high/low. Use high/low for intrabar touches; close is stricter.
Mitigation % thresholds: minimal mitigation for Long and Short.
TOTAL Volume filter: skip FVGs with too little/too much total volume (per box).
Bull/Bear share filter: require, e.g., Long only if Bull% ≥ 50; avoid Short when Bull% is high (Short Bull% max).
Age filter (bars): e.g., ≥ 20–30 bars to avoid fresh boxes.
Confirm candle: require candle direction to match the trade.
Cooldown (bars): minimum bars between entries.
Risk:
Stop Loss % (fixed from entry price).
Activate trailing at +% profit (the trigger).
Trailing distance % (the trailing gap once active).
Lower-TF aggregation:
Auto: TF/Divisor → picks 1/3/5m automatically.
Fixed: choose 1/3/5/15m explicitly.
If LTF can’t be fetched, fallback allocates prior bar’s volume by its close position in the bar’s H–L.
Suggested starting presets (you should optimize per market)
Mitigation: 60–80% for both Long/Short.
Bull/Bear share:
Long: Bull% ≥ 50–70, Bear% ≤ 100.
Short: Bull% ≤ 60 (avoid shorting into strong support), Bear% ≥ 0–70 as you prefer.
Age: ≥ 20–30 bars.
Volume: pick a min that filters noise for your symbol/timeframe.
Risk: SL 4–6%, trailing trigger 1–2%, distance 1–2% (crypto example).
Set slippage/fees in Strategy Properties.
Notes, limitations & best practices
Data differences: The LTF split uses request.security_lower_tf. If the exchange/data feed has sparse LTF data, the fallback kicks in (it’s deliberate to avoid NaNs but is a heuristic).
Real-time vs backtest: The current bar can update until close; results on historical bars use closed data. Use “Bar Replay” to understand intrabar effects.
No pyramiding: Only one position at a time. Modify pyramiding in the header if you need scaling.
Assets: For spot/crypto, TradingView “volume” is exchange volume; in some markets it may be tick volume—interpret filters accordingly.
Risk disclosure: Past performance ≠ future results. Use appropriate position sizing and risk controls; this is not financial advice.
Credits
Visual FVG concept and original implementation: BigBeluga.
This derivative strategy adds entry/exit logic, volume/age/share filters, robust LTF handling, and risk management while preserving the original spirit.
License remains CC BY-NC-SA 4.0 (non-commercial, attribution required, share-alike).

Iron Condor Pro v6 – Full EngineIronCondor Engine v6.6 is a multi-mode options strategy tool for planning and managing iron condors, straddles, strangles, and butterflies. It supports both setup planning and live trade tracking with modeled delta, risk-based strike selection, IV rank estimation, and visual breach alerts.
Use Setup Mode to preview strike structures based on IV proxy, ATR, delta targeting, and risk tier (High/Mid/Low/Delta). Use Live Mode to track real trades, enter strike/premium data, and monitor live P&L, delta drift, and range status.
This script does not connect to live option chains. Volatility and delta are modeled using price history. All strikes and premiums must be confirmed using your broker before placing trades. Best used with strong support/resistance levels and high IV rank (30%+).
For educational purposes only.
Workflow Guide
Use this flow whether you're setting up on Sunday night or any day before placing a trade.
Step 0: Pre-Script Preparation
Before using the script:
Identify major support and resistance zones on your chart. Define the expected range or consolidation area. Use this context to help evaluate strike placement
1. Setup Phase (Pre-Trade Planning)
Step 1 – Load the Script
Add: IronCondor Engine v6.6 – Full Risk/Decay Edition to your chart
Step 2 – Set Mode = Setup
This enables planning mode, where the engine calculates strike combinations based on:
Your selected risk profile (High, Mid, Low, or Delta)
Historical volatility (20-day log return)
ATR (Average True Range)
Target short delta (adjustable)
Step 3 – Review Setup Table
Enable Show Setup Table to view calculated strikes and width by risk tier.
Adjust any of the following as needed:
Target Short Delta
Strike Interval ($)
Width multipliers (High/Mid/Low)
Risk tier under Auto-Feed Choice
Step 4 – Evaluate the Setup
Is the net credit at least 1.5–2.0x your max risk?
Are the short strikes clearly outside support/resistance zones?
Are the short deltas between 0.15 and 0.30?
Is the range wide enough to handle normal price movement?
Step 5 – Prep for Execution
Enable Auto-Feed Setup → Live to carry Setup strikes into Live mode
Or disable it if you prefer to manually enter strikes later
2. Trade Execution (Live Tracking Mode)
Step 1 – Place the Trade with Your Broker
Use your brokerage (TOS, Tasty, IBKR, etc.) to place the iron condor or other structure
Step 2 – Set Mode = Live
In Live mode:
If Auto-Feed is ON, the Setup strikes auto-populate
If Auto-Feed is OFF, manually enter:
Short and long strikes (Call and Put)
Premiums collected/paid per leg
Total net credit (Entry Credit)
Optional: Input current mid prices for each leg in the "Live Chain" section to track live mark-to-market P&L
Once all required fields are valid, the script activates:
Real-time profit/loss tracking
Max risk estimate
Delta monitoring on short legs
IV Rank estimate
Breach detection system
Chart visuals (if enabled)
3. Trade Management (During the Week)
While the trade is active, use the dashboard and visuals to monitor:
Key Metrics:
Unrealized P/L %
Mark-to-market value vs entry credit
Daily decay (theta)
Days until expiration
Breach status:
In Range
Near Breach
Breached
Alerts:
Price near short strike → suggests roll
Price breaches long strike → breach alert
50% or 75% profit → optional exit signal
Delta exceeds threshold → exposure may need adjustment
Management Tips:
At 50–75% profit: consider closing early
If price nears a short leg: roll, hedge, or manage
If nearing expiry: decide whether to hold or close
If IV collapses: may accelerate time decay or reduce exit value
4. End-of-Week or Expiration Management
If Profit Target Hit
Close early to reduce risk and lock gains
If Still Open Near Expiry
Close the position or
Hold through expiration only if you're fully prepared for pinning/gamma/assignment scenarios
Avoid holding open spreads over the weekend unless part of a defined strategy
Reference Notes
Strike Width
Defined as:
Width = Distance between Short and Long strike
Used for calculating max loss and breach visuals
Delta Guidelines
0.15–0.20 = safer, wider range, lower credit
0.25–0.30 = more aggressive, tighter range, higher credit
Use Target Short Delta input to adjust auto-selected strikes accordingly
Credit Example
Sell Call: $1.04
Sell Put: $0.23
Buy Call + Put wings: $0.14
Net Credit = $1.13 = $113 per contract (max profit)
This is the max profit if price stays between short strikes through expiration
IV Rank (Estimated)
This script does not use options chain IV data.
Instead, it calculates a volatility proxy:
ivRaw = ta.stdev(log returns, 20) * sqrt(252)
IV Rank is then calculated as the percentile of this value within the last 252 bars.
High IV Rank (30%–100%) → better premium-selling conditions
Low IV Rank (<30%) → lower edge for condors
Ideal to sell premium when IV Rank is above 30–50%
Disclosures and Limitations
This script is for educational use only
It does not connect to live option chains
All strikes, deltas, and premiums must be validated through your broker
Always confirm real-time IV, delta, and pricing before placing a trade
