RMA Smoothed RSIRMA Smoothed RSI
Description:
An enhanced RSI built for cleaner intraday and swing reads. It applies RMA smoothing to damp noise.
How It Works
RSI (RMA-Smoothed):
Computes classic RSI from price changes and smooths the result with an additional RMA (user-controlled 3–7, where 5 is the sweet spot). This reduces whipsaw while preserving shifts in momentum.
How to Interpret
50 Midline = Bias Filter: Above 50 favors strength; below 50 favors weakness.
RSI vs RSI-MA Crosses: Cross up can precede thrust or mean-revert toward 50; cross down the opposite.
Inputs
Length: RSI period (default 14).
Source: Price source for RSI (default Close).
Smoothing: RMA smoothing length on RSI (3–7; default 3; 5 sweet spot).
Calculate Divergence: Toggle to compute pivots/divergences and enable alerts.
Moving Average Type: None, SMA, EMA, WMA, VWMA (default EMA).
MA Length: Length of the RSI-based MA (separate from RSI length).
Best For
Traders who want a cleaner RSI read without losing responsiveness.
Scalpers timing momentum shifts around the 50 line and MA crosses.
Swing traders using divergences as early reversal context.
Pro Tips
For fast intraday charts, start with Length 14, Smoothing 3–5, and EMA as the RSI-MA.
Use 50 reclaims/rejections as a simple regime filter.
Combine divergence labels with volume surges, key S/R, or volatility tools (e.g., BBW/TTM squeeze) to time entries.
Divergence alerts fire only if Calculate Divergence is enabled—keep it on if you rely on signals.
Cerca negli script per "采列VS新圣徒"

Triple-EMA Cloud (3× configurable EMAs + timeframe + fill)About This Script
Name: Triple-EMA Cloud (3× configurable EMAs + timeframe + fill)
What it does:
The script plots three Exponential Moving Averages (EMAs) on your chart.
You can set each EMA’s length (how many bars or days it averages over), source (for example, closing price, opening price, or the midpoint of high + low), and timeframe (you can have one EMA use daily data, another hourly data, etc.).
The indicator draws a “cloud” or channel by shading the area between the outermost two EMAs of the three. This lets you see a band or zone that the price is moving in, defined by those EMAs.
You also get full control over how each of the three EMA‐lines looks: color, thickness, transparency, and plot style (solid line, steps, circles, etc.).
How to Use It (for Beginners)
Here’s how a trader who’s new to charts can use this tool, especially when looking for pullbacks or undercut price action.
Key Concepts
Trend: Imagine the market price is generally going up or down. EMAs are a way to smooth out price movements so you can see the trend more clearly.
Pullback: When a price has been going up (an uptrend), sometimes it dips down a little before going up again. That dip is the pullback. It’s a chance to enter or add to a position at a “better price.”
Undercut: This is when price drops below an important level (for example an EMA) and then comes back up. It looks like it broke below, but then it recovers. That may show reverse pressure or strength building.
How the Script Helps With Pullbacks & Undercuts
Marking Trend Zones with the Cloud
The cloud between the outer EMA lines gives you a zone of expected support/resistance. If the price is above the cloud, that zone can act like a “floor” in uptrends; if it is below, the cloud might act like a “ceiling” in downtrends.
Watching Price vs the EMAs
If the price pulls back toward the cloud (or toward one of the EMAs) and then bounces back up, that’s a signal that the uptrend might continue.
If the price undercuts (goes a bit below) one of the EMAs or the cloud and then returns above it, that can also be a signal. It suggests that even though there was a temporary drop, buyers stepped in.
Using the Three EMAs for Confirmation
Because the script uses three EMAs, you can see how tightly or loosely they are spaced.
If all three EMAs are broadly aligned (for example, in an uptrend: shorter length above longer length, each pulling from reliable price source), that gives more confidence in trend strength.
If the middle EMA (or different source/timeframe) is holding up as support while others are above, it strengthens signal.
Entry & Exit Points
Entry: For example, after a pullback toward the cloud or “mid‐EMA”, wait for price to show a bounce up. That could be a better entry than buying at the top.
Stop Loss / Risk: You might place a stop loss just below the cloud or the lowest of your selected EMAs so that if price breaks through, the idea is invalidated.
Profit Target: Could be a recent high, resistance level, or a fixed reward-risk multiple (for example aiming to make twice what you risked).
Practical Steps for New Traders
Set up the EMAs
Choose simple lengths like 10, 21, 50.
For example, EMA #1 = length 10, source Close, timeframe “current chart”; EMA #2 = length 21, source (H+L)/2; EMA #3 = length 50, maybe timeframe daily.
Observe the Price Action
When price moves up, then dips, see if it comes back near the shaded cloud or one of the EMAs.
See if the dip touches the EMAs lightly (not a big drop) and then price starts climbing again.
Look for undercuts
If price briefly goes below a line (or below cloud) and then closes back above, that’s undercut + recovery. That bounce back is often meaningful.
Manage risk
Only put in money you can afford to lose.
Use small position size until you get comfortable.
Use stop-loss (as mentioned) in case the price doesn’t bounce as expected.
Practice
Put this indicator on charts (stocks you follow) in past time periods. See how price behaved with pullbacks / undercuts relative to the EMAs & cloud. This helps you learn to see signals.
What It Doesn’t Do (and What to Be Careful Of)
It doesn’t predict the future — it simply shows zones and trends. Price can still break down through the cloud.
In a “choppy” market (i.e. when price is going up and down without a clear trend), signals from EMAs / clouds are less reliable. You’ll get more “false bounces.”
Under / overshoots & big news events can break through clean levels, so always watch for confirmation (volume, price behavior) before putting big money in.

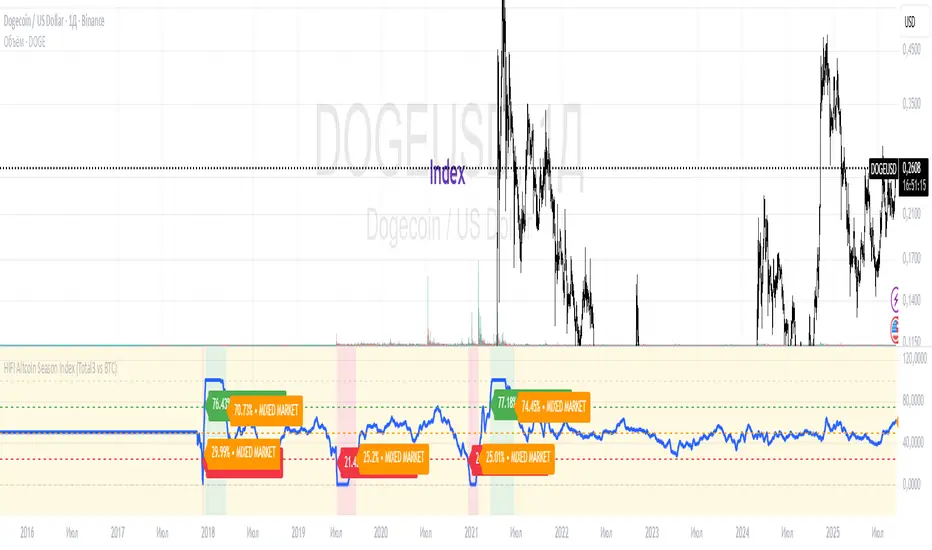
HIFI Altcoin Season Index (Total3 vs BTC)This indicator helps you determine whether the crypto market is in an "altcoin season" or a "bitcoin season." It doesn't compare every single altcoin to Bitcoin individually; instead, it uses a more efficient approach.
Methodology
The index calculates the difference in price performance over a selected period (default 90 days) between the total market capitalization of altcoins without Ethereum (TOTAL3) and Bitcoin (BTC).
Interpretation
Value above 75: TOTAL3 is showing significantly stronger growth than BTC, indicating an ALTCOIN SEASON. 🚀
Value below 25: BTC is outperforming TOTAL3, indicating a BITCOIN SEASON. 👑
Value between 25 and 75: The market is in a mixed or neutral phase. 🤷
Benefits
This method avoids the technical limitations of Pine Script when requesting data for a large number of symbols, making the indicator stable and reliable.
Disclaimer: This indicator is a tool for market analysis and should not be considered financial advice.
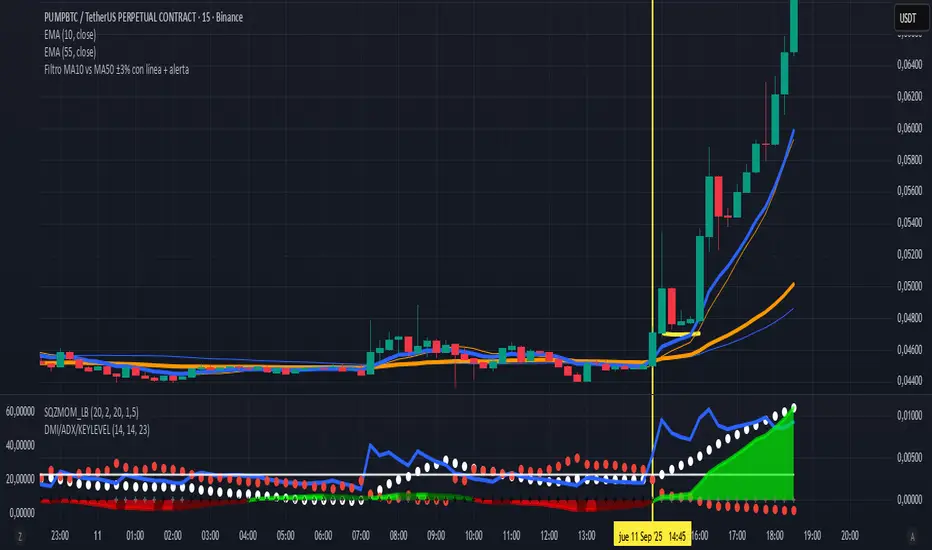
Filtro MA10 vs MA50 ±3% con línea + alertaesto va a determinar la comprension y similitud de las ema de 10 y la ema 50, permiendo ver la compresion de la fuerza
This will determine the understanding and similarity of the 10 ema and the 50 ema, allowing us to see the compression of the force
Open Interest OverlayOpen Interest Overlay
Overview
This indicator displays Open Interest (OI) data directly on your price chart as an overlay, eliminating the need for separate panes while preserving authentic OI movement patterns. Perfect for traders who want to analyze OI correlations without sacrificing chart real estate.
Key Features
📊 Smart Price Scaling
• Automatically maps Open Interest values to fit within your chart's price range
• Preserves all directional movements, timing, and relative magnitude relationships
• Uses official TradingView Open Interest feed for accuracy
🎨 Full Customization
• Custom Colors: Choose your own colors for rising/falling OI (defaults: teal/red)
• Line Style: Toggle between step-line (traditional) or smooth line display
• Optional Fill: Shade area between OI line and mid-price for better visual reference
• Smoothing Options: Apply moving average smoothing to reduce noise
⚙️ Intelligent Settings
• Normalization Window: 300-bar lookback (customizable) for scaling calculations
• Auto Timeframe: Uses daily data for intraday charts on traditional assets, chart timeframe for crypto
• Real Value Display: Shows actual (unscaled) OI value on the last bar
How It Works
The indicator performs proportional mapping of Open Interest data:
1. Calculates OI range (high/low) over the lookback period
2. Maps this range to your chart's price range during the same period
3. Displays OI movements that maintain authentic patterns and timing
Perfect For
✅ Correlation Analysis - See how OI moves with price in real-time
✅ Divergence Spotting - Identify when OI and price trends diverge
✅ Clean Charts - No need for separate panes or window splitting
✅ Pattern Recognition - Spot OI building/declining during key price levels
✅ Cross-Market Analysis - View any symbol's OI overlay on your current chart (e.g., Bitcoin OI while viewing Ethereum prices)
What You Get vs Traditional OI Indicators
Advantages:
• Authentic OI movement patterns preserved
• Direct visual correlation with price action
• No chart real estate sacrifice
• Immediate trend and divergence recognition
Trade-offs:
• Shows relative OI changes rather than absolute values
• Scaling is relative to the selected lookback period
Ideal For
• Day traders monitoring intraday OI flow
• Swing traders analyzing OI trends with price movements
• Futures traders tracking institutional interest
• Anyone wanting clean, correlation-focused OI analysis
Compatible With
• Futures contracts with Open Interest data
• Any timeframe (auto-adjusts for optimal data)
• All TradingView-supported OI symbols

Table Logic ExtractorTable Logic Extractor v2.0
Advanced multi-timeframe analysis with intelligent trade recommendations!
Overview:
This sophisticated indicator provides comprehensive market analysis through multiple technical indicators and timeframes. It combines EMA analysis, RSI momentum, MACD signals, Bollinger Bands, volume analysis, divergence detection, and intelligent trade recommendations with support/resistance distance calculations and trading style detection.
Key Features:
✅ Multi-Indicator Analysis - EMA, RSI, MACD, Bollinger Bands, Volume, ATR
✅ Multi-Timeframe Analysis - M1, M5, M15, M30 trend comparison
✅ Divergence Detection - Bullish and bearish divergence with strength calculation
✅ Support/Resistance Analysis - Distance calculations with Fibonacci levels
✅ Trading Style Detection - Trend, Range, Breakout, Scalping identification
✅ Intelligent Trade Signals - Style-based trade recommendations with confidence levels
✅ Risk Management - Stop Loss and Take Profit calculations
✅ Comprehensive Table - Real-time analysis with 14 different metrics
How It Works:
The indicator uses advanced analysis:
• Multi-Timeframe - M1, M5, M15, M30 trend analysis
• Style Detection - Automatic trading style identification
• S/R Analysis - Fibonacci-based support/resistance levels
• Weighted Scoring - EMA (2.0), RSI (1.5), MACD (1.5), BB (1.0), Volume (1.0)
• Intelligent Signals - Style-based trade recommendations
Trading Style Detection:
• TREND TRADING - Strong trend + aligned timeframes (Green)
• RANGE TRADING - Low volatility + sideways movement (Yellow)
• BREAKOUT TRADING - High volume + near levels (Orange)
• SCALPING - High volatility + quick moves (Red)
Information Table (14 Metrics):
Real-time display showing:
• ATR volatility with signal (HIGH/MED/LOW/NORMAL VOL)
• Divergence status with strength percentage
• S/R Distance with Fibonacci levels
• Stop Loss (2.0:1 ratio) and Take Profit 1 (1.5:1 ratio)
• Multi-Timeframe analysis (M1, M5, M15, M30)
• Scalping signals with confidence levels
• Current trend with strength percentage
• Intelligent trade recommendations
Trade Recommendations:
• TREND BUY/SELL - All timeframes aligned (High confidence)
• SHORT-TERM BUY/SELL - M5 signal only (Medium confidence)
• SCALPING BUY/SELL - M5 vs higher timeframes (Low confidence)
• WAIT - No clear signal (No confidence)
Support/Resistance Analysis:
• Fibonacci Levels: 23.6%, 38.2%, 50% retracements
• Distance Categories: Very Near (Red), Near (Orange), Medium (Yellow), Far (Green)
• ATR-based distance measurement
• Real-time proximity alerts
Scalping Detection:
Specialized signals based on:
• High volatility (ATR ratio > 1.5)
• Quick price moves (fast momentum)
• Volume confirmation (high volume spikes)
• RSI extremes (oversold/overbought)
Settings:
• EMA - Fast (9), Slow (21), Trend (50)
• RSI - Length (14), Overbought (70), Oversold (30)
• MACD - Fast (12), Slow (26), Signal (9)
• Bollinger Bands - Length (20), Multiplier (2.0)
• ATR - Length (14) for volatility measurement
• Volume Threshold - 1.5x average volume
• Divergence - Lookback (3), Threshold (0.5)
Best Practices:
🎯 Adapt strategy to detected trading style
📊 Use multi-timeframe analysis for confirmation
⚡ Monitor S/R distances for entry timing
🛡️ Always use calculated Stop Loss levels
🔍 Watch for divergence signals
📈 Follow intelligent trade recommendations
Pro Tips:
• Table provides all essential information in one place
• Trading style detection helps adapt your strategy
• S/R distance shows proximity to key levels
• Confidence levels indicate signal reliability
• Multi-timeframe alignment increases success rate
• Scalping signals work best in high volatility
Alerts:
• Trend Change Alert - "Trend changed across timeframes"
• Divergence Alert - "Divergence detected"
• Scalping Alert - "Scalping opportunity"
• Trade Signal Alert - "Trade recommendation available"
Version 2.0 Improvements:
• Advanced multi-timeframe analysis (M1, M5, M15, M30)
• Intelligent trading style detection
• Comprehensive support/resistance analysis
• Professional trade recommendations with confidence levels
• Scalping detection with specialized signals
• Risk management with calculated SL/TP levels
• 14-metric comprehensive information table
Created with ❤️ for the trading community
This indicator is free to use for both commercial and non-commercial purposes.

Bitcoin vs. Gold correlation with lagBTC vs Gold (Lag) + Correlation — multi-timeframe, publication notes
What it does
Plots Gold on the same chart as Bitcoin, with a configurable lead/lag.
Lets you choose how the series is displayed:
Gold shifted forward (+lag on chart) — shows gold ahead of BTC on the time axis (visual offset).
Gold aligned to BTC (gold lag) — standard alignment; gold is lagged for calculation and plotted in place.
BTC 200D Lag (BTC shifted forward) — visualizes BTC shifted forward (like popular “BTC 200D Lag” charts).
Computes Pearson correlations between BTC (no lag) and Gold (with lag) over multiple lookback windows equivalent to:
30d, 60d, 90d, 180d, 365d, 2y (730d), 3y (1095d), 5y (1825d).
Shows a table with the correlation values, automatically scaled to the current timeframe.
Why this is useful
A common macro claim is that BTC tends to follow Gold with a delay (e.g., ~200 trading days). This tool lets you:
Visually advance Gold (or BTC) to see that lead-lag relationship on the chart.
Quantify the relationship with rolling correlations.
Switch timeframes (D/W/M/…): everything automatically stays in sync.
Quick start
Open a BTC chart (any exchange).
Add the indicator.
Set Gold symbol (default TVC:GOLD; alternatives: OANDA:XAUUSD, COMEX:GC1!, etc.).
Choose Lag value and Lag unit (Days/Weeks/Months/Years/Bars).
Pick Visual Mode:
To mirror those “BTC 200D Lag” posts: choose “BTC 200D Lag (BTC shifted forward)” with 200 Days.
To view Gold 200D ahead of BTC: select “Gold shifted forward (+lag on chart)” with 200 Days.
Keep Rebase to 100 ON for an apples-to-apples visual scale. (You can move the study to the left price scale if needed.)
Inputs
Gold symbol: external series to pair with BTC.
Lag value: numeric value.
Lag unit: Days, Weeks, Months (≈30d), Years (≈365d), or direct Bars.
Visual mode:
Gold shifted forward (+lag on chart) → gold is offset to the right by the lag (visual only).
Gold aligned to BTC (gold lag) → standard plot (no visual offset); correlations still use lagged gold.
BTC 200D Lag (BTC shifted forward) → BTC is offset to the right by the lag (visual only).
Rebase to 100 (visual): rescales each series to 100 on its first valid bar for clearer comparison.
Show gold without lag (debug): optional reference line.
Show price tag for gold (lag): toggles the track price label.
Timeframe handling
The study uses the current chart timeframe for both BTC and Gold (timeframe.period).
Lag in time units (Days/Weeks/Months/Years) is internally converted to an integer number of bars of the active timeframe (using timeframe.in_seconds).
Example: on W (weekly), 200 days ≈ 29 bars.
On intraday timeframes, days are converted proportionally.
Correlation math
Correlation = ta.correlation(BTC, Gold_lagged, length_in_bars)
Lookback lengths are the bar-equivalents of 30/60/90/180/365/730/1095/1825 days in the active timeframe.
Important: correlations are computed on prices (not returns). If you prefer returns-based correlation (often more statistically robust), duplicate the script and replace price inputs with change(close) or ta.roc(close, 1).
Reading the table
Window: nominal day label (e.g., 30d, 1y, 5y).
Bars (TF): how many bars that window equals on the current timeframe.
Correlation: Pearson coefficient . Background tint shows intensity and sign.
Tips & caveats
Visual offsets (offset=) move series on screen only; they don’t affect the math. The math always uses BTC (no lag) × Gold (lagged).
With large lags on high timeframes, early bars will be na (normal). Scroll forward / reduce lag.
If your Gold feed doesn’t load, try an alternative symbol that your plan supports.
Rebase to 100 helps visibility when BTC ($100k) and Gold ($2k) share a scale.
Months/Years use 30/365-day approximations. For exact control, use Days or Bars.
Correlations on very short lengths or sparse data can be unstable; consider the longer windows for sturdier signals.
This is a visual/analytical tool, not a trading signal. Always apply independent risk management.
Suggested setups
Replicate “BTC 200D Lag” charts:
Visual Mode: BTC 200D Lag (BTC shifted forward)
Lag: 200 Days
Rebase: ON
Gold leads BTC (Gold ahead):
Visual Mode: Gold shifted forward (+lag on chart)
Lag: 200 Days
Rebase: ON
Compatibility: Pine v6, overlay study.
Best with: BTCUSD (any exchange) + a reliable Gold feed.
Author’s note: Lead-lag relationships are not stable over time; treat correlations as descriptive, not predictive.

Composite Time ProfileComposite Time Profile Overlay (CTPO) - Market Profile Compositing Tool
Automatically composite multiple time periods to identify key areas of balance and market structure
What is the Composite Time Profile Overlay?
The Composite Time Profile Overlay (CTPO) is a Pine Script indicator that automatically composites multiple time periods to identify key areas of balance and market structure. It's designed for traders who use market profile concepts and need to quickly identify where price is likely to find support or resistance.
The indicator analyzes TPO (Time Price Opportunity) data across different timeframes and merges overlapping profiles to create composite levels that represent the most significant areas of balance. This helps you spot where institutional traders are likely to make decisions based on accumulated price action.
Why Use CTPO for Market Profile Trading?
Eliminate Manual Compositing Work
Instead of manually drawing and compositing profiles across different timeframes, CTPO does this automatically. You get instant access to composite levels without spending time analyzing each individual period.
Spot Areas of Balance Quickly
The indicator highlights the most significant areas of balance by compositing overlapping profiles. These areas often act as support and resistance levels because they represent where the most trading activity occurred across multiple time periods.
Focus on What Matters
Rather than getting lost in individual session profiles, CTPO shows you the composite levels that have been validated across multiple timeframes. This helps you focus on the levels that are most likely to hold.
How CTPO Works for Market Profile Traders
Automatic Profile Compositing
CTPO uses a proprietary algorithm that:
- Identifies period boundaries based on your selected timeframe (sessions, daily, weekly, monthly, or auto-detection)
- Calculates TPO profiles for each period using the C2M (Composite 2 Method) row sizing calculation
- Merges overlapping profiles using configurable overlap thresholds (default 50% overlap required)
- Updates composite levels as new price action develops in real-time
Key Levels for Market Profile Analysis
The indicator displays:
- Value Area High (VAH) and Value Area Low (VAL) levels calculated from composite TPO data
- Point of Control (POC) levels where most trading occurred across all composited periods
- Composite zones representing areas of balance with configurable transparency
- 1.618 Fibonacci extensions for breakout targets based on composite range
Multiple Timeframe Support
- Sessions: For intraday market profile analysis
- Daily: For swing trading with daily profiles
- Weekly: For position trading with weekly structure
- Monthly: For long-term market profile analysis
- Auto: Automatically selects timeframe based on your chart
Trading Applications for Market Profile Users
Support and Resistance Trading
Use composite levels as dynamic support and resistance zones. These levels often hold because they represent areas where significant trading decisions were made across multiple timeframes.
Breakout Trading
When composite levels break, they often lead to significant moves. The indicator calculates 1.618 Fibonacci extensions to give you clear targets for breakout trades.
Mean Reversion Strategies
Value Area levels represent the price range where most trading activity occurred. These levels often act as magnets, drawing price back when it moves too far from the mean.
Institutional Level Analysis
Composite levels represent areas where institutional traders have made significant decisions. These levels often hold more weight than traditional technical analysis levels because they're based on actual trading activity.
Key Features for Market Profile Traders
Smart Compositing Logic
- Automatic overlap detection using price range intersection algorithms
- Configurable overlap thresholds (minimum 50% overlap required for merging)
- Dead composite identification (profiles that become engulfed by newer composites)
- Real-time updates as new price action develops using barstate.islast optimization
Visual Customization
- Customizable colors for active, broken, and dead composites
- Adjustable transparency levels for each composite state
- Premium/Discount zone highlighting based on current price vs composite range
- TPO aggression coloring using TPO distribution analysis to identify buying/selling pressure
- Fibonacci level extensions with 1.618 target calculations based on composite range
Clean Chart Presentation
- Only shows the most relevant composite levels (maximum 10 active composites)
- Eliminates clutter from individual session profiles
- Focuses on areas of balance that matter most to current price action
Real-World Trading Examples
Day Trading with Session Composites
Use session-based composites to identify intraday areas of balance. The VAH and VAL levels often act as natural profit targets and stop-loss levels for scalping strategies.
Swing Trading with Daily Composites
Daily composites provide excellent swing trading levels. Look for price reactions at composite zones and use the 1.618 extensions for profit targets.
Position Trading with Weekly Composites
Weekly composites help identify major trend changes and long-term areas of balance. These levels often hold for months or even years.
Risk Management
Composite levels provide natural stop-loss levels. If a composite level breaks, it often signals a significant shift in market sentiment, making it an ideal place to exit losing positions.
Why Composite Levels Work
Composite levels work because they represent areas where significant trading decisions were made across multiple timeframes. When price returns to these levels, traders often remember the previous price action and make similar decisions, creating self-fulfilling prophecies.
The compositing process uses a proprietary algorithm that ensures only levels validated across multiple time periods are displayed. This means you're looking at levels that have proven their significance through actual market behavior, not just random technical levels.
Technical Foundation
The indicator uses TPO (Time Price Opportunity) data combined with price action analysis to identify areas of balance. The C2M row sizing method ensures accurate profile calculations, while the overlap detection algorithm (minimum 50% price range intersection) ensures only truly significant composites are displayed. The algorithm calculates row size based on ATR (Average True Range) divided by 10, then converts to tick size for precise level calculations.
How the Code Actually Works
1. Period Detection and ATR Calculation
The code first determines the appropriate timeframe based on your chart:
- 1m-5m charts: Session-based profiles
- 15m-2h charts: Daily profiles
- 4h charts: Weekly profiles
- 1D charts: Monthly profiles
For each period type, it calculates the number of bars needed for ATR calculation:
- Sessions: 540 minutes divided by chart timeframe
- Daily: 1440 minutes divided by chart timeframe
- Weekly: 7 days worth of minutes divided by chart timeframe
- Monthly: 30 days worth of minutes divided by chart timeframe
2. C2M Row Size Calculation
The code calculates True Range for each bar in the determined period:
- True Range = max(high-low, |high-prevClose|, |low-prevClose|)
- Averages all True Range values to get ATR
- Row Size = (ATR / 10) converted to tick size
- This ensures each TPO row represents a meaningful price movement
3. TPO Profile Generation
For each period, the code:
- Creates price levels from lowest to highest price in the range
- Each level is separated by the calculated row size
- Counts how many bars touch each price level (TPO count)
- Finds the level with highest count = Point of Control (POC)
- Calculates Value Area by expanding from POC until 68.27% of total TPO blocks are included
4. Overlap Detection Algorithm
When a new profile is created, the code checks if it overlaps with existing composites:
- Calculates overlap range = min(currentVAH, prevVAH) - max(currentVAL, prevVAL)
- Calculates current profile range = currentVAH - currentVAL
- Overlap percentage = (overlap range / current profile range) * 100
- If overlap >= 50%, profiles are merged into a composite
5. Composite Merging Logic
When profiles overlap, the code creates a new composite by:
- Taking the earliest start bar and latest end bar
- Using the wider VAH/VAL range (max of both profiles)
- Keeping the POC from the profile with more TPO blocks
- Marking the composite as "active" until price breaks through
6. Real-Time Updates
The code uses barstate.islast to optimize performance:
- Only recalculates on the last bar of each period
- Updates active composite with live price action if enabled
- Cleans up old composites to prevent memory issues
- Redraws all visual elements from scratch each bar
7. Visual Rendering System
The code uses arrays to manage drawing objects:
- Clears all lines/boxes arrays on every bar
- Iterates through composites array to redraw everything
- Uses different colors for active, broken, and dead composites
- Calculates 1.618 Fibonacci extensions for broken composites
Getting Started with CTPO
Step 1: Choose Your Timeframe
Select the period type that matches your trading style:
- Use "Sessions" for day trading
- Use "Daily" for swing trading
- Use "Weekly" for position trading
- Use "Auto" to let the indicator choose based on your chart timeframe
Step 2: Customize the Display
Adjust colors, transparency, and display options to match your charting preferences. The indicator offers extensive customization options to ensure it fits seamlessly into your existing analysis.
Step 3: Identify Key Levels
Look for:
- Composite zones (blue boxes) - major areas of balance
- VAH/VAL lines - value area boundaries
- POC lines - areas of highest trading activity
- 1.618 extension lines - breakout targets
Step 4: Develop Your Strategy
Use these levels to:
- Set entry points near composite zones
- Place stop losses beyond composite levels
- Take profits at 1.618 extension levels
- Identify trend changes when major composites break
Perfect for Market Profile Traders
If you're already using market profile concepts in your trading, CTPO eliminates the manual work of compositing profiles across different timeframes. Instead of spending time analyzing each individual period, you get instant access to the composite levels that matter most.
The indicator's automated compositing process ensures you're always looking at the most relevant areas of balance, while its real-time updates keep you informed of changes as they happen. Whether you're a day trader looking for intraday levels or a position trader analyzing long-term structure, CTPO provides the market profile intelligence you need to succeed.
Streamline Your Market Profile Analysis
Stop wasting time on manual compositing. Let CTPO do the heavy lifting while you focus on executing profitable trades based on areas of balance that actually matter.
Ready to Streamline Your Market Profile Trading?
Add the Composite Time Profile Overlay to your charts today and experience the difference that automated profile compositing can make in your trading performance.

Quantile Regression Bands [BackQuant]Quantile Regression Bands
Tail-aware trend channeling built from quantiles of real errors, not just standard deviations.
What it does
This indicator fits a simple linear trend over a rolling lookback and then measures how price has actually deviated from that trend during the window. It then places two pairs of bands at user-chosen quantiles of those deviations (inner and outer). Because bands are based on empirical quantiles rather than a symmetric standard deviation, they adapt to skewed and fat-tailed behaviour and often hug price better in trending or asymmetric markets.
Why “quantile” bands instead of Bollinger-style bands?
Bollinger Bands assume a (roughly) symmetric spread around the mean; quantiles don’t—upper and lower bands can sit at different distances if the error distribution is skewed.
Quantiles are robust to outliers; a single shock won’t inflate the bands for many bars.
You can choose tails precisely (e.g., 1%/99% or 5%/95%) to match your risk appetite.
How it works (intuitive)
Center line — a rolling linear regression approximates the local trend.
Residuals — for each bar in the lookback, the indicator looks at the gap between actual price and where the line “expected” price to be.
Quantiles — those gaps are sorted; you select which percentiles become your inner/outer offsets.
Bands — the chosen quantile offsets are added to the current end of the regression line to draw parallel support/resistance rails.
Smoothing — a light EMA can be applied to reduce jitter in the line and bands.
What you see
Center (linear regression) line (optional).
Inner quantile bands (e.g., 25th/75th) with optional translucent fill.
Outer quantile bands (e.g., 1st/99th) with a multi-step gradient to visualise “tail zones.”
Optional bar coloring: bars trend-colored by whether price is rising above or falling below the center line.
Alerts when price crosses the outer bands (upper or lower).
How to read it
Trend & drift — the slope of the center line is your local trend. Persistent closes on the same side of the center line indicate directional drift.
Pullbacks — tags of the inner band often mark routine pullbacks within trend. Reaction back to the center line can be used for continuation entries/partials.
Tails & squeezes — outer-band touches highlight statistically rare excursions for the chosen window. Frequent outer-band activity can signal regime change or volatility expansion.
Asymmetry — if the upper band sits much further from the center than the lower (or vice versa), recent behaviour has been skewed. Trade management can be adjusted accordingly (e.g., wider take-profit upslope than downslope).
A simple trend interpretation can be derived from the bar colouring
Good use-cases
Volatility-aware mean reversion — fade moves into outer bands back toward the center when trend is flat.
Trend participation — buy pullbacks to the inner band above a rising center; flip logic for shorts below a falling center.
Risk framing — set dynamic stops/targets at quantile rails so position sizing respects recent tail behaviour rather than fixed ticks.
Inputs (quick guide)
Source — price input used for the fit (default: close).
Lookback Length — bars in the regression window and residual sample. Longer = smoother, slower bands; shorter = tighter, more reactive.
Inner/Outer Quantiles (τ) — choose your “typical” vs “tail” levels (e.g., 0.25/0.75 inner, 0.01/0.99 outer).
Show toggles — independently toggle center line, inner bands, outer bands, and their fills.
Colors & transparency — customize band and fill appearance; gradient shading highlights the tail zone.
Band Smoothing Length — small EMA on lines to reduce stair-step artefacts without meaningfully changing levels.
Bar Coloring — optional trend tint from the center line’s momentum.
Practical settings
Swing trading — Length 75–150; inner τ = 0.25/0.75, outer τ = 0.05/0.95.
Intraday — Length 50–100 for liquid futures/FX; consider 0.20/0.80 inner and 0.02/0.98 outer in high-vol assets.
Crypto — Because of fat tails, try slightly wider outers (0.01/0.99) and keep smoothing at 2–4 to tame weekend jumps.
Signal ideas
Continuation — in an uptrend, look for pullback into the lower inner band with a close back above the center as a timing cue.
Exhaustion probe — in ranges, first touch of an outer band followed by a rejection candle back inside the inner band often precedes mean-reversion swings.
Regime shift — repeated closes beyond an outer band or a sharp re-tilt in the center line can mark a new trend phase; adjust tactics (stop-following along the opposite inner band).
Alerts included
“Price Crosses Upper Outer Band” — potential overextension or breakout risk.
“Price Crosses Lower Outer Band” — potential capitulation or breakdown risk.
Notes
The fit and quantiles are computed on a fixed rolling window and do not repaint; bands update as the window moves forward.
Quantiles are based on the recent distribution; if conditions change abruptly, expect band widths and skew to adapt over the next few bars.
Parameter choices directly shape behaviour: longer windows favour stability, tighter inner quantiles increase touch frequency, and extreme outer quantiles highlight only the rarest moves.
Final thought
Quantile bands answer a simple question: “How unusual is this move given the current trend and the way price has been missing it lately?” By scoring that question with real, distribution-aware limits rather than one-size-fits-all volatility you get cleaner pullback zones in trends, more honest “extreme” tags in ranges, and a framework for risk that matches the market’s recent personality.

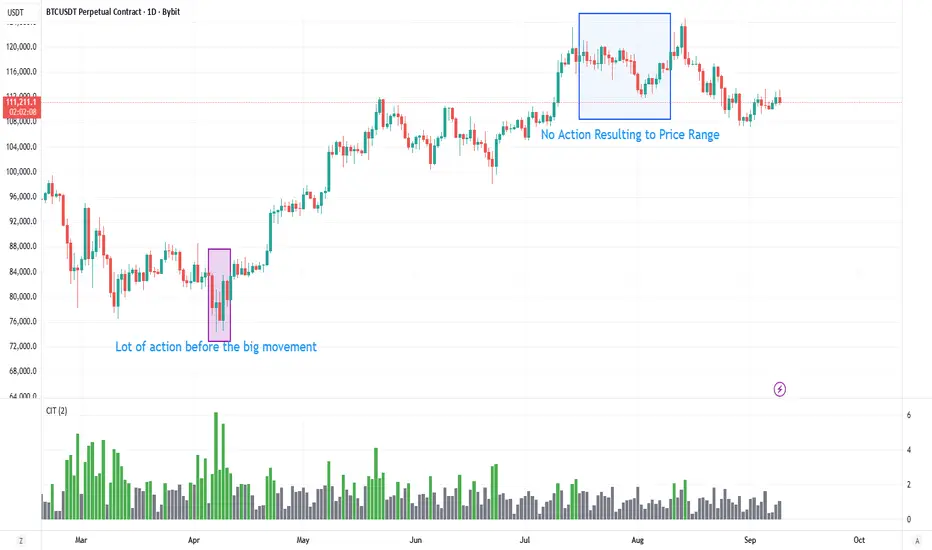
Contract Interest Turnover T3 [T69]Overview
--------
Contract Interest Turnover (CIT) estimates how “churny” a crypto derivatives market is by comparing the amount traded in a bar to the base stock of outstanding contracts (open interest). It normalizes both Volume and Open Interest (OI) by Price (Close), then plots a Turnover Rate = (Volume/Close) ÷ (OI/Close) as colored columns. Higher values = faster contract recycling (strong momentum / hype potential).
Features
--------
- Auto-fetch OI: Pulls OI via request.security(_OI, …) when the exchange/symbol exposes an OI stream on TradingView.
- Price-normalized comparison: Converts both Volume and OI into comparable notional terms by dividing each by Close.
- Turnover columns with threshold: Color the columns green once Turnover ≥ your set threshold; gray otherwise.
- Status-line readouts: Displays normalized Volume and OI values for quick sanity checks.
- Crypto-aware timeframe: Uses chart TF for crypto; forces daily OI when not crypto to avoid noisy intraday pulls.
How to Use
----------
1. Add the script on a perpetual/futures symbol that has OI on TradingView (e.g., BTC perps where an _OI feed exists).
2. Watch the Turnover Rate bars: spikes above your threshold flag sessions where contracts are actively flipping.
3. Interpret spikes as a signal of movement or activity — it does not specify price direction, only that the market is engaged and contracts are being traded more intensely than usual.
Configuration
-------------
- Interest Turnover Threshold (default 1.0): colors columns green when Turnover ≥ threshold. Tune per market’s typical churn profile.
Under the Hood (Formulas & Logic)
---------------------------------
- Fetch OI
oiClose ← request.security(ticker.standard(syminfo.tickerid) + "_OI", timeframe, close) with ignore_invalid_symbol = true.
If none is found, the script throws a clear runtime error.
- Normalize to price
vol_norm = volume / close
oi_norm = oiClose / close
This converts both to a common notional basis so their ratio is meaningful even as price changes.
- Turnover Rate
turnover = vol_norm / oi_norm
Interpretation: fraction/multiples of the outstanding contract base traded in the bar. Color = green if turnover ≥ threshold.
Why Open Interest ≈ “Float” Proxy
---------------------------------
In stocks, float ≈ shares the public can trade. In derivatives, there are no “shares,” so Open Interest acts as the live stock of active contracts. It’s the best proxy for “what’s available in play” because it counts open positions that persist across bars. Using Volume ÷ OI mirrors stock float-turnover logic: how fast the tradable base is being recycled each period.
Why Normalize by Price
----------------------
Derivatives volume and OI may be reported in contracts, not notional value. One contract’s economic weight changes with price (especially on inverse contracts). Dividing both Volume and OI by Close:
- Puts them on a comparable notional footing.
- Prevents false spikes purely from price moves.
- Makes Turnover comparable across time even as price trends.
Advanced Tips
-------------
- Calibrate threshold: Start from the 80th–90th percentile of the last 60–90 bars of Turnover; set the threshold a touch below that to surface early heat.
- Add OI-delta: Layer an OI change histogram (current − prior) to separate new positioning from pure churn.
- Linear vs inverse: For linear (USDT-margined) contracts, the normalization still works and keeps visuals consistent; for inverse, it’s essential.
Limitations
-----------
- Data availability: Works only if your symbol exposes an _OI feed on TradingView; otherwise it errors out.
- Exchange conventions: Volume units differ by venue (contracts, coin, notional). Normalization mitigates, but cross-symbol comparisons still need caution.
- Intrabar gaps: OI is typically end-of-bar; rapid intrabar shifts won’t appear until the bar closes.
Notes
-----
- Designed primarily for crypto derivatives. For non-crypto, the script blanks OI to avoid misleading plots and uses a daily TF when needed.
Credit
------
- Concept & data: Built for TradingView data feeds.
- Acknowledgment: Credit to TradingView default indicator as requested.
- Source: This write-up reflects the logic present in your uploaded script.
Disclaimer
----------
Markets move; indicators simplify. Use with position sizing, hard stops, and catalyst awareness. The Turnover Rate flags activity, not direction.
TURT Donchian Ladder v3.13How to trade TURT+ with the v3.13 script
1) Pick the system & arm the entry
• In the script, choose System = S1 (20D) or S2 (55D).
The HUD always shows both rails for reference, but the ladder (Entry/+Adds) uses the system you pick.
• Your Entry is shown as Pivot + 0.1×N (rounded).
• Place a stop-limit “parent” order at that Entry price. (Classic Turtle uses an entry stop; I suggest a tight limit offset so you don’t chase a blow-through.)
• Initial stop = N2 = Entry − 2×N (rounded). Put that in immediately.
If you like only confirming on a bar close, leave confirmClose = true and place the parent after the close that breaks out. If you want intrabar fills, set confirmClose = false and keep the stop-limit active intraday.
2) Size it the way you planned
• Set acctEquity / riskCapPct / posCapUSD / entryFrac / entryRiskFrac / sizingMode.
• HUD gives Rec Entry Qty (when flat) and, once in, it shows:
• Next Rung (price)
• Suggested AddShares (honors RiskCap & PosCap)
• Proj Stop if Add (ratcheted N2)
• A limiter note (RiskCap or PosCap) if you’re constrained.
3) After entry fills, stage the ADDs (only at fixed +N steps)
• Adds are NOT “every Donchian break.” You add only at:
• Add-1 = Entry + 0.5×N
• Add-2 = Entry + 1.0×N
• Add-3 = Entry + 1.5×N (optional)
• Use the HUD’s Suggested AddShares for each rung (it respects your RiskCap/PosCap).
• Place stop-limit orders for each add (either immediately as a contingent OTO chain that arms only after Entry fills, or you arm each add when price approaches—your choice).
• On each add fill, ratchet the catastrophic stop for the entire position to Last-Add − 2×N (the script and HUD show Proj Stop if Add so you know where it will land). Never move it lower.
Pro tip: If your broker supports OTO/OTOCO:
• OTO parent = Entry stop-limit.
• On fill, fire an OCO with the N2 stop (no target), and also stage child stop-limits for Add-1 / Add-2 / Add-3 with the correct sizes. If your broker can’t chain that deep, just use the script’s alerts (Entry/Add-1/Add-2/Add-3/Exits) to place/adjust orders quickly.
4) Exits (two layers)
• Catastrophic (always on): the N2 stop you’re ratcheting (Last-Add − 2×N).
• Trend exits (runner):
• S1: 10-low close (HUD shows it).
• S2: 20-low close (HUD shows it).
• Profit-taking (optional): sell ~50% at +2.5R to +3R vs current N2; let the runner trail with 10-low/20-low. You can keep N2 as a hard backstop.
5) Should you pre-set everything or buy live?
Both work; pick the style that fits you:
Preset (Turtle-pure, rules-based)
• ✅ You won’t miss the breakout; minimal discretion.
• ✅ Broker handles fills even if you’re away.
• ⚠️ You may get the occasional intraday “poke” (use confirmClose + place after close if you want fewer).
Buy on break manually
• ✅ Lets you check tape/volume or any extra gates before clicking.
• ⚠️ Higher chance of slippage or of simply missing the trigger.
A nice hybrid: place the Entry order, then arm Add-1/2/3 when price is nearing each rung and the HUD shows Suggested AddShares > 0 (green risk read).
⸻
6) Quick checklist per trade
1. System: S1 or S2?
2. Levels: Entry / Add-1 / Add-2 / Add-3 / 10-low / 20-low / N2 (rounded).
3. Sizing: confirm RiskCap/PosCap; HUD shows Suggested AddShares and limiter.
4. Orders:
• Parent Entry stop-limit.
• N2 stop (rounded).
• Stage adds (stop-limits) with sizes from HUD.
5. On fill: ratchet stop to Last-Add − 2×N; adjust remaining adds and sizes.
⸻
7) Example with your MU position (pattern)
• You’re already in: set entryQty and entryPman in the inputs to match your fill.
• HUD now focuses on Next Rung, Suggested AddShares, and Proj Stop if Add.
• If Suggested AddShares = 0 and limiter says RiskCap or PosCap, you’ll still see the next rung price and Proj Stop if Add so you can decide whether to override.
⸻
Bottom line
• Entry: buy the Donchian breakout + 0.1N with a stop-limit (Turtle style).
• Adds: only at +0.5N steps, sized by HUD; not on every future Donchian break.
• Stops: keep (and ratchet) the N2 catastrophic; trail runner on 10-low / 20-low.
If you want, tell me your broker/platform and I’ll map this to exact order ticket types (stop-limit/OTO/OCO) and a tiny checklist you can keep next to your screen.

Deadband Hysteresis Supertrend [BackQuant]Deadband Hysteresis Supertrend
A two-stage trend tool that first filters price with a deadband baseline, then runs a Supertrend around that baseline with optional flip hysteresis and ATR-based adverse exits.
What this is
A hybrid of two ideas:
Deadband Hysteresis Baseline that only advances when price pulls far enough from the baseline to matter. This suppresses micro noise and gives you a stable centerline.
Supertrend bands wrapped around that baseline instead of raw price. Flips are further gated by an extra margin so side changes are more deliberate.
The goal is fewer whipsaws in chop and clearer regime identification during trends.
How it works (high level)
Deadband step — compute a per-bar “deadband” size from one of four modes: ATR, Percent of price, Ticks, or Points. If price deviates from the baseline by more than this amount, move the baseline forward by a fraction of the excess. If not, hold the line.
Centered Supertrend — build upper and lower bands around the baseline using ATR and a user factor. Track the usual trailing logic that tightens a band while price moves in its favor.
Flip hysteresis — require price to exceed the active band by an extra flip offset × ATR before switching sides. This adds stickiness at the boundary.
Adverse exit — once a side is taken, trigger an exit if price moves against the entry by K × ATR .
If you would like to check out the filter by itself:
What it plots
DBHF baseline (optional) as a smooth centerline.
DBHF Supertrend as the active trailing band.
Candle coloring by trend side for quick read.
Signal markers 𝕃 and 𝕊 at flips plus ✖ on adverse exits.
Inputs that matter
Price Source — series being filtered. Close is typical. HL2 or HLC3 can be steadier.
Deadband mode — ATR, Percent, Ticks, or Points. This defines the “it’s big enough to matter” zone.
ATR Length / Mult (DBHF) — only used when mode = ATR. Larger values widen the do-nothing zone.
Percent / Ticks / Points — alternatives to ATR; pick what fits your market’s convention.
Enter Mult — scales the deadband you must clear before the baseline moves. Increase to filter more noise.
Response — fraction of the excess applied to baseline movement. Higher responds faster; lower is smoother.
Supertrend ATR Period & Factor — traditional band size controls; higher factor widens and flips less often.
Flip Offset ATR — extra ATR buffer required to flip. Useful in choppy regimes.
Adverse Stop K·ATR — per-trade danger brake that forces an exit if price moves K×ATR against entry.
UI — toggle baseline, supertrend, signals, and bar painting; choose long and short colors.
How to read it
Green regime — candles painted long and the Supertrend running below price. Pullbacks toward the baseline that fail to breach the opposite band often resume higher.
Red regime — candles painted short and the Supertrend running above price. Rallies that cannot reclaim the band may roll over.
Frequent side swaps — reduce sensitivity by increasing Enter Mult, using ATR mode, raising the Supertrend factor, or adding Flip Offset ATR.
Use cases
Bias filter — allow entries only in the direction of the current side. Use your preferred triggers inside that bias.
Trailing logic — treat the active band as a dynamic stop. If the side flips or an adverse K·ATR exit prints, reduce or close exposure.
Regime map — on higher timeframes, the combination baseline + band produces a clean up vs down template for allocation decisions.
Tuning guidance
Fast markets — ATR deadband, modest Enter Mult (0.8–1.2), response 0.2–0.35, Supertrend factor 1.7–2.2, small Flip Offset (0.2–0.5 ATR).
Choppy ranges — widen deadband or raise Enter Mult, lower response, and add more Flip Offset so flips require stronger evidence.
Slow trends — longer ATR periods and higher Supertrend factor to keep you on side longer; use a conservative adverse K.
Included alerts
DBHF ST Long — side flips to long.
DBHF ST Short — side flips to short.
Adverse Exit Long / Short — K·ATR stop triggers against the current side.
Strengths
Deadbanded baseline reduces micro whipsaws before Supertrend logic even begins.
Flip hysteresis adds a second layer of confirmation at the boundary.
Optional adverse ATR stop provides a uniform risk cut across assets and regimes.
Clear visuals and minimal parameters to adjust for symbol behavior.
Putting it together
Think of this tool as two decisions layered into one view. The deadband baseline answers “does this move even count,” then the Supertrend wrapped around that baseline answers “if it counts, which side should I be on and where do I flip.” When both parts agree you tend to stay on the correct side of a trend for longer, and when they disagree you get an early warning that conditions are changing.
When the baseline bends and price cannot reclaim the opposite band , momentum is usually continuing. Pullbacks into the baseline that stall before the far band often resolve in trend.
When the baseline flattens and the bands compress , expect indecision. Use the Flip Offset ATR to avoid reacting to the first feint. Wait for a clean band breach with follow through.
When an adverse K·ATR exit prints while the side has not flipped , treat it as a risk event rather than a full regime change. Many users cut size, re-enter only if the side reasserts, and let the next flip confirm a new trend.
Final thoughts
Deadband Hysteresis Supertrend is best read as a regime lens. The baseline defines your tolerance for noise, the bands define your trailing structure, and the flip offset plus adverse ATR stop define how forgiving or strict you want to be at the boundary. On strong trends it helps you hold through shallow shakeouts. In choppy conditions it encourages patience until price does something meaningful. Start with settings that reflect the cadence of your market, observe how often flips occur, then nudge the deadband and flip offset until the tool spends most of its time describing the move you care about rather than the noise in between.

[davidev] EMA/MA with projection# EMA/MA with projection
## What it is
A lightweight overlay that plots up to three EMAs and one MA (default: 5/21/55 EMAs and 200 MA) and draws a forward projection from the current bar. The projection extrapolates the latest per-bar change (slope) to visualize where each average *could* be in the next N bars—useful for planning entries, dynamic support/resistance, and anticipating crossovers.
Note: The projection is a simple linear extrapolation of the most recent change. It is not a prediction or signal.
## How it works
Computes EMA1, EMA2, EMA3 and MA (SMA) on your chosen sources.
On the last bar only, it draws a short line segment ahead by `Bars Ahead`, using the most recent change (`ta.change()`) × number of bars to project the line.
Lines are **reused** and updated each tick (no clutter), and deleted on historical bars to avoid artifacts.
## Good for
Visualizing **dynamic levels** slightly ahead of price.
Quickly gauging **momentum** and **slope** of your moving averages.
Sketching possible **crossover timing** (e.g., 5 vs 21 EMA) without changing timeframe.
Cleaner charting: projection only renders on the last bar, so historical candles stay uncluttered.
## Tips
Combine with your market structure/volume tools; the projection helps **plan**, not predict.
Shorter EMAs react faster and will show more pronounced projected moves; longer MAs remain steadier.
Increase `Bars Ahead` on higher timeframes; keep it small on scalping charts to avoid overreach.

Global Liquidity Proxy (Fed + ECB + BoJ + PBoC)Global Liquidity Proxy (Fed + ECB + BoJ + PBoC) Vs BTC

Hurst Momentum Oscillator | AlphaNattHurst Momentum Oscillator | AlphaNatt
An adaptive oscillator that combines the Hurst Exponent - which identifies whether markets are trending or mean-reverting - with momentum analysis to create signals that automatically adjust to market regime.
"The Hurst Exponent reveals a hidden truth: markets aren't always trending. This oscillator knows when to ride momentum and when to fade it."
━━━━━━━━━━━━━━━━━━━━━━━━━━━━━━━━━━━━━━━━
📐 THE MATHEMATICS
Hurst Exponent (H):
Measures the long-term memory of time series:
H > 0.5: Trending (persistent) behavior
H = 0.5: Random walk
H < 0.5: Mean-reverting behavior
Originally developed for analyzing Nile river flooding patterns, now used in:
Fractal market analysis
Network traffic prediction
Climate modeling
Financial markets
The Innovation:
This oscillator multiplies momentum by the Hurst coefficient:
When trending (H > 0.5): Momentum is amplified
When mean-reverting (H < 0.5): Momentum is reduced
Result: Adaptive signals based on market regime
━━━━━━━━━━━━━━━━━━━━━━━━━━━━━━━━━━━━━━━━
💎 KEY ADVANTAGES
Regime Adaptive: Automatically adjusts to trending vs ranging markets
False Signal Reduction: Reduces momentum signals in mean-reverting markets
Trend Amplification: Stronger signals when trends are persistent
Mathematical Edge: Based on fractal dimension analysis
No Repainting: All calculations on historical data
━━━━━━━━━━━━━━━━━━━━━━━━━━━━━━━━━━━━━━━━
📊 TRADING SIGNALS
Visual Interpretation:
Cyan zones: Bullish momentum in trending market
Magenta zones: Bearish momentum or mean reversion
Background tint: Blue = trending, Pink = mean-reverting
Gradient intensity: Signal strength
Trading Strategies:
1. Trend Following:
Trade momentum signals when background is blue (trending)
2. Mean Reversion:
Fade extreme readings when background is pink
3. Regime Transition:
Watch for background color changes as early warning
━━━━━━━━━━━━━━━━━━━━━━━━━━━━━━━━━━━━━━━━
🎯 OPTIMAL USAGE
Best Conditions:
Strong trending markets (crypto bull runs)
Clear ranging markets (forex sessions)
Regime transitions
Multi-timeframe analysis
Market Applications:
Crypto: Excellent for identifying trend persistence
Forex: Detects when pairs are ranging
Stocks: Identifies momentum stocks
Commodities: Catches persistent trends
━━━━━━━━━━━━━━━━━━━━━━━━━━━━━━━━━━━━━━━━
Developed by AlphaNatt | Fractal Market Analysis
Version: 1.0
Classification: Adaptive Regime Oscillator
Not financial advice. Always DYOR.

ICT Sweep + FVG Entry (v6) • Pro Pack 📌 ICT Sweep + FVG Entry Pro Pack
This indicator combines key ICT price action concepts with practical execution tools to help traders spot high-probability setups faster and more objectively. It’s designed for scalpers and intraday traders who want to keep their chart clean but never miss critical market structure events.
🔑 Features
Liquidity Pools (HTF)
• Auto-detects recent swing highs/lows from higher timeframes (5m/15m).
• Draws both lines and optional rectangles/zones for clear liquidity areas.
Liquidity Sweeps (BSL/SSL)
• Identifies when price sweeps above/below liquidity pools and rejects back.
• Optional Grade-A sweep filter (wick size + strong re-entry).
Fair Value Gaps (FVGs)
• Highlights bullish/bearish imbalances.
• Optional midline (50%) entry for precision.
• Auto-invalidation when price fully closes inside the gap.
Killzones (New York)
• Highlights AM (9:30–11:30) and PM (14:00–15:30) killzones.
• Option to block signals outside killzones for higher strike rate.
Bias Badge (DR50)
• Displays if price is trading in a Bull, Bear, or Range context based on displacement range midpoint.
SMT Assist (NQ vs ES)
• Detects simple divergences between indices:
Bearish SMT → NQ makes HH while ES doesn’t.
Bullish SMT → NQ makes LL while ES doesn’t.
SL/TP Helper & R:R Label
• Automatically draws stop loss (at sweep extreme) and target (opposite pool or recent swing).
• Displays expected Risk:Reward ratio and blocks entries if below your chosen minimum.
Filters
• ATR filter ensures signals only appear in sufficient volatility.
• Sweep quality filter avoids weak wicks and fake-outs.
🎯 How to Use
Start on HTF (5m/15m) → Identify liquidity zones and bias.
Drop to LTF (1m) → Wait for a liquidity sweep confirmation.
Check for FVG in the sweep’s direction → Look for retest entry.
Use the SL/TP helper to validate your risk/reward before taking the trade.
Focus entries during NY Killzones for maximum effectiveness.
✅ Why this helps
This tool reduces screen time and hesitation by automating repetitive ICT concepts:
Liquidity pools, sweeps, and FVGs are marked automatically.
Killzone timing and SMT divergence are simplified.
Clear visual signals for entries with built-in RR filter help keep your trading mechanical.
⚠️ Disclaimer: This script is for educational purposes only. It does not provide financial advice or guarantee results. Always use proper risk management.

SAP121212 — Close vs VWAP + Optional RSI (Signals)This indicator combines Supertrend, VWAP with bands, and an optional RSI filter to generate Buy/Sell signals.
How it works
Supertrend Flip (ATR-based): Detects when trend direction changes (from bearish to bullish, or bullish to bearish).
VWAP Band Filter: Signals only trigger if the candle close is beyond the VWAP bands:
Buy = Supertrend flips up AND close > VWAP Upper Band
Sell = Supertrend flips down AND close < VWAP Lower Band
Optional RSI Filter:
Buy requires RSI < 20
Sell requires RSI > 80
Can be enabled/disabled in settings.
Features
Choice of VWAP band calculation mode: Standard Deviation or ATR.
Adjustable ATR/StDev length and multiplier for VWAP bands.
Toggle Supertrend, VWAP lines, and Buy/Sell labels.
Alerts included: add alerts on BUY or SELL conditions (use Once Per Bar Close to avoid intrabar signals).
Use
Works best on intraday or higher timeframes where VWAP is relevant.
Use the RSI filter for more selective signals.
Can be combined with your own stop-loss and risk management rules.
⚠️ Disclaimer: This script is for educational and research purposes only. It is not financial advice. Always test thoroughly and trade at your own risk.
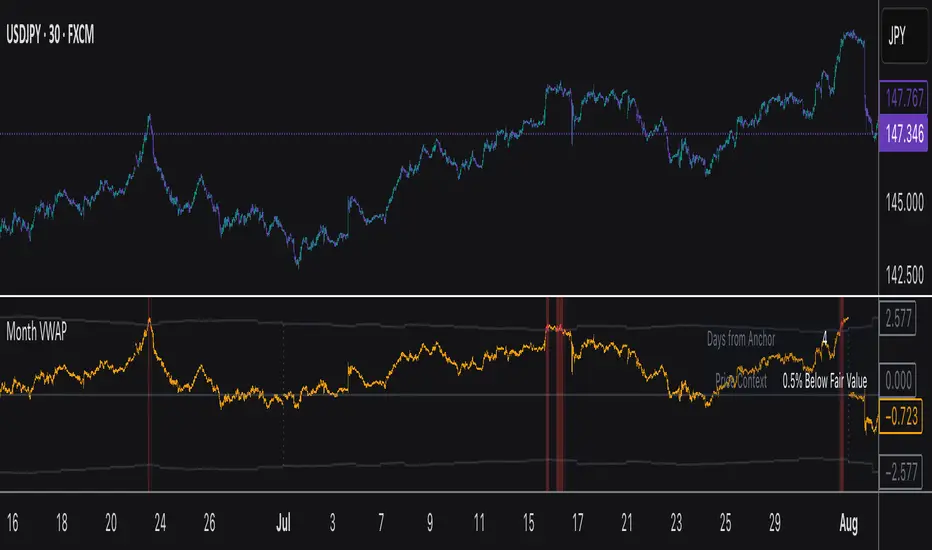
Monthly VWAPDescription
This indicator identifies potential mean reversion opportunities by tracking price deviations from monthly VWAP with dynamic volatility-adjusted thresholds.
Core Logic:
The indicator monitors when price moves significantly away from monthly VWAP and looks for potential reversal opportunities. It uses ATR-based dynamic thresholds that adapt to current market volatility, combined with volume confirmation to filter out weak signals.
Key Features:
Adaptive Thresholds: ATR-based bands that adjust to market volatility
Volume Confirmation: Requires average volume spike to validate signals
Monthly Reset: VWAP anchors reset each month for fresh reference levels
Visual Clarity: Color-coded deviation line with background highlights for active signals
Info Panel: Shows days from anchor and current price context vs fair value
Signal Generation:
Buy Signal: Price below monthly VWAP by threshold amount with elevated volume
Sell Signal: Price above monthly VWAP by threshold amount with elevated volume
Neutral: Price within threshold range or insufficient volume
Best Used For:
Mean reversion strategies in ranging markets
Identifying potential oversold/overbought conditions
Understanding price position relative to monthly fair value
Swing Guardrail — 30-sec Midterm Check (EBITDA Margin & EV/EBITDWhat it does
Before a short-term swing entry, this indicator right-sizes positions by a quick midterm (3–12m) durability screen using two fundamentals:
EBITDA Margin (TTM) → earning power / operational resilience
EV/EBITDA (TTM) → price tag vs earning capacity (payback feel)
A high-contrast table (top-right) shows both metrics and a verdict:
PASS — both meet thresholds → normal size
HALF — only one meets → reduce size
FAIL — neither meets → avoid
Why check “midterm” for a short-term trade?
Short swings still face earnings/news gaps, failed breakouts, and regime shifts. Names with weak margins or stretched valuation tend to break faster and deeper. A 30-sec durability check helps you:
Filter fragile setups (avoid expensive + weakening names)
Stabilize drawdowns (size down when quality/price don’t align)
Keep timing unchanged while improving risk-adjusted returns
Inputs (defaults)
Min EBITDA Margin % (TTM): 8%
Max EV/EBITDA (TTM): 12
Dark chart? High-contrast colors
How to use with a swing system
Get your entry from price/volume (e.g., Ichimoku cloud break, Kijun reclaim, Tenkan>Kijun; or your A/B/C rules).
Run this check only to set size (not timing).
Optional alerts: Once per bar close for PASS / HALF / FAIL.
Size mapping & event guard
PASS → 100% of your planned size
HALF → ~50% size / tighter stops
FAIL → watchlist only
If earnings < ~10 JP business days, drop one tier; ≤3 days → avoid.
Sector guides (tweak as needed)
Software/Internet: Margin ≥ 15%, EV/EBITDA ≤ 18
Industrials/Consumer: Margin ≥ 8%, EV/EBITDA ≤ 12
Retail: Margin ≥ 5–7%, EV/EBITDA ≤ 10–12
Edge cases / substitutions
Banks/Insurers/REITs or net-cash/negative EBITDA: EV/EBITDA may mislead → consider Net Debt/EBITDA or sector metrics (CET1/LTV/DSCR).
Sparse data / fresh listings: numbers may be NA until updates.
Notes & limitations
Data via request.financial() (TTM/most-recent). Some tickers/regions can show NA until fundamentals refresh.
This is a risk-screen / sizing tool, not a buy/sell signal.
Disclaimer
Educational use only. Not investment advice.
日本語
タイトル
スイング用ガードレール―中期“壊れにくさ”30秒チェック(EBITDAマージン & EV/EBITDA, TTM)
概要
短期スイングのエントリー前に、中期(3〜12か月)の耐久性を2指標で素早く確認し、ポジションサイズを決めるためのツールです。
EBITDAマージン(TTM):事業の稼ぐ力・体力
EV/EBITDA(TTM):その体力に対する“値札”(回収年数の感覚)
右上の高コントラスト表に数値と判定を表示:
PASS:両方クリア → 通常サイズ
HALF:片方のみ → サイズ半分
FAIL:両方NG → 見送り
なぜ短期でも“中期”を確認?
短期でも決算・ニュースのギャップ、ブレイク失敗、地合い転換は起きます。マージンが弱い/割高すぎる銘柄は崩れやすく、戻りも鈍い傾向。30秒の耐久性チェックで
脆いセットアップを回避
ドローダウンを平準化(サイズで吸収)
タイミングは変えずに、リスク調整後リターンの改善を狙えます。
入力(既定)
最低EBITDAマージン:8%
最大EV/EBITDA:12
黒背景向け:高コントラスト表示
使い方(スイング手法と併用)
まずは価格シグナル(一目の雲上抜け/基準線回復/転換線>基準線、またはA/B/Cルール)。
本インジの判定でサイズのみ決定(エントリーのタイミングは出しません)。
任意でバー確定アラート(PASS/HALF/FAIL)を設定。
サイズ目安 & イベント抑制
PASS:計画サイズ100%
HALF:約50%(ストップもタイトに)
FAIL:見送り
決算まで≦10営業日なら1段階サイズダウン、≦3営業日は原則見送り。
セクター目安(調整推奨)
ソフト/ネット:マージン 15%以上、EV/EBITDA 18以下
工業/一般消費:マージン 8%以上、EV/EBITDA 12以下
小売:マージン 5〜7%以上、EV/EBITDA 10〜12以下
例外・代替
銀行・保険・REIT/ネットキャッシュ・EBITDAマイナス:EV/EBITDAは適さない場合 → Net Debt/EBITDAやCET1/LTV/DSCR等で補助。
新規上場・データ薄:更新までNAのことあり。
注意
データは request.financial() を使用。更新前はNAの可能性。
本ツールはリスク確認/サイズ調整用で、売買シグナルではありません。
免責
情報提供のみ。投資判断は自己責任で。

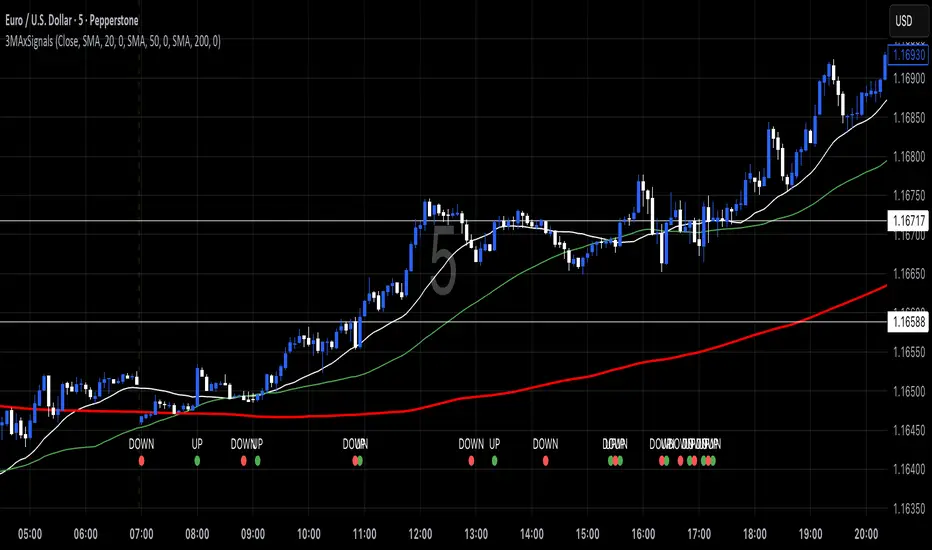
3 MA's with Crossing SignalsPlots three fully configurable moving averages on one chart and prints/alerts BUY/SELL signals when price crosses your chosen MA(s). Built to match TradingView’s built-ins exactly.
Features
Per-line MA type: SMA, EMA, SMMA (RMA), WMA, VWMA
Per-line settings: length, color, offset
Source control: Close, Open, High, Low, HL2, HLC3, OHLC4
Optional Heikin Ashi calculation for both the MAs and the cross price
Toggle signals vs MA1 / MA2 / MA3 independently
Alert conditions for every cross (ready for “Once per bar close”)
How signals work
UP when the selected price stream crosses above the chosen MA
DOWN when it crosses below
Signals/alerts follow your selected source (and HA toggle) to keep everything consistent.
Candle Spread + ATR SMA Analysis
This indicator combines elements from two popular open-source scripts — Candle Range Compare
by @oldinvestor
and Objective Analysis of Spread (VSA)
by @Rin-Nin
— into a single tool for analyzing candle spreads (ranges and bodies) in relation to volatility benchmarks.
🔎 What It Does
Candle Decomposition:
Plots total candle ranges (high–low) in gray, for both up and down closes.
Plots up-close bodies (open–close) in white.
Plots down-close bodies in black.
This makes it easy to spot whether volatility comes from real price movement (body) or extended wicks.
ATR & SMA Volatility Bands:
Calculates ATR (Average True Range) and overlays it as a black line.
Plots four volatility envelopes derived from the SMA of the true range:
0.8× (blue, shaded)
1.3× (green)
1.8× (red)
3.0× (purple)
Colored fill zones highlight when candle spreads are below, within, or above key thresholds.
Visual Context:
Track expansion/contraction in spreads.
Compare bullish (white) vs bearish (black) bodies to gauge buying/selling pressure.
Identify when candles stretch beyond typical volatility ranges.
📈 How To Use It
VSA context: Wide down bars (black) beyond ATR bands may suggest supply; wide up bars (white) may indicate demand.
Trend confirmation: Expanding ranges above average thresholds (green/red/purple bands) often confirm momentum.
Reversal potential: Small bodies but large ranges (gray + wicks) frequently appear at turning points.
Volatility filter: Use ATR bands to filter trades — e.g., only act when candle ranges exceed 1.3× or 1.8× SMA thresholds.
🙏 Credits
This script is inspired by and combines ideas from:
Candle Range Compare
by @oldinvestor
Objective Analysis of Spread (VSA)
by @Rin-Nin
Big thanks to both authors for their valuable contributions to the TradingView community.
One thing I couldnt quite get to work is being able to display up and down wicks like in the candle range compare, so I just add that indicator to the chart as well, uncheck everything but the wick plots and there it is.

AVWAP+RSI Confluence — 1R TesterRSI + 1R ATR - Monthly P\&L (v4)
WHAT THIS STRATEGY DOES (OVERVIEW)
* Pine strategy (v4) that combines a simple momentum trigger with a symmetric 1R ATR risk model and an on-chart Monthly/Yearly P\&L table.
* Momentum filter: trades only when RSI crosses its own SMA in the direction of the trend (price vs Trend EMA).
* Risk engine: exits use fixed 1R ATR brackets captured at entry (no drifting targets/stops).
* Accounting: the table aggregates percentage returns by month and year using strategy equity.
ENTRY LOGIC (LONGS & OPTIONAL SHORTS)
Indicators used:
* RSI(rsiLen) and its SMA: SMA(RSI, rsiMaLen)
* Trend filter: EMA(emaTrendLen) on price
Longs:
1. RSI crosses above its RSI SMA
2. RSI > rsiBuyThr (filters weak momentum)
3. Close > EMA(emaTrendLen)
Shorts (optional via enableShort):
1. RSI crosses below its RSI SMA
2. RSI < rsiSellThr
3. Close < EMA(emaTrendLen)
EXIT LOGIC AND RISK MODEL (1R ATR)
* On entry, snapshot ATR(atrLen) into atrAtEntry and the average fill price into entryPx.
* Longs: stop = entryPx - ATR \* atrMult; target = entryPx + ATR \* atrMult
* Shorts: mirrored.
* Stops and targets are posted immediately and remain fixed for the life of the trade.
POSITION SIZING AND COSTS
* Default position size: 25% of equity per trade (adjustable in Properties/inputs).
* Commission percent and a small slippage are set in strategy() so backtests include friction by default.
MONTHLY / YEARLY P\&L TABLE (HOW IT WORKS)
* Uses strategy equity to compute bar returns: equity / equity\ - 1.
* Compounds bar returns into current month and current year; commits each finished period at month/year change (or last bar).
* Renders rows as years; columns Jan..Dec plus a Year total column.
* Cells colored by sign; precision and maximum rows are controlled by inputs.
* Values represent percentage returns, not currency P\&L.
VISUAL AIDS
* Two pivot trails (pivot high/low) are plotted for context only; they do not affect entries or exits.
CUSTOMIZATION TIPS
* Raise rsiBuyThr (long) or lower rsiSellThr (short) to filter weak momentum.
* Increase emaTrendLen to tighten trend alignment.
* Adjust atrLen and atrMult to fit your timeframe/instrument volatility.
* Leave enableShort = false if you prefer long-only behavior or shorting is constrained.
NON-REPAINTING AND BACKTEST NOTES
* Signals use bar-close crosses of built-in indicators (RSI, EMA, ATR); no future bars are referenced.
* calc\_on\_every\_tick = true for responsive visuals; Strategy Tester evaluates on bar close in history.
* Backtest stop/limit fills are simulated and may differ from live execution/liquidity.
DISCLAIMERS
* Educational use only. This is not financial advice. Markets involve risk. Past performance does not guarantee future results.
INPUTS (QUICK REFERENCE)
* rsiLen, rsiMaLen, rsiBuyThr, rsiSellThr
* emaTrendLen
* atrLen, atrMult, enableShort
* leftBars, rightBars, prec, showTable, maxYearsRows
SHORT TAGLINE
RSI momentum with 1R ATR brackets and a built-in Monthly/Yearly P\&L table.
TAGS
strategy, RSI, ATR, trend, risk-management, backtest, Pine-v4

Perp Imbalance Zones • Pro (clean)USD Premium (perp vs spot) → (Perp − Spot) / Spot.
Imbalance (z-score of that premium) → how extreme the current premium is relative to its own history over lenPrem bars.
Hysteresis state machine → flips to a SHORT bias when perp-long pressure is extreme; flips to LONG bias when perp-short pressure is extreme. It exits only after the imbalance cools (prevents whipsaw).
Price stretch filter (±σ) → optional Bollinger check so signals only fire when price is already stretched.
HTF confirmation (optional) → require higher-timeframe imbalance to agree with the current-TF bias.
Gradient visuals → line + background tint deepen as |z| grows (more extreme pressure).
What you see on the pane
A single line (z):
Above 0 = perp richer than spot (perp longs pressing).
Below 0 = perp cheaper than spot (perp shorts pressing).
Guides: dotted levels at ±enterZ (entry) and ±exitZ (cool-off/exit).
Background tint:
Red when state = SHORT bias (perp longs heavy).
Blue when state = LONG bias (perp shorts heavy).
Tint intensity scales with |z| (via hotZ).
Labels (optional): prints when bias flips.
Alerts (optional): “Enter SHORT/LONG bias” and “Exit bias”.
How to use it (playbook)
Attach & set symbols
Put the script on your chart.
Set Spot symbol and Perp symbol to the venue you trade (e.g., BINANCE:BTCUSDT + BINANCE:BTCUSDTPERP).
Read the bias
SHORT bias (red background): perp longs over-extended. Look for short entries if price is at resistance, σ-stretched, or your PA system agrees.
LONG bias (blue background): perp shorts over-extended. Look for long entries at support/σ-stretched down.
Entries
Use the bias flip as a context/confirm. Combine with your structure trigger (OB/level sweep, rejection wick, micro-break in market structure, etc.).
If useSigma=true, only trade when price is already ≥ upper band (shorts) or ≤ lower band (longs).
Exits
Bias auto-exits when |z| falls below exitZ.
You can also take profits at your levels or when the line fades back toward 0 while price mean-reverts to the middle band.
Tuning (what each knob does)
enterZ / exitZ (signal strictness + hysteresis)
Higher enterZ → fewer, cleaner signals (e.g., 1.8–2.2).
exitZ should be lower than enterZ (e.g., 0.6–1.0) to prevent flicker.
lenPrem (context window for z)
Larger (50–100) = steadier baseline, fewer signals.
Smaller (20–30) = more reactive, more signals.
smoothLen (EMA on z)
2–3 = snappier; 5–7 = smoother/laggier but cleaner.
useSigma, bbLen, bbK (price-stretch filter)
On filters chop. Try bbLen=100, bbK=1.0–1.5.
Off if you want more frequent signals or you already gate with your own σ/Keltner.
useHTF, htfTF, htfZmin (trend/confirmation)
Turn on to require higher-TF imbalance agreement (e.g., trading 1H → confirm with 4H htfTF=240, htfZmin≈0.6–1.0).
hotZ (visual intensity)
Lower (2.0–2.5) heats up faster; higher (4.0) is more subtle.
Ready-made presets
Conservative swing (fewer, higher-conviction):
enterZ=2.0, exitZ=1.0, lenPrem=60–80, smoothLen=5, useSigma=true, bbK=1.5, useHTF=true (240/0.8).
Balanced intraday (default feel):
enterZ=1.6–1.8, exitZ=0.8–1.0, lenPrem=50, smoothLen=3–4, useSigma=true, bbK=1.0–1.25, useHTF=false/true depending on trendiness.
Aggressive scalping (more signals):
enterZ=1.2–1.4, exitZ=0.6–0.8, lenPrem=20–30, smoothLen=2–3, useSigma=false, useHTF=false.
Practical tips
Don’t trade the line in isolation. Use it to time trades into your levels: VWAP bands, Monday high/low, prior POC/VAH/VAL, order blocks, etc.
Perp-led reversals often snap—be ready to scale out quickly back to mid-bands.
Venue matters. Keep spot & perp from the same exchange family to avoid cross-venue quirks.
Alerts: enable after you’ve tuned thresholds for your timeframe so you only get high-quality pings.
