Dual Volume Profiles: Session + Rolling (Range Delineation)Dual Volume Profiles: Session + Rolling (Range Delineation)
INTRO
This is a probability-centric take on volume profile. I treat the volume histogram as an empirical PDF over price, updated in real time, which makes multi-modality (multiple acceptance basins) explicit rather than assumed away. The immediate benefit is operational: if we can read the shape of the distribution, we can infer likely reversion levels (POC), acceptance boundaries (VAH/VAL), and low-friction corridors (LVNs).
My working hypothesis is that what traders often label “fat tails” or “power-law behavior” at short horizons is frequently a tail-conditioned view of a higher-level Gaussian regime. In other words, child distributions (shorter periodicities) sit within parent distributions (longer periodicities); when price operates in the parent’s tail, the child regime looks heavy-tailed without being fundamentally non-Gaussian. This is consistent with a hierarchical/mixture view and with the spirit of the central limit theorem—Gaussian structure emerges at aggregate scales, while local scales can look non-Gaussian due to nesting and conditioning.
This indicator operationalizes that view by plotting two nested empirical PDFs: a rolling (local) profile and a session-anchored profile. Their confluence makes ranges explicit and turns “regime” into something you can see. For additional nesting, run multiple instances with different lookbacks. When using the default settings combined with a separate daily VP, you effectively get three nested distributions (local → session → daily) on the chart.
This indicator plots two nested distributions side-by-side:
Rolling (Local) Profile — short-window, prorated histogram that “breathes” with price and maps the immediate auction.
Session Anchored Profile — cumulative distribution since the current session start (Premkt → RTH → AH anchoring), revealing the parent regime.
Use their confluence to identify range floors/ceilings, mean-reversion magnets, and low-volume “air pockets” for fast traverses.
What it shows
POC (dashed): central tendency / “magnet” (highest-volume bin).
VAH & VAL (solid): acceptance boundaries enclosing an exact Value Area % around each profile’s POC.
Volume histograms:
Rolling can auto-color by buy/sell dominance over the lookback (green = buying ≥ selling, red = selling > buying).
Session uses a fixed style (blue by default).
Session anchoring (exchange timezone):
Premarket → anchors at 00:00 (midnight).
RTH → anchors at 09:30.
After-hours → anchors at 16:00.
Session display span:
Session Max Span (bars) = 0 → draw from session start → now (anchored).
> 0 → draw a rolling window N bars back → now, while still measuring all volume since session start.
Why it’s useful
Think in terms of nested probability distributions: the rolling node is your local Gaussian; the session node is its parent.
VA↔VA overlap ≈ strong range boundary.
POC↔POC alignment ≈ reliable mean-reversion target.
LVNs (gaps) ≈ low-friction corridors—expect quick moves to the next node.
Quick start
Add to chart (great on 5–10s, 15–60s, 1–5m).
Start with: bins = 240, vaPct = 0.68, barsBack = 60.
Watch for:
First test & rejection at overlapping VALs/VAHs → fade back toward POC.
Acceptance beyond VA (several closes + growing outer-bin mass) → traverse to the next node.
Inputs (detailed)
General
Lookback Bars (Rolling)
Count of most-recent bars for the rolling/local histogram. Larger = smoother node that shifts slower; smaller = more reactive, “breathing” profile.
• Typical: 40–80 on 5–10s charts; 60–120 on 1–5m.
• If you increase this but keep Number of Bins fixed, each bin aggregates more volume (coarser bins).
Number of Bins
Vertical resolution (price buckets) for both rolling and session histograms. Higher = finer detail and crisper LVNs, but more line objects (closer to platform limits).
• Typical: 120–240 on 5–10s; 80–160 on 1–5m.
• If you hit performance or object limits, reduce this first.
Value Area %
Exact central coverage for VAH/VAL around POC. Computed empirically from the histogram (no Gaussian assumption): the algorithm expands from POC outward until the chosen % is enclosed.
• Common: 0.68 (≈“1σ-like”), 0.70 for slightly wider core.
• Smaller = tighter VA (more breakout flags). Larger = wider VA (more reversion bias).
Max Local Profile Width (px)
Horizontal length (in pixels) of the rolling bars/lines and its VA/POC overlays. Visual only (does not affect calculations).
Session Settings
RTH Start/End (exchange tz)
Defines the current session anchor (Premkt=00:00, RTH=your start, AH=your end). The session histogram always measures from the most recent session start and resets at each boundary.
Session Max Span (bars, 0 = full session)
Display window for session drawings (POC/VA/Histogram).
• 0 → draw from session start → now (anchored).
• > 0 → draw N bars back → now (rolling look), while still measuring all volume since session start.
This keeps the “parent” distribution measurable while letting the display track current action.
Local (Rolling) — Visibility
Show Local Profile Bars / POC / VAH & VAL
Toggle each overlay independently. If you approach object limits, disable bars first (POC/VA lines are lighter).
Local (Rolling) — Colors & Widths
Color by Buy/Sell Dominance
Fast uptick/downtick proxy over the rolling window (close vs open):
• Buying ≥ Selling → Bullish Color (default lime).
• Selling > Buying → Bearish Color (default red).
This color drives local bars, local POC, and local VA lines.
• Disable to use fixed Bars Color / POC Color / VA Lines Color.
Bars Transparency (0–100) — alpha for the local histogram (higher = lighter).
Bars Line Width (thickness) — draw thin-line profiles or chunky blocks.
POC Line Width / VA Lines Width — overlay thickness. POC is dashed, VAH/VAL solid by design.
Session — Visibility
Show Session Profile Bars / POC / VAH & VAL
Independent toggles for the session layer.
Session — Colors & Widths
Bars/POC/VA Colors & Line Widths
Fixed palette by design (default blue). These do not change with buy/sell dominance.
• Use transparency and width to make the parent profile prominent or subtle.
• Prefer minimal? Hide session bars; keep only session VA/POC.
Reading the signals (detailed playbook)
Core definitions
POC — highest-volume bin (fair price “magnet”).
VAH/VAL — upper/lower bounds enclosing your Value Area % around POC.
Node — contiguous block of high-volume bins (acceptance).
LVN — low-volume gap between nodes (low friction path).
Rejection vs Acceptance (practical rule)
Rejection at VA edge: 0–1 closes beyond VA and no persistent growth in outer bins.
Acceptance beyond VA: ≥3 closes beyond VA and outer-bin mass grows (e.g., added volume beyond the VA edge ≥ 5–10% of node volume over the last N bars). Treat acceptance as regime change.
Confluence scores (make boundary/target quality objective)
VA overlap strength (range boundary):
C_VA = 1 − |VA_edge_local − VA_edge_session| / ATR(n)
Values near 1.0 = tight overlap (stronger boundary).
Use: if C_VA ≥ 0.6–0.8, treat as high-quality fade zone.
POC alignment (magnet quality):
C_POC = 1 − |POC_local − POC_session| / ATR(n)
Higher C_POC = greater chance a rotation completes to that fair price.
(You can estimate these by eye.)
Setups
1) Range Fade at VA Confluence (mean reversion)
Context: Local VAL/VAH near Session VAL/VAH (tight overlap), clear node, local color not screaming trend (or flips to your side).
Entry: First test & rejection at the overlapped band (wick through ok; prefer close back inside).
Stop: A tick/pip beyond the wider of the two VA edges or beyond the nearest LVN, a small buffer zone can be used to judge whether price is truly rejecting a VAL/VAH or simply probing.
Targets: T1 node mid; T2 POC (size up when C_POC is high).
Flip: If acceptance (rule above) prints, flip bias or stand down.
2) LVN Traverse (continuation)
Context: Price exits VA and enters an LVN with acceptance and growing outer-bin volume.
Entry: Aggressive—first close into LVN; Conservative—retest of the VA edge from the far side (“kiss goodbye”).
Stop: Back inside the prior VA.
Targets: Next node’s VA edge or POC (edge = faster exits; POC = fuller rotations).
Note: Flatter VA edge (shallower curvature) tends to breach more easily.
3) POC→POC Magnet Trade (rotation completion)
Context: Local POC ≈ Session POC (high C_POC).
Entry: Fade a VA touch or pullback inside node, aiming toward the shared POC.
Stop: Past the opposite VA edge or LVN beyond.
Target: The shared POC; optional runner to opposite VA if the node is broad and time-of-day is supportive.
4) Failed Break (Reversion Snap-back)
Context: Push beyond VA fails acceptance (re-enters VA, outer-bin growth stalls/shrinks).
Entry: On the re-entry close, back toward POC.
Stop/Target: Stop just beyond the failed VA; target POC, then opposite VA if momentum persists.
How to read color & shape
Local color = most recent sentiment:
Green = buying ≥ selling; Red = selling > buying (over the rolling window). Treat as context, not a standalone signal. A green local node under a blue session VAH can still be a fade if the parent says “over-valued.”
Shape tells friction:
Fat nodes → rotation-friendly (fade edges).
Sharp LVN gaps → traversal-friendly (momentum continuation).
Time-of-day intuition
Right after session anchor (e.g., RTH 09:30): Session profile is young and moves quickly—treat confluence cautiously.
Mid-session: Cleanest behavior for rotations.
Close / news: Expect more traverses and POC migrations; tighten risk or switch playbooks.
Risk & execution guidance
Use tight, mechanical stops at/just beyond VA or LVN. If you need wide stops to survive noise, your entry is late or the node is unstable.
On micro-timeframes, account for fees & slippage—aim for targets paying ≥2–3× average cost.
If acceptance prints, don’t fight it—flip, reduce size, or stand aside.
Suggested presets
Scalp (5–10s): bins 120–240, barsBack 40–80, vaPct 0.68–0.70, local bars thin (small bar width).
Intraday (1–5m): bins 80–160, barsBack 60–120, vaPct 0.68–0.75, session bars more visible for parent context.
Performance & limits
Reuses line objects to stay under TradingView’s max_lines_count.
Very large bins × multiple overlays can still hit limits—use visibility toggles (hide bars first).
Session drawings use time-based coordinates to avoid “bar index too far” errors.
Known nuances
Rolling buy/sell dominance uses a simple uptick/downtick proxy (close vs open). It’s fast and practical, but it’s not a full tape classifier.
VA boundaries are computed from the empirical histogram—no Gaussian assumption.
This script does not calculate the full daily volume profile. Several other tools already provide that, including TradingView’s built-in Volume Profile indicators. Instead, this indicator focuses on pairing a rolling, short-term volume distribution with a session-wide distribution to make ranges more explicit. It is designed to supplement your use of standard or periodic volume profiles, not replace them. Think of it as a magnifying lens that helps you see where local structure aligns with the broader session.
How to trade it (TL;DR)
Fade overlapping VA bands on first rejection → target POC.
Continue through LVN on acceptance beyond VA → target next node’s VA/POC.
Respect acceptance: ≥3 closes beyond VA + growing outer-bin volume = regime change.
FAQ
Q: Why 68% Value Area?
A: It mirrors the “~1σ” idea, but we compute it exactly from empirical volume, not by assuming a normal distribution.
Q: Why are my profiles thin lines?
A: Increase Bars Line Width for chunkier blocks; reduce for fine, thin-line profiles.
Q: Session bars don’t reach session start—why?
A: Set Session Max Span (bars) = 0 for full anchoring; any positive value draws a rolling window while still measuring from session start.
Changelog (v1.0)
Dual profiles: Rolling + Session with independent POC/VA lines.
Session anchoring (Premkt/RTH/AH) with optional rolling display span.
Dynamic coloring for the rolling profile (buying vs selling).
Fully modular toggles + per-feature colors/widths.
Thin-line rendering via bar line width.
Cerca negli script per "长江电子+半导体行业研究框架培训+pdf"

Transient Impact Model [ScorsoneEnterprises]This indicator is an implementation of the Transient Impact Model. This tool is designed to show the strength the current trades have on where price goes before they decay.
Here are links to more sophisticated research articles about Transient Impact Models than this post arxiv.org and arxiv.org
The way this tool is supposed to work in a simple way, is when impact is high price is sensitive to past volume, past trades being placed. When impact is low, it moves in a way that is more independent from past volume. In a more sophisticated system, perhaps transient impact should be calculated for each trade that is placed, not just the total volume of a past bar. I didn't do it to ensure parameters exist and aren’t na, as well as to have more iterations for optimization. Note that the value will change as volume does, as soon as a new candle occurs with no volume, the values could be dramatically different.
How it works
There are a few components to this script, so we’ll go into the equation and then the other functions used in this script.
// Transient Impact Model
transient_impact(params, price_change, lkb) =>
alpha = array.get(params, 0)
beta = array.get(params, 1)
lambda_ = array.get(params, 2)
instantaneous = alpha * volume
transient = 0.0
for t = 1 to lkb - 1
if na(volume )
break
transient := transient + beta * volume * math.exp(-lambda_ * t)
predicted_change = instantaneous + transient
math.pow(price_change - predicted_change, 2)
The parameters alpha, beta, and lambda all represent a different real thing.
Alpha (α):
Represents the instantaneous impact coefficient. It quantifies the immediate effect of the current volume on the price change. In the equation, instantaneous = alpha * volume , alpha scales the current bar's volume (volume ) to determine how much of the price change is due to immediate market impact. A larger alpha suggests that current volume has a stronger instantaneous influence on price.
Beta (β):
Represents the transient impact coefficient.It measures the lingering effect of past volumes on the current price change. In the loop calculating transient, beta * volume * math.exp(-lambda_ * t) shows that beta scales the volume from previous bars (volume ), contributing to a decaying effect over time. A higher beta indicates a stronger influence from past volumes, though this effect diminishes with time due to the exponential decay factor.
Lambda (λ):
Represents the decay rate of the transient impact.It controls how quickly the influence of past volumes fades over time in the transient component. In the term math.exp(-lambda_ * t), lambda determines the rate of exponential decay, where t is the time lag (in bars). A larger lambda means the impact of past volumes decays faster, while a smaller lambda implies a longer-lasting effect.
So in full.
The instantaneous term, alpha * volume , captures the immediate price impact from the current volume.
The transient term, sum of beta * volume * math.exp(-lambda_ * t) over the lookback period, models the cumulative, decaying effect of past volumes.
The total predicted_change combines these two components and is compared to the actual price change to compute an error term, math.pow(price_change - predicted_change, 2), which the script minimizes to optimize alpha, beta, and lambda.
Other parts of the script.
Objective function:
This is a wrapper function with a function to minimize so we get the best alpha, beta, and lambda values. In this case it is the Transient Impact Function, not something like a log-likelihood function, helps with efficiency for a high iteration count.
Finite Difference Gradient:
This function calculates the gradient of the objective function we spoke about. The gradient is like a directional derivative. Which is like the direction of the rate of change. Which is like the direction of the slope of a hill, we can go up or down a hill. It nudges around the parameter, and calculates the derivative of the parameter. The array of these nudged around parameters is what is returned after they are optimized.
Minimize:
This is the function that actually has the loop and calls the Finite Difference Gradient each time. Here is where the minimizing happens, how we go down the hill. If we are below a tolerance, we are at the bottom of the hill.
Applied
After an initial guess, we optimize the parameters and get the transient impact value. This number is huge, so we apply a log to it to make it more readable. From here we need some way to tell if the value is low or high. We shouldn’t use standard deviation because returns are not normally distributed, an IQR is similar and better for non normal data. We store past transient impact values in an array, so that way we can see the 25th and 90th percentiles of the data as a rolling value. If the current transient impact is above the 90th percentile, it is notably high. If below the 25th percentile, notably low. All of these values are plotted so we can use it as a tool.
Tool examples:
The idea around it is that when impact is low, there is room for big money to get size quickly and move prices around.
Here we see the price reacting in the IQR Bands. We see multiple examples where the value above the 90th percentile, the red line, corresponds to continuations in the trend, and below the 25th percentile, the purple line, corresponds to reversals. There is no guarantee these tools will be perfect, that is outlined in these situations, however there is clearly a correlation in this tool and trend.
This tool works on any timeframe, daily as we saw before, or lower like a two minute. The bands don’t represent a direction, like bullish or bearish, we need to determine that by interpreting price action. We see at open and at close there are the highest values for the transient impact. This is to be expected as these are the times with the highest volume of the trading day.
This works on futures as well as equities with the same context. Volume can be attributed to volatility as well. In volatile situations, more volatility comes in, and we can perceive it through the transient impact value.
Inputs
Users can enter the lookback value.
No tool is perfect, the transient impact value is also not perfect and should not be followed blindly. It is good to use any tool along with discretion and price action.
ctndLibrary "ctnd"
Description:
Double precision algorithm to compute the cumulative trivariate normal distribution
found in A.Genz, Numerical computation of rectangular bivariate and trivariate normal
and t probabilities”, Statistics and Computing, 14, (3), 2004. The cumulative trivariate
normal is needed to price window barrier options, see G.F. Armstrong, Valuation formulae
or window barrier options”, Applied Mathematical Finance, 8, 2001.
References:
link.springer.com
www.tandfonline.com
citeseerx.ist.psu.edu
The Complete Guide to Option Pricing Formulas, 2nd ed. (Espen Gaarder Haug)
CTND(LIMIT1, LIMIT2, LIMIT3, SIGMA1, SIGMA2, SIGMA3)
Returns the Cumulative Trivariate Normal Distribution
Parameters:
LIMIT1 : float,
LIMIT2 : float,
LIMIT3 : float,
SIGMA1 : float,
SIGMA2 : float,
SIGMA3 : float,
Returns: float.

Variety N-Tuple Moving Averages w/ Variety Stepping [Loxx]Variety N-Tuple Moving Averages w/ Variety Stepping is a moving average indicator that allows you to create 1- 30 tuple moving average types; i.e., Double-MA, Triple-MA, Quadruple-MA, Quintuple-MA, ... N-tuple-MA. This version contains 2 different moving average types. For example, using "50" as the depth will give you Quinquagintuple Moving Average. If you'd like to find the name of the moving average type you create with the depth input with this indicator, you can find a list of tuples here: Tuples extrapolated
Due to the coding required to adapt a moving average to fit into this indicator, additional moving average types will be added as they are created to fit into this unique use case. Since this is a work in process, there will be many future updates of this indicator. For now, you can choose from either EMA or RMA.
This indicator is also considered one of the top 10 forex indicators. See details here: forex-station.com
Additionally, this indicator is a computationally faster, more streamlined version of the following indicators with the addition of 6 stepping functions and 6 different bands/channels types.
STD-Stepped, Variety N-Tuple Moving Averages
STD-Stepped, Variety N-Tuple Moving Averages is the standard deviation stepped/filtered indicator of the following indicator
Last but not least, a big shoutout to @lejmer for his help in formulating a looping solution for this streamlined version. this indicator is speedy even at 50 orders deep. You can find his scripts here: www.tradingview.com
How this works
Step 1: Run factorial calculation on the depth value,
Step 2: Calculate weights of nested moving averages
factorial(depth) / (factorial(depth - k) * factorial(k); where depth is the depth and k is the weight position
Examples of coefficient outputs:
6 Depth: 6 15 20 15 6
7 Depth: 7 21 35 35 21 7
8 Depth: 8 28 56 70 56 28 8
9 Depth: 9 36 34 84 126 126 84 36 9
10 Depth: 10 45 120 210 252 210 120 45 10
11 Depth: 11 55 165 330 462 462 330 165 55 11
12 Depth: 12 66 220 495 792 924 792 495 220 66 12
13 Depth: 13 78 286 715 1287 1716 1716 1287 715 286 78 13
Step 3: Apply coefficient to each moving average
For QEMA, which is 5 depth EMA , the calculation is as follows
ema1 = ta. ema ( src , length)
ema2 = ta. ema (ema1, length)
ema3 = ta. ema (ema2, length)
ema4 = ta. ema (ema3, length)
ema5 = ta. ema (ema4, length)
In this new streamlined version, these MA calculations are packed into an array inside loop so Pine doesn't have to keep all possible series information in memory. This is handled with the following code:
temp = array.get(workarr, k + 1) + alpha * (array.get(workarr, k) - array.get(workarr, k + 1))
array.set(workarr, k + 1, temp)
After we pack the array, we apply the coefficients to derive the NTMA:
qema = 5 * ema1 - 10 * ema2 + 10 * ema3 - 5 * ema4 + ema5
Stepping calculations
First off, you can filter by both price and/or MA output. Both price and MA output can be filtered/stepped in their own way. You'll see two selectors in the input settings. Default is ATR ATR. Here's how stepping works in simple terms: if the price/MA output doesn't move by X deviations, then revert to the price/MA output one bar back.
ATR
The average true range (ATR) is a technical analysis indicator, introduced by market technician J. Welles Wilder Jr. in his book New Concepts in Technical Trading Systems, that measures market volatility by decomposing the entire range of an asset price for that period.
Standard Deviation
Standard deviation is a statistic that measures the dispersion of a dataset relative to its mean and is calculated as the square root of the variance. The standard deviation is calculated as the square root of variance by determining each data point's deviation relative to the mean. If the data points are further from the mean, there is a higher deviation within the data set; thus, the more spread out the data, the higher the standard deviation.
Adaptive Deviation
By definition, the Standard Deviation (STD, also represented by the Greek letter sigma σ or the Latin letter s) is a measure that is used to quantify the amount of variation or dispersion of a set of data values. In technical analysis we usually use it to measure the level of current volatility .
Standard Deviation is based on Simple Moving Average calculation for mean value. This version of standard deviation uses the properties of EMA to calculate what can be called a new type of deviation, and since it is based on EMA , we can call it EMA deviation. And added to that, Perry Kaufman's efficiency ratio is used to make it adaptive (since all EMA type calculations are nearly perfect for adapting).
The difference when compared to standard is significant--not just because of EMA usage, but the efficiency ratio makes it a "bit more logical" in very volatile market conditions.
See how this compares to Standard Devaition here:
Adaptive Deviation
Median Absolute Deviation
The median absolute deviation is a measure of statistical dispersion. Moreover, the MAD is a robust statistic, being more resilient to outliers in a data set than the standard deviation. In the standard deviation, the distances from the mean are squared, so large deviations are weighted more heavily, and thus outliers can heavily influence it. In the MAD, the deviations of a small number of outliers are irrelevant.
Because the MAD is a more robust estimator of scale than the sample variance or standard deviation, it works better with distributions without a mean or variance, such as the Cauchy distribution.
For this indicator, I used a manual recreation of the quantile function in Pine Script. This is so users have a full inside view into how this is calculated.
Efficiency-Ratio Adaptive ATR
Average True Range (ATR) is widely used indicator in many occasions for technical analysis . It is calculated as the RMA of true range. This version adds a "twist": it uses Perry Kaufman's Efficiency Ratio to calculate adaptive true range
See how this compares to ATR here:
ER-Adaptive ATR
Mean Absolute Deviation
The mean absolute deviation (MAD) is a measure of variability that indicates the average distance between observations and their mean. MAD uses the original units of the data, which simplifies interpretation. Larger values signify that the data points spread out further from the average. Conversely, lower values correspond to data points bunching closer to it. The mean absolute deviation is also known as the mean deviation and average absolute deviation.
This definition of the mean absolute deviation sounds similar to the standard deviation (SD). While both measure variability, they have different calculations. In recent years, some proponents of MAD have suggested that it replace the SD as the primary measure because it is a simpler concept that better fits real life.
For Pine Coders, this is equivalent of using ta.dev()
Bands/Channels
See the information above for how bands/channels are calculated. After the one of the above deviations is calculated, the channels are calculated as output +/- deviation * multiplier
Signals
Green is uptrend, red is downtrend, yellow "L" signal is Long, fuchsia "S" signal is short.
Included:
Alerts
Loxx's Expanded Source Types
Bar coloring
Signals
6 bands/channels types
6 stepping types
Related indicators
3-Pole Super Smoother w/ EMA-Deviation-Corrected Stepping
STD-Stepped Fast Cosine Transform Moving Average
ATR-Stepped PDF MA

MAMA by EHLERSMESA Adaptive Moving Average aka: Mother of Adaptive Moving Averages:
The MESA Adaptive Moving Average ( MAMA ) adapts to price movement in an
entirely new and unique way. The adapation is based on the rate change of phase as
measured by the Hilbert Transform Discriminator I have previously described.1
The advantage of this method of adaptation is that it features a fast attack average and a
slow decay average so that composite average rapidly ratchets behind price changes
and holds the average value until the next ratchet occurs. The action of MAMA is
shown in Figure 1. Since the average fallback is slow I can build trading systems that
are virtually free of whipsaw trades.
For detailed information of MAMA: (creators' PDF document)
www.mesasoftware.com
Long condition: when MAMA Crosses over FAMA (Following Adaptive Moving Average )
Short condition: when FAMA Crosses over MAMA
(Personally modified LazyBear's version which was originally calculated in degrees instead of radian by applying explanations in the MESA pdf document.http://www.mesasoftware.com/papers/MAMA.pdf)
Creator: John EHLERS

KK_Traders Dynamic Index_Bar HighlightingHey guys,
this is one of my favorite scripts as it represents a whole trading system that has given me very good results!
I have only used it on Bitcoin so far but I am sure it will also work for other instruments.
The original code to this was created by LazyBear, so all props to him for this great script!
I have linked his original post down below.
You can find the full rules to the system in this PDF (which has also been taken from LBs post):
www.forexmt4.com
Here is a short summary of the rules:
Go long when (all conditions have to be met):
The green line is above 50
The green line is above the red line
The green line is above the orange line
The close is above the upper Band of the Price Action Channel
The candles close is above its open
(The green line is below 68)
Go short when (all conditions have to be met):
The green line is below 50
The green line is below the red line
The green line is below the orange line
The close is below the lower band of the Price Action Channel
The candles close is below its open
(The green line is above 32)
Close when:
Any of these conditions aren't true anymore.
I have marked two of the rules in brackets as they seem to cut out a lot of the profits this system generates. You can choose to still use these rules by checking the box that says "Use Original Ruleset" in the options.
The system also contains rules regarding the Heiken Ashi bars. However these aren't as specific as the other rules. This is where your personal judgement comes in and this part is hard to explain. Take a look at the PDF I have linked to get a better understanding.
So far, this is just the TDI trading system and LBs script, now what have I changed?
I have incorporated the Price Action Channel to the system and changed it so that it highlights the bars whenever the system is giving a signal. As long as the bars are green the system is giving a long signal, as long as they are red the system is giving a short signal. Keep in mind that this doesn't consider the bar size of the HA bars. I recommend coloring all bars grey via the chart settings in order to be able to see the bar highlighting properly.
I have also published the Price Action Channel seperately in case some of you wish to view the Channel.
I am fairly new to creating scripts so use it with caution and let me know what you think!
LBs original post:
The seperate Price Action Channel script:

CM Stochastic POP Method 1 - Jake Bernstein_V1A good friend ucsgears recently published a Stochastic Pop Indicator designed by Jake Bernstein with a modified version he found.
I spoke to Jake this morning and asked if he had any updates to his Stochastic POP Trading Method. Attached is a PDF Jake published a while back (Please read for basic rules, which also Includes a New Method). I will release the Additional Method Tomorrow.
Jake asked me to share that he has Updated this Method Recently. Now across all symbols he has found the Stochastic Values of 60 and 30 to be the most profitable. NOTE - This can be Significantly Optimized for certain Symbols/Markets.
Jake Bernstein will be a contributor on TradingView when Backtesting/Strategies are released. Jake is one of the Top Trading System Developers in the world with 45+ years experience and he is going to teach how to create Trading Systems and how to Optimize the correct way.
Below are a few Strategy Results....Soon You Will Be Able To Find Results Like This Yourself on TradingView.com
BackTesting Results Example: EUR-USD Daily Chart Since 01/01/2005
Strategy 1:
Go Long When Stochastic Crosses Above 60. Go Short When Stochastic Crosses Below 30. Exit Long/Short When Stochastic has a Reverse Cross of Entry Value.
Results:
Total Trades = 164
Profit = 50, 126 Pips
Win% = 38.4%
Profit Factor = 1.35
Avg Trade = 306 Pips Profit
***Most Consecutive Wins = 3 ... Most Consecutive Losses = 6
Strategy 2:
Rules - Proprietary Optimization Jake Will Teach. Only Added 1 Additional Exit Rule.
Results:
Total Trades = 164
Profit = 62, 876 Pips!!!
Win% = 38.4%
Profit Factor = 1.44
Avg Trade = 383 Pips Profit
***Most Consecutive Wins = 3 ... Most Consecutive Losses = 6
Strategy 3:
Rules - Proprietary Optimization Jake Will Teach. Only added 1 Additional Exit Rule.
Results:
Winning Percent Increases to 72.6%!!! , Same Amount of Trades.
***Most Consecutive Wins = 21 ...Most Consecutive Losses = 4
Indicator Includes:
-Ability to Color Candles (CheckBox In Inputs Tab)
Green = Long Trade
Blue = No Trade
Red = Short Trade
-Color Coded Stochastic Line based on being Above/Below or In Between Entry Lines.
Link To Jakes PDF with Rules
dl.dropboxusercontent.com

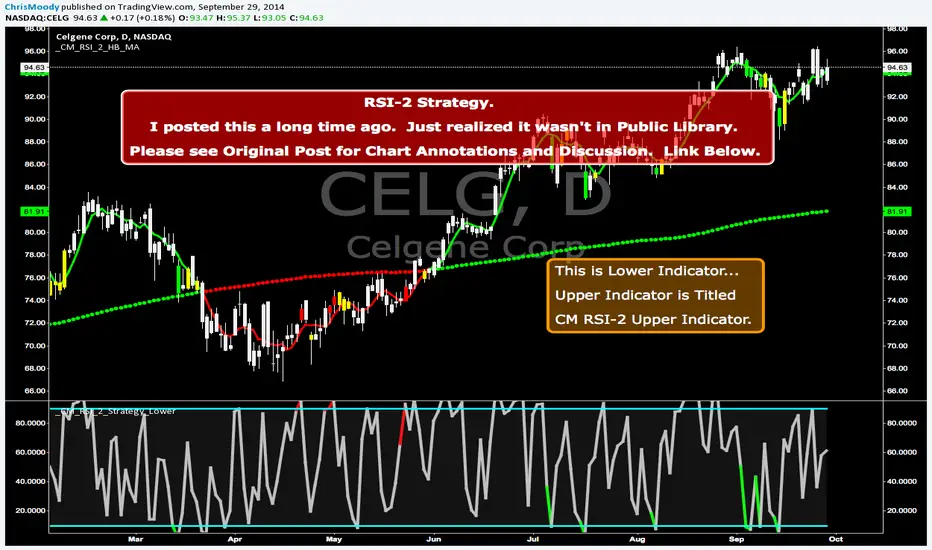
CM RSI-2 Strategy Lower IndicatorRSI-2 Strategy
***At the bottom of the page is a link where you can download the PDF of the Backtesting Results.
This year I am focusing on learning from two of the best mentors in the Industry with outstanding track records for Creating Systems, and learning the what methods actually work as far as back testing.
I came across the RSI-2 system that Larry Connors developed. Larry has become famous for his technical indicators, but his RSI-2 system is what actually put him “On The Map” per se. At first glance I didn’t think it would work well, but I decided to code it and ran backtests on the S&P 100 In Down Trending Markets, Up Trending Markets, and both combined. I was shocked by the results. So I thought I would provide them for you. I also ran a test on the Major forex Pairs (12) for the last 5 years, and All Forex Pairs (80) from 11/28/2007 - 6/09/2014, impressive results also.
The RSI-2 Strategy is designed to use on Daily Bars, however it is a short term trading strategy. The average length of time in a trade is just over 2 days. But the results CRUSH the general market averages.
Detailed Description of Indicators, Rules Below:
Link For PDF of Detailed Trade Results
d.pr
Original Post
CM RSI-2 Strategy - Upper Indicators.RSI-2 Strategy
***At the bottom of the page is a link where you can download the PDF of the Backtesting Results.
This year I am focusing on learning from two of the best mentors in the Industry with outstanding track records for Creating Systems, and learning the what methods actually work as far as back testing.
I came across the RSI-2 system that Larry Connors developed. Larry has become famous for his technical indicators, but his RSI-2 system is what actually put him “On The Map” per se. At first glance I didn’t think it would work well, but I decided to code it and ran backtests on the S&P 100 In Down Trending Markets, Up Trending Markets, and both combined. I was shocked by the results. So I thought I would provide them for you. I also ran a test on the Major forex Pairs (12) for the last 5 years, and All Forex Pairs (80) from 11/28/2007 - 6/09/2014, impressive results also.
The RSI-2 Strategy is designed to use on Daily Bars, however it is a short term trading strategy. The average length of time in a trade is just over 2 days. But the results CRUSH the general market averages.
Detailed Description of Indicators, Rules Below:
Link For PDF of Detailed Trade Results
d.pr
Original Post

Universal Moving Average🙏🏻 UMA (Universal Moving Average) represents the most natural and prolly ‘the’ final general universal entity for calculating rolling typical value for any type of time-series. Simply via different weighting schemes applied together, it encodes:
Location of each datapoint in corresponding fields (price, time, volume)
Informational relevance of each datapoint via using windowing functions that are fundamental in nature and go beyond DSP inventions & approximations
Innovation in state space (in our case = volatility)
The real beauty of this development: being simply a weighting scheme that can be applied to anything: be it weighted median , weighted quantile regression, or weighted KDE , or a simple weighted mean (like in this script). As long as a method accepts weights, you can harness the power of this entity. It means that final algorithmic complexity will match your initial tool.
As a moving ‘average’ it beats ALMA, KAMA, MAMA, VIDYA and all others because it is a simple and general entity, and all it does is encoding ‘all’ available information. I think that post might anger a lot of people, because lotta things will be realized as legacy and many paywalls gonna be ignored, specially for the followers of DSP cult, the ones who yet don’t understand that aggregated tick data is not a signal omg, it’s a completely different type of time series where your methods simply don’t fit even closely. I am also sorry to inform y’all, that spectral analysis is much closer to state-space methods in spirit than to DSP. But in fact DSP is cool and I love it, well for actual signals xD
...
Weights explained & how to use them: as I already said, the whole thing is based on combining different set of weights, and you can turn them on/off in script settings. Btw I've set em up defaults so you can use the thing on price data out of the box right away.
Price, Time, Volume weights: encode location of every datapoint in Price & TIme & Volume field
Howtouse: u have to disable one weight that corresponds to the field you apply UMA to. E.g if you apply UMA to prices, you turn off price weighting And turn on time and volume weighting. Or if you apply UMA to volume delta, you turn off volume weighting And turn on price and time weighting.
Higher prices are more important, this asymmetry is confirmed and even proved by the fact that prices can’t be negative (don’t even mention that incorrect rollover on CL contract in 2k20...).
Signal weights: encode actuality/importance/relevance of datapoints.
Howtouse: in DSP terms, it provides smoothing, but also compensates for the lag it introduces. This smoothness is useful if you use slope reversals for signal generation aka watching peaks and valleys in a moving average shape. It's also better to perturb smoothed outputs with this , this way you inject high freq content back, But in controlled way!
Signal = information.
The fundamental universal entity behind so-called “smoothing” in DSP has nothing to do with signals and goes eons beyond DSP. This is simply about measuring the relevance of data in time.
First, new datapoints need some time to be “embedded” into the timeline, you can think of it as time proof, kinda stuff needs time to be proved, accepted; while earliest datapoints lose relevance in time.
Second, along with the first notion, at the same time there’s the counter notion that simply weights new data more, acting as a counterweight from the down-weighting of the latest datapoints introduced by the first notion.
The first part can be represented as PDF of beta(2, 2) window (a set of weights in our case). It’s actually well known as the Welch window, that lives in between so called statistical and DSP worlds, emerges in multiple contexts. Mainstream DSP users tho mostly don’t use this one, they use primitive legacy windowing function, you can find all kinds on this wiki page.
Now the second part, where DSP adepts usually stop, is to introduce the second compensating windowing function. Instead they try to reduce window size, or introduce other kinds of volatility weights, do some tricks, but it ain’t provides obviously. The natural step here is to simply use the integral of the initial window; if the initial window is beta(2, 2) then what we simply need is CDF of beta(2, 2), in fact the vertically inverted shape of it aka survival function . That’s it bros. Simply as that.
When both of these are applied you have smth magical, your output becomes smooth and yet not lagging. No arbitrary windowing functions, tricks with data modification etc
Why beta(2, 2)? It naturally arises in many contexts, it’s based on one of the most fundamental functions in the universe: x^2. It has finite support. I can talk more bout it on request, but I am absolutely sure this is it.
^^ impulse response of the resulting weighs together (green) compared with uniform weights aka boxcar (red). Made with this script .
Weighing by state: encodes state-space innovation of each datapoint, basically magnitude of changes, strength of these changes, aka volatility.
Howtouse: this makes your moving average volatility aware in proper math ways. The influence of datapoints will be stronger when changes are stronger. This is weighting by innovations, or weighting by volatility by using squared returns.
Why squared returns? They encode state‑space innovations properly because the innovation of any continuous‑time semimartingale is about its quadratic variation, and quadratic variation is built from squared increments, not absolute increments.
Adaptive length is not the right way to introduce adaptivity by volatility xD. When you weight datapoints by squared returns you’re already dynamically varying ‘effective’ data size, you don’t need anything else.
...
It’s all good, progress happens, that’s how the Universe works, that's how Universal Moving Average works. Time to evolve. I might update other scripts with this complete weighting scheme, either by my own desire or your request.
...
∞

RSI Distribution [Kodexius]RSI Distribution is a statistics driven visualization companion for the classic RSI oscillator. In addition to plotting RSI itself, it continuously builds a rolling sample of recent RSI values and projects their distribution as a forward drawn histogram, so you can see where RSI has spent most of its time over the selected lookback window.
The indicator is designed to add context to oscillator readings. Instead of only treating RSI as a single point estimate that is either “high” or “low”, you can evaluate the current RSI level relative to its own recent history. This makes it easier to recognize when the market is operating inside a familiar regime, and when RSI is pushing into rarer tail conditions that tend to appear during momentum bursts, exhaustion, or volatility expansion.
To complement the histogram, the script can optionally overlay a Gaussian curve fitted to the sample mean and standard deviation. It also runs a Jarque Bera normality check, based on skewness and excess kurtosis, and surfaces the result both visually and in a compact dashboard. On the oscillator panel itself, RSI is presented with a clean gradient line and standard overbought and oversold references, with fills that become more visible when RSI meaningfully extends beyond key thresholds.
🔹 Features
1. Distribution Histogram of Recent RSI Values
The script stores the last N RSI values in an internal sample and uses that rolling window to compute a frequency distribution across a user selected number of bins. The histogram is drawn into the future by a configurable width in bars, which keeps it readable and prevents it from colliding with the active RSI plot. The result is a compact visual summary of where RSI clusters most often, whether it is spending more time near the center, or shifting toward higher or lower regimes.
2. Gaussian Overlay for Shape Intuition
If enabled, a fitted bell curve is drawn on top of the histogram using the sample mean and standard deviation. This overlay is not intended as a direct trading signal. Its purpose is to provide a fast visual comparator between the empirical RSI distribution and a theoretical normal shape. When the histogram diverges strongly from the curve, you can quickly spot skew, heavy tails, or regime changes that often occur when market structure or volatility conditions shift.
3. Jarque Bera Normality Check With Clear PASS/FAIL Feedback
The script computes skewness and excess kurtosis from the RSI sample, then forms the Jarque Bera statistic and compares it to a fixed 95% critical value. When the distribution is closer to normal under this test, the status is marked as PASS, otherwise it is marked as FAIL. This result is displayed in the dashboard and can also influence the histogram styling, giving immediate feedback about whether the recent RSI behavior resembles a bell shaped distribution or a more distorted, regime driven profile.
Jarque Bera is a goodness of fit test that evaluates whether a dataset looks consistent with a normal distribution by checking two shape properties: skewness (asymmetry) and kurtosis (tail heaviness, expressed here as excess kurtosis where a perfect normal has 0). Under the null hypothesis of normality, skewness should be near 0 and excess kurtosis should be near 0. The test combines deviations in both into a single statistic, which is then compared to a chi square threshold. A PASS in this script means the sample does not show strong evidence against normality at the chosen threshold, while a FAIL means the sample is meaningfully skewed, heavy tailed, or both. In practical trading terms, a FAIL often suggests RSI is behaving in a regime where extremes and asymmetry are more common, which is typical during strong trends, volatility expansions, or one sided market pressure. It is still a statistical diagnostic, not a prediction tool, and results can vary with lookback length and market conditions.
4. Integrated Stats Dashboard
A compact table in the top right summarizes key distribution moments and the normality result: Mean, StdDev, Skewness, Kurtosis, and the JB statistic with PASS/FAIL text. Skewness is color coded by sign to quickly distinguish right skew (more time at higher RSI) versus left skew (more time at lower RSI), which can be helpful when diagnosing trend bias and momentum persistence.
5. RSI Visual Quality and Context Zones
RSI is plotted with a gradient color scheme and standard overbought and oversold reference lines. The overbought and oversold areas are filled with a smart gradient so visual emphasis increases when RSI meaningfully extends beyond the 70 and 30 regions, improving readability without overwhelming the panel.
🔹 Calculations
This section summarizes the main calculations and transformations used internally.
1. RSI Series
RSI is computed from the selected source and length using the standard RSI function:
rsi_val = ta.rsi(rsi_src, rsi_len)
2. Rolling Sample Collection
A float array stores recent RSI values. Each bar appends the newest RSI, and if the array exceeds the configured lookback, the oldest value is removed. Conceptually:
rsi_history.push(rsi_val)
if rsi_history.size() > lookback
rsi_history.shift()
This maintains a fixed size window that represents the most recent RSI behavior.
3. Mean, Variance, and Standard Deviation
The script computes the sample mean across the array. Variance is computed as sample variance using (n - 1) in the denominator, and standard deviation is the square root of that variance. These values serve both the dashboard display and the Gaussian overlay parameters.
4. Skewness and Excess Kurtosis
Skewness is calculated from the standardized third central moment with a small sample correction. Kurtosis is computed as excess kurtosis (kurtosis minus 3), so the normal baseline is 0. These two metrics summarize asymmetry and tail heaviness, which are the core ingredients for the Jarque Bera statistic.
5. Jarque Bera Statistic and Decision Rule
Using skewness S and excess kurtosis K, the Jarque Bera statistic is computed as:
JB = (n / 6.0) * (S^2 + 0.25 * K^2)
Normality is flagged using a fixed critical value:
is_normal = JB < 5.991
This produces a simple PASS/FAIL classification suitable for fast chart interpretation.
6. Histogram Binning and Scaling
The RSI domain is treated as 0 to 100 and divided into a configurable number of bins. Bin size is:
bin_size = 100.0 / bins
Each RSI sample maps to a bin index via floor(rsi / bin_size), with clamping to ensure the index stays within valid bounds. The script counts occurrences per bin, tracks the maximum frequency, and normalizes each bar height by freq/max_freq so the histogram remains visually stable and comparable as the window updates.
7. Gaussian Curve Overlay (Optional)
The Gaussian overlay uses the normal probability density function with mu as the sample mean and sigma as the sample standard deviation:
normal_pdf(x) = (1 / (sigma * sqrt(2*pi))) * exp(-0.5 * ((x - mu)/sigma)^2)
For drawing, the script samples x across the histogram width, evaluates the PDF, and normalizes it relative to its peak so the curve fits within the same visual height scale as the histogram.

Per Bak Self-Organized CriticalityTL;DR: This indicator measures market fragility. It measures the system's vulnerability to cascade failures and phase transitions. I've added four independent stress vectors: tail risk, volatility regime, credit stress, and positioning extremes. This allows us to quantify how susceptible markets are to disproportionate moves from small shocks, similar to how a steep sandpile is primed for avalanches.
Avalanches, forest fires, earthquakes, pandemic outbreaks, and market crashes. What do they all have in common? They are not random.
These events follow power laws - stable systems that naturally evolve toward critical states where small triggers can unleash catastrophic cascades.
For example, if you are building a sandpile, there will be a point with a little bit additional sand will cause a landslide.
Markets build fragility grain by grain, like a sandpile approaching avalanche.
The Per Bak Self-Organized Criticality (SOC) indicator detects when the markets are a few grains away from collapse.
This indicator is highly inspired by the work of Per Bak related to the science of self-organized criticality .
As Bak said:
"The earthquake does not 'know how large it will become'. Thus, any precursor state of a large event is essentially identical to a precursor state of a small event."
For markets, this means:
We cannot predict individual crash size from initial conditions
We can predict statistical distribution of crashes
We can identify periods of increased systemic risk (proximity to critical state)
BTW, this is a forwarding looking indicator and doesn't reprint. :)
The Story of Per Bak
In 1987, Danish physicist Per Bak and his colleagues discovered an important pattern in nature: self-organized criticality.
Their sandpile experiment revealed something: drop grains of sand one by one onto a pile, and the system naturally evolves toward a critical state. Most grains cause nothing. Some trigger small slides. But occasionally a single grain triggers a massive avalanche.
The key insight is that we cannot predict which grain will trigger the avalanche, but you can measure when the pile has reached a critical state.
Why Markets Are the Ultimate SOC System?
Financial markets exhibit all the hallmarks of self-organized criticality:
Interconnected agents (traders, institutions, algorithms) with feedback loops
Non-linear interactions where small events can cascade through the system
Power-law distributions of returns (fat tails, not normal distributions)
Natural evolution toward fragility as leverage builds, correlations tighten, and positioning crowds
Phase transitions where calm markets suddenly shift to crisis regimes
Mathematical Foundation
Power Law Distributions
Traditional finance assumes returns follow a normal distribution. "Markets return 10% on average." But I disagree. Markets follow power laws:
P(x) ∝ x^(-α)
Where P(x) is the probability of an event of size x, and α is the power law exponent (typically 3-4 for financial markets).
What this means: Small moves happen constantly. Medium moves are less frequent. Catastrophic moves are rare but follow predictable probability distributions. The "fat tails" are features of critical systems.
Critical Slowing Down
As systems approach phase transitions, they exhibit critical slowing down—reduced ability to absorb shocks. Mathematically, this appears as:
τ ∝ |T - T_c|^(-ν)
Where τ is the relaxation time, T is the current state, T_c is the critical threshold, and ν is the critical exponent.
Translation: Near criticality, markets take longer to recover from perturbations. Fragility compounds.
Component Aggregation & Non-Linear Emergence
The Per Bak SOC our index aggregates four normalized components (each scaled 0-100) with tunable weights:
SOC = w₁·C_tail + w₂·C_vol + w₃·C_credit + w₄·C_position
Default weights (you can change this):
w₁ = 0.34 (Tail Risk via SKEW)
w₂ = 0.26 (Volatility Regime via VIX term structure)
w₃ = 0.18 (Credit Stress via HYG/LQD + TED spread)
w₄ = 0.22 (Positioning Extremes via Put/Call ratio)
Each component uses percentile ranking over a 252-day lookback combined with absolute thresholds to capture both relative regime shifts and extreme absolute levels.
The Four Pillars Explained
1. Tail Risk (SKEW Index)
Measures options market pricing of fat-tail events. High SKEW indicates elevated outlier probability.
C_tail = 0.7·percentrank(SKEW, 252) + 0.3·((SKEW - 115)/0.5)
2. Volatility Regime (VIX Term Structure)
Combines VIX level with term structure slope. Backwardation signals acute stress.
C_vol = 0.4·VIX_level + 0.35·VIX_slope + 0.25·VIX_ratio
3. Credit Stress (HYG/LQD + TED Spread)
Tracks high-yield deterioration versus investment-grade and interbank lending stress.
C_credit = 0.65·percentrank(LQD/HYG, 252) + 0.35·(TED/0.75)·100
4. Positioning Extremes (Put/Call Ratio)
Detects extreme hedging demand through percentile ranking and z-score analysis.
C_position = 0.6·percentrank(P/C, 252) + 0.4·zscore_normalized
What the Indicator Really Measures?
Not Volatility but Fragility
Markets Going Down ≠ Fragility Building (actually when markets go down, risk and fragility are released)
The 0-100 Scale & Regime Thresholds
The indicator outputs a 0-100 fragility score with four regimes:
🟢 Safe (0-39): System resilient, can absorb normal shocks
🟡 Building (40-54): Early fragility signs, watch for deterioration
🟠 Elevated (55-69): System vulnerable
🔴 Critical (70-100): Highly susceptible to cascade failures
Further Reading for Nerds
Bak, P., Tang, C., & Wiesenfeld, K. (1987). "Self-organized criticality: An explanation of 1/f noise." Physical Review Letters.
Bak, P. & Chen, K. (1991). "Self-organized criticality." Scientific American.
Bak, P. (1996). How Nature Works: The Science of Self-Organized Criticality. Copernicus.
Feedback is appreciated :)

LogNormalLibrary "LogNormal"
A collection of functions used to model skewed distributions as log-normal.
Prices are commonly modeled using log-normal distributions (ie. Black-Scholes) because they exhibit multiplicative changes with long tails; skewed exponential growth and high variance. This approach is particularly useful for understanding price behavior and estimating risk, assuming continuously compounding returns are normally distributed.
Because log space analysis is not as direct as using math.log(price) , this library extends the Error Functions library to make working with log-normally distributed data as simple as possible.
- - -
QUICK START
Import library into your project
Initialize model with a mean and standard deviation
Pass model params between methods to compute various properties
var LogNorm model = LN.init(arr.avg(), arr.stdev()) // Assumes the library is imported as LN
var mode = model.mode()
Outputs from the model can be adjusted to better fit the data.
var Quantile data = arr.quantiles()
var more_accurate_mode = mode.fit(model, data) // Fits value from model to data
Inputs to the model can also be adjusted to better fit the data.
datum = 123.45
model_equivalent_datum = datum.fit(data, model) // Fits value from data to the model
area_from_zero_to_datum = model.cdf(model_equivalent_datum)
- - -
TYPES
There are two requisite UDTs: LogNorm and Quantile . They are used to pass parameters between functions and are set automatically (see Type Management ).
LogNorm
Object for log space parameters and linear space quantiles .
Fields:
mu (float) : Log space mu ( µ ).
sigma (float) : Log space sigma ( σ ).
variance (float) : Log space variance ( σ² ).
quantiles (Quantile) : Linear space quantiles.
Quantile
Object for linear quantiles, most similar to a seven-number summary .
Fields:
Q0 (float) : Smallest Value
LW (float) : Lower Whisker Endpoint
LC (float) : Lower Whisker Crosshatch
Q1 (float) : First Quartile
Q2 (float) : Second Quartile
Q3 (float) : Third Quartile
UC (float) : Upper Whisker Crosshatch
UW (float) : Upper Whisker Endpoint
Q4 (float) : Largest Value
IQR (float) : Interquartile Range
MH (float) : Midhinge
TM (float) : Trimean
MR (float) : Mid-Range
- - -
TYPE MANAGEMENT
These functions reliably initialize and update the UDTs. Because parameterization is interdependent, avoid setting the LogNorm and Quantile fields directly .
init(mean, stdev, variance)
Initializes a LogNorm object.
Parameters:
mean (float) : Linearly measured mean.
stdev (float) : Linearly measured standard deviation.
variance (float) : Linearly measured variance.
Returns: LogNorm Object
set(ln, mean, stdev, variance)
Transforms linear measurements into log space parameters for a LogNorm object.
Parameters:
ln (LogNorm) : Object containing log space parameters.
mean (float) : Linearly measured mean.
stdev (float) : Linearly measured standard deviation.
variance (float) : Linearly measured variance.
Returns: LogNorm Object
quantiles(arr)
Gets empirical quantiles from an array of floats.
Parameters:
arr (array) : Float array object.
Returns: Quantile Object
- - -
DESCRIPTIVE STATISTICS
Using only the initialized LogNorm parameters, these functions compute a model's central tendency and standardized moments.
mean(ln)
Computes the linear mean from log space parameters.
Parameters:
ln (LogNorm) : Object containing log space parameters.
Returns: Between 0 and ∞
median(ln)
Computes the linear median from log space parameters.
Parameters:
ln (LogNorm) : Object containing log space parameters.
Returns: Between 0 and ∞
mode(ln)
Computes the linear mode from log space parameters.
Parameters:
ln (LogNorm) : Object containing log space parameters.
Returns: Between 0 and ∞
variance(ln)
Computes the linear variance from log space parameters.
Parameters:
ln (LogNorm) : Object containing log space parameters.
Returns: Between 0 and ∞
skewness(ln)
Computes the linear skewness from log space parameters.
Parameters:
ln (LogNorm) : Object containing log space parameters.
Returns: Between 0 and ∞
kurtosis(ln, excess)
Computes the linear kurtosis from log space parameters.
Parameters:
ln (LogNorm) : Object containing log space parameters.
excess (bool) : Excess Kurtosis (true) or regular Kurtosis (false).
Returns: Between 0 and ∞
hyper_skewness(ln)
Computes the linear hyper skewness from log space parameters.
Parameters:
ln (LogNorm) : Object containing log space parameters.
Returns: Between 0 and ∞
hyper_kurtosis(ln, excess)
Computes the linear hyper kurtosis from log space parameters.
Parameters:
ln (LogNorm) : Object containing log space parameters.
excess (bool) : Excess Hyper Kurtosis (true) or regular Hyper Kurtosis (false).
Returns: Between 0 and ∞
- - -
DISTRIBUTION FUNCTIONS
These wrap Gaussian functions to make working with model space more direct. Because they are contained within a log-normal library, they describe estimations relative to a log-normal curve, even though they fundamentally measure a Gaussian curve.
pdf(ln, x, empirical_quantiles)
A Probability Density Function estimates the probability density . For clarity, density is not a probability .
Parameters:
ln (LogNorm) : Object of log space parameters.
x (float) : Linear X coordinate for which a density will be estimated.
empirical_quantiles (Quantile) : Quantiles as observed in the data (optional).
Returns: Between 0 and ∞
cdf(ln, x, precise)
A Cumulative Distribution Function estimates the area under a Log-Normal curve between Zero and a linear X coordinate.
Parameters:
ln (LogNorm) : Object of log space parameters.
x (float) : Linear X coordinate .
precise (bool) : Double precision (true) or single precision (false).
Returns: Between 0 and 1
ccdf(ln, x, precise)
A Complementary Cumulative Distribution Function estimates the area under a Log-Normal curve between a linear X coordinate and Infinity.
Parameters:
ln (LogNorm) : Object of log space parameters.
x (float) : Linear X coordinate .
precise (bool) : Double precision (true) or single precision (false).
Returns: Between 0 and 1
cdfinv(ln, a, precise)
An Inverse Cumulative Distribution Function reverses the Log-Normal cdf() by estimating the linear X coordinate from an area.
Parameters:
ln (LogNorm) : Object of log space parameters.
a (float) : Normalized area .
precise (bool) : Double precision (true) or single precision (false).
Returns: Between 0 and ∞
ccdfinv(ln, a, precise)
An Inverse Complementary Cumulative Distribution Function reverses the Log-Normal ccdf() by estimating the linear X coordinate from an area.
Parameters:
ln (LogNorm) : Object of log space parameters.
a (float) : Normalized area .
precise (bool) : Double precision (true) or single precision (false).
Returns: Between 0 and ∞
cdfab(ln, x1, x2, precise)
A Cumulative Distribution Function from A to B estimates the area under a Log-Normal curve between two linear X coordinates (A and B).
Parameters:
ln (LogNorm) : Object of log space parameters.
x1 (float) : First linear X coordinate .
x2 (float) : Second linear X coordinate .
precise (bool) : Double precision (true) or single precision (false).
Returns: Between 0 and 1
ott(ln, x, precise)
A One-Tailed Test transforms a linear X coordinate into an absolute Z Score before estimating the area under a Log-Normal curve between Z and Infinity.
Parameters:
ln (LogNorm) : Object of log space parameters.
x (float) : Linear X coordinate .
precise (bool) : Double precision (true) or single precision (false).
Returns: Between 0 and 0.5
ttt(ln, x, precise)
A Two-Tailed Test transforms a linear X coordinate into symmetrical ± Z Scores before estimating the area under a Log-Normal curve from Zero to -Z, and +Z to Infinity.
Parameters:
ln (LogNorm) : Object of log space parameters.
x (float) : Linear X coordinate .
precise (bool) : Double precision (true) or single precision (false).
Returns: Between 0 and 1
ottinv(ln, a, precise)
An Inverse One-Tailed Test reverses the Log-Normal ott() by estimating a linear X coordinate for the right tail from an area.
Parameters:
ln (LogNorm) : Object of log space parameters.
a (float) : Half a normalized area .
precise (bool) : Double precision (true) or single precision (false).
Returns: Between 0 and ∞
tttinv(ln, a, precise)
An Inverse Two-Tailed Test reverses the Log-Normal ttt() by estimating two linear X coordinates from an area.
Parameters:
ln (LogNorm) : Object of log space parameters.
a (float) : Normalized area .
precise (bool) : Double precision (true) or single precision (false).
Returns: Linear space tuple :
- - -
UNCERTAINTY
Model-based measures of uncertainty, information, and risk.
sterr(sample_size, fisher_info)
The standard error of a sample statistic.
Parameters:
sample_size (float) : Number of observations.
fisher_info (float) : Fisher information.
Returns: Between 0 and ∞
surprisal(p, base)
Quantifies the information content of a single event.
Parameters:
p (float) : Probability of the event .
base (float) : Logarithmic base (optional).
Returns: Between 0 and ∞
entropy(ln, base)
Computes the differential entropy (average surprisal).
Parameters:
ln (LogNorm) : Object of log space parameters.
base (float) : Logarithmic base (optional).
Returns: Between 0 and ∞
perplexity(ln, base)
Computes the average number of distinguishable outcomes from the entropy.
Parameters:
ln (LogNorm)
base (float) : Logarithmic base used for Entropy (optional).
Returns: Between 0 and ∞
value_at_risk(ln, p, precise)
Estimates a risk threshold under normal market conditions for a given confidence level.
Parameters:
ln (LogNorm) : Object of log space parameters.
p (float) : Probability threshold, aka. the confidence level .
precise (bool) : Double precision (true) or single precision (false).
Returns: Between 0 and ∞
value_at_risk_inv(ln, value_at_risk, precise)
Reverses the value_at_risk() by estimating the confidence level from the risk threshold.
Parameters:
ln (LogNorm) : Object of log space parameters.
value_at_risk (float) : Value at Risk.
precise (bool) : Double precision (true) or single precision (false).
Returns: Between 0 and 1
conditional_value_at_risk(ln, p, precise)
Estimates the average loss beyond a confidence level, aka. expected shortfall.
Parameters:
ln (LogNorm) : Object of log space parameters.
p (float) : Probability threshold, aka. the confidence level .
precise (bool) : Double precision (true) or single precision (false).
Returns: Between 0 and ∞
conditional_value_at_risk_inv(ln, conditional_value_at_risk, precise)
Reverses the conditional_value_at_risk() by estimating the confidence level of an average loss.
Parameters:
ln (LogNorm) : Object of log space parameters.
conditional_value_at_risk (float) : Conditional Value at Risk.
precise (bool) : Double precision (true) or single precision (false).
Returns: Between 0 and 1
partial_expectation(ln, x, precise)
Estimates the partial expectation of a linear X coordinate.
Parameters:
ln (LogNorm) : Object of log space parameters.
x (float) : Linear X coordinate .
precise (bool) : Double precision (true) or single precision (false).
Returns: Between 0 and µ
partial_expectation_inv(ln, partial_expectation, precise)
Reverses the partial_expectation() by estimating a linear X coordinate.
Parameters:
ln (LogNorm) : Object of log space parameters.
partial_expectation (float) : Partial Expectation .
precise (bool) : Double precision (true) or single precision (false).
Returns: Between 0 and ∞
conditional_expectation(ln, x, precise)
Estimates the conditional expectation of a linear X coordinate.
Parameters:
ln (LogNorm) : Object of log space parameters.
x (float) : Linear X coordinate .
precise (bool) : Double precision (true) or single precision (false).
Returns: Between X and ∞
conditional_expectation_inv(ln, conditional_expectation, precise)
Reverses the conditional_expectation by estimating a linear X coordinate.
Parameters:
ln (LogNorm) : Object of log space parameters.
conditional_expectation (float) : Conditional Expectation .
precise (bool) : Double precision (true) or single precision (false).
Returns: Between 0 and ∞
fisher(ln, log)
Computes the Fisher Information Matrix for the distribution, not a linear X coordinate.
Parameters:
ln (LogNorm) : Object of log space parameters.
log (bool) : Sets if the matrix should be in log (true) or linear (false) space.
Returns: FIM for the distribution
fisher(ln, x, log)
Computes the Fisher Information Matrix for a linear X coordinate, not the distribution itself.
Parameters:
ln (LogNorm) : Object of log space parameters.
x (float) : Linear X coordinate .
log (bool) : Sets if the matrix should be in log (true) or linear (false) space.
Returns: FIM for the linear X coordinate
confidence_interval(ln, x, sample_size, confidence, precise)
Estimates a confidence interval for a linear X coordinate.
Parameters:
ln (LogNorm) : Object of log space parameters.
x (float) : Linear X coordinate .
sample_size (float) : Number of observations.
confidence (float) : Confidence level .
precise (bool) : Double precision (true) or single precision (false).
Returns: CI for the linear X coordinate
- - -
CURVE FITTING
An overloaded function that helps transform values between spaces. The primary function uses quantiles, and the overloads wrap the primary function to make working with LogNorm more direct.
fit(x, a, b)
Transforms X coordinate between spaces A and B.
Parameters:
x (float) : Linear X coordinate from space A .
a (LogNorm | Quantile | array) : LogNorm, Quantile, or float array.
b (LogNorm | Quantile | array) : LogNorm, Quantile, or float array.
Returns: Adjusted X coordinate
- - -
EXPORTED HELPERS
Small utilities to simplify extensibility.
z_score(ln, x)
Converts a linear X coordinate into a Z Score.
Parameters:
ln (LogNorm) : Object of log space parameters.
x (float) : Linear X coordinate.
Returns: Between -∞ and +∞
x_coord(ln, z)
Converts a Z Score into a linear X coordinate.
Parameters:
ln (LogNorm) : Object of log space parameters.
z (float) : Standard normal Z Score.
Returns: Between 0 and ∞
iget(arr, index)
Gets an interpolated value of a pseudo -element (fictional element between real array elements). Useful for quantile mapping.
Parameters:
arr (array) : Float array object.
index (float) : Index of the pseudo element.
Returns: Interpolated value of the arrays pseudo element.

TimeSeriesBenchmarkMeasuresLibrary "TimeSeriesBenchmarkMeasures"
Time Series Benchmark Metrics. \
Provides a comprehensive set of functions for benchmarking time series data, allowing you to evaluate the accuracy, stability, and risk characteristics of various models or strategies. The functions cover a wide range of statistical measures, including accuracy metrics (MAE, MSE, RMSE, NRMSE, MAPE, SMAPE), autocorrelation analysis (ACF, ADF), and risk measures (Theils Inequality, Sharpness, Resolution, Coverage, and Pinball).
___
Reference:
- github.com .
- medium.com .
- www.salesforce.com .
- towardsdatascience.com .
- github.com .
mae(actual, forecasts)
In statistics, mean absolute error (MAE) is a measure of errors between paired observations expressing the same phenomenon. Examples of Y versus X include comparisons of predicted versus observed, subsequent time versus initial time, and one technique of measurement versus an alternative technique of measurement.
Parameters:
actual (array) : List of actual values.
forecasts (array) : List of forecasts values.
Returns: - Mean Absolute Error (MAE).
___
Reference:
- en.wikipedia.org .
- The Orange Book of Machine Learning - Carl McBride Ellis .
mse(actual, forecasts)
The Mean Squared Error (MSE) is a measure of the quality of an estimator. As it is derived from the square of Euclidean distance, it is always a positive value that decreases as the error approaches zero.
Parameters:
actual (array) : List of actual values.
forecasts (array) : List of forecasts values.
Returns: - Mean Squared Error (MSE).
___
Reference:
- en.wikipedia.org .
rmse(targets, forecasts, order, offset)
Calculates the Root Mean Squared Error (RMSE) between target observations and forecasts. RMSE is a standard measure of the differences between values predicted by a model and the values actually observed.
Parameters:
targets (array) : List of target observations.
forecasts (array) : List of forecasts.
order (int) : Model order parameter that determines the starting position in the targets array, `default=0`.
offset (int) : Forecast offset related to target, `default=0`.
Returns: - RMSE value.
nmrse(targets, forecasts, order, offset)
Normalised Root Mean Squared Error.
Parameters:
targets (array) : List of target observations.
forecasts (array) : List of forecasts.
order (int) : Model order parameter that determines the starting position in the targets array, `default=0`.
offset (int) : Forecast offset related to target, `default=0`.
Returns: - NRMSE value.
rmse_interval(targets, forecasts)
Root Mean Squared Error for a set of interval windows. Computes RMSE by converting interval forecasts (with min/max bounds) into point forecasts using the mean of the interval bounds, then compares against actual target values.
Parameters:
targets (array) : List of target observations.
forecasts (matrix) : The forecasted values in matrix format with at least 2 columns (min, max).
Returns: - RMSE value for the combined interval list.
mape(targets, forecasts)
Mean Average Percentual Error.
Parameters:
targets (array) : List of target observations.
forecasts (array) : List of forecasts.
Returns: - MAPE value.
smape(targets, forecasts, mode)
Symmetric Mean Average Percentual Error. Calculates the Mean Absolute Percentage Error (MAPE) between actual targets and forecasts. MAPE is a common metric for evaluating forecast accuracy, expressed as a percentage, lower values indicate a better forecast accuracy.
Parameters:
targets (array) : List of target observations.
forecasts (array) : List of forecasts.
mode (int) : Type of method: default=0:`sum(abs(Fi-Ti)) / sum(Fi+Ti)` , 1:`mean(abs(Fi-Ti) / ((Fi + Ti) / 2))` , 2:`mean(abs(Fi-Ti) / (abs(Fi) + abs(Ti))) * 100`
Returns: - SMAPE value.
mape_interval(targets, forecasts)
Mean Average Percentual Error for a set of interval windows.
Parameters:
targets (array) : List of target observations.
forecasts (matrix) : The forecasted values in matrix format with at least 2 columns (min, max).
Returns: - MAPE value for the combined interval list.
acf(data, k)
Autocorrelation Function (ACF) for a time series at a specified lag.
Parameters:
data (array) : Sample data of the observations.
k (int) : The lag period for which to calculate the autocorrelation. Must be a non-negative integer.
Returns: - The autocorrelation value at the specified lag, ranging from -1 to 1.
___
The autocorrelation function measures the linear dependence between observations in a time series
at different time lags. It quantifies how well the series correlates with itself at different
time intervals, which is useful for identifying patterns, seasonality, and the appropriate
lag structure for time series models.
ACF values close to 1 indicate strong positive correlation, values close to -1 indicate
strong negative correlation, and values near 0 indicate no linear correlation.
___
Reference:
- statisticsbyjim.com
acf_multiple(data, k)
Autocorrelation function (ACF) for a time series at a set of specified lags.
Parameters:
data (array) : Sample data of the observations.
k (array) : List of lag periods for which to calculate the autocorrelation. Must be a non-negative integer.
Returns: - List of ACF values for provided lags.
___
The autocorrelation function measures the linear dependence between observations in a time series
at different time lags. It quantifies how well the series correlates with itself at different
time intervals, which is useful for identifying patterns, seasonality, and the appropriate
lag structure for time series models.
ACF values close to 1 indicate strong positive correlation, values close to -1 indicate
strong negative correlation, and values near 0 indicate no linear correlation.
___
Reference:
- statisticsbyjim.com
adfuller(data, n_lag, conf)
: Augmented Dickey-Fuller test for stationarity.
Parameters:
data (array) : Data series.
n_lag (int) : Maximum lag.
conf (string) : Confidence Probability level used to test for critical value, (`90%`, `95%`, `99%`).
Returns: - `adf` The test statistic.
- `crit` Critical value for the test statistic at the 10 % levels.
- `nobs` Number of observations used for the ADF regression and calculation of the critical values.
___
The Augmented Dickey-Fuller test is used to determine whether a time series is stationary
or contains a unit root (non-stationary). The null hypothesis is that the series has a unit root
(is non-stationary), while the alternative hypothesis is that the series is stationary.
A stationary time series has statistical properties that do not change over time, making it
suitable for many time series forecasting models. If the test statistic is less than the
critical value, we reject the null hypothesis and conclude the series is stationary.
___
Reference:
- www.jstor.org
- en.wikipedia.org
theils_inequality(targets, forecasts)
Calculates Theil's Inequality Coefficient, a measure of forecast accuracy that quantifies the relative difference between actual and predicted values.
Parameters:
targets (array) : List of target observations.
forecasts (array) : Matrix with list of forecasts, ordered column wise.
Returns: - Theil's Inequality Coefficient value, value closer to 0 is better.
___
Theil's Inequality Coefficient is calculated as: `sqrt(Sum((y_i - f_i)^2)) / (sqrt(Sum(y_i^2)) + sqrt(Sum(f_i^2)))`
where `y_i` represents actual values and `f_i` represents forecast values.
This metric ranges from 0 to infinity, with 0 indicating perfect forecast accuracy.
___
Reference:
- en.wikipedia.org
sharpness(forecasts)
The average width of the forecast intervals across all observations, representing the sharpness or precision of the predictive intervals.
Parameters:
forecasts (matrix) : The forecasted values in matrix format with at least 2 columns (min, max).
Returns: - Sharpness The sharpness level, which is the average width of all prediction intervals across the forecast horizon.
___
Sharpness is an important metric for evaluating forecast quality. It measures how narrow or wide the
prediction intervals are. Higher sharpness (narrower intervals) indicates greater precision in the
forecast intervals, while lower sharpness (wider intervals) suggests less precision.
The sharpness metric is calculated as the mean of the interval widths across all observations, where
each interval width is the difference between the upper and lower bounds of the prediction interval.
Note: This function assumes that the forecasts matrix has at least 2 columns, with the first column
representing the lower bounds and the second column representing the upper bounds of prediction intervals.
___
Reference:
- Hyndman, R. J., & Athanasopoulos, G. (2018). Forecasting: principles and practice. OTexts. otexts.com
resolution(forecasts)
Calculates the resolution of forecast intervals, measuring the average absolute difference between individual forecast interval widths and the overall sharpness measure.
Parameters:
forecasts (matrix) : The forecasted values in matrix format with at least 2 columns (min, max).
Returns: - The average absolute difference between individual forecast interval widths and the overall sharpness measure, representing the resolution of the forecasts.
___
Resolution is a key metric for evaluating forecast quality that measures the consistency of prediction
interval widths. It quantifies how much the individual forecast intervals vary from the average interval
width (sharpness). High resolution indicates that the forecast intervals are relatively consistent
across observations, while low resolution suggests significant variation in interval widths.
The resolution is calculated as the mean absolute deviation of individual interval widths from the
overall sharpness value. This provides insight into the uniformity of the forecast uncertainty
estimates across the forecast horizon.
Note: This function requires the forecasts matrix to have at least 2 columns (min, max) representing
the lower and upper bounds of prediction intervals.
___
Reference:
- (sites.stat.washington.edu)
- (www.jstor.org)
coverage(targets, forecasts)
Calculates the coverage probability, which is the percentage of target values that fall within the corresponding forecasted prediction intervals.
Parameters:
targets (array) : List of target values.
forecasts (matrix) : The forecasted values in matrix format with at least 2 columns (min, max).
Returns: - Percent of target values that fall within their corresponding forecast intervals, expressed as a decimal value between 0 and 1 (or 0% and 100%).
___
Coverage probability is a crucial metric for evaluating the reliability of prediction intervals.
It measures how well the forecast intervals capture the actual observed values. An ideal forecast
should have a coverage probability close to the nominal confidence level (e.g., 90%, 95%, or 99%).
For example, if a 95% prediction interval is used, we expect approximately 95% of the actual
target values to fall within those intervals. If the coverage is significantly lower than the
nominal level, the intervals may be too narrow; if it's significantly higher, the intervals may
be too wide.
Note: This function requires the targets array and forecasts matrix to have the same number of
observations, and the forecasts matrix must have at least 2 columns (min, max) representing
the lower and upper bounds of prediction intervals.
___
Reference:
- (www.jstor.org)
pinball(tau, target, forecast)
Pinball loss function, measures the asymmetric loss for quantile forecasts.
Parameters:
tau (float) : The quantile level (between 0 and 1), where 0.5 represents the median.
target (float) : The actual observed value to compare against.
forecast (float) : The forecasted value.
Returns: - The Pinball loss value, which quantifies the distance between the forecast and target relative to the specified quantile level.
___
The Pinball loss function is specifically designed for evaluating quantile forecasts. It is
asymmetric, meaning it penalizes underestimates and overestimates differently depending on the
quantile level being evaluated.
For a given quantile τ, the loss function is defined as:
- If target >= forecast: (target - forecast) * τ
- If target < forecast: (forecast - target) * (1 - τ)
This loss function is commonly used in quantile regression and probabilistic forecasting
to evaluate how well forecasts capture specific quantiles of the target distribution.
___
Reference:
- (www.otexts.com)
pinball_mean(tau, targets, forecasts)
Calculates the mean pinball loss for quantile regression.
Parameters:
tau (float) : The quantile level (between 0 and 1), where 0.5 represents the median.
targets (array) : The actual observed values to compare against.
forecasts (matrix) : The forecasted values in matrix format with at least 2 columns (min, max).
Returns: - The mean pinball loss value across all observations.
___
The pinball_mean() function computes the average Pinball loss across multiple observations,
making it suitable for evaluating overall forecast performance in quantile regression tasks.
This function leverages the asymmetric Pinball loss function to evaluate how well forecasts
capture specific quantiles of the target distribution. The choice of which column from the
forecasts matrix to use depends on the quantile level:
- For τ ≤ 0.5: Uses the first column (min) of forecasts
- For τ > 0.5: Uses the second column (max) of forecasts
This loss function is commonly used in quantile regression and probabilistic forecasting
to evaluate how well forecasts capture specific quantiles of the target distribution.
___
Reference:
- (www.otexts.com)
Adaptive Causal Wavelet Trend FilterThe Adaptive Causal Wavelet Trend Filter is a technical indicator implementing causal approximations of wavelet transform properties for better trend detection with adaptive volatility response.
The Adaptive Causal Wavelet Trend Filter (ACWTF) applies mathematical principles derived from wavelet analysis to financial time series, providing robust trend identification with minimal lag. Unlike conventional moving averages, it preserves significant price movements while filtering market noise through signal processing that i describe below.
I was inspired to build this indicator after reading " Wavelet-Based Trend Identification in Financial Time Series " by In, F., & Kim, S. 2013 and reading about Mexican Hat wavelet filters.
The ACWTF maintains optimal performance across varying market regimes without requiring parameter adjustments by adapting filter characteristics to current volatility conditions.
Mathematical Foundation
Inspired by the Mexican Hat wavelet (Ricker wavelet), this indicator implements causal approximations of wavelet filters optimized for real-time financial analysis. The multi-resolution approach identifies features at different scales and the adaptive component dynamically adjusts filtering characteristics based on local volatility measurements.
Key mathematical properties include:
Non-linear frequency response adaptation
Edge-preserving signal extraction
Scale-space analysis through dual filter implementation
Volatility-dependent coefficient adjustment, which I love
Filter Methods
Adaptive: Implements a volatility-weighted combination of multiple filter types to optimize the time-frequency resolution trade-off
Hull: Provides a causal approximation of wavelet edge detection properties with forward-projection characteristics
VWMA: Incorporates volume information into the filtering process for enhanced signal detection
EMA Cascade: Creates a multi-pole filter structure that approximates certain wavelet scaling properties
Suggestion: try all as they will provide slightly different signals. Try also different time-frames.
Practical Applications
Trend Direction Identification: Clear visual trend direction with reduced noise and lag
Regime Change Detection: Early identification of significant trend reversals
Market Condition Analysis: Integrated volatility metrics provide context for current market behavior
Multi-timeframe Confirmation: Alignment between primary and secondary filters offers additional confirmation
Entry/Exit Timing: Filter crossovers and trend changes provide potential trading signals
The comprehensive information panel provides:
Current filter method and trend state
Trend alignment between timeframes
Real-time volatility assessment
Price position relative to filter
Overall trading bias based on multiple factors
Implementation Notes
Log returns option provides improved statistical properties for financial time series
Primary and secondary filter lengths can be adjusted to optimize for specific instruments and timeframes
The indicator performs particularly well during trend transitions and regime changes
The indicator reduces the need for using additional indicators to check trend reversion

Wavelet Filter with Adaptive Upsampling [BackQuant]Wavelet Filter with Adaptive Upsampling
The Wavelet Filter with Adaptive Upsampling is an advanced filtering and signal reconstruction tool designed to enhance the analysis of financial time series data. It combines wavelet transforms with adaptive upsampling techniques to filter and reconstruct price data, making it ideal for capturing subtle market movements and enhancing trend detection. This system uses high-pass and low-pass filters to decompose the price series into different frequency components, applying adaptive thresholding to eliminate noise and preserve relevant signal information.
Shout out to Loxx for the Least Squares fitting of trigonometric series and Quinn and Fernandes algorithm for finding frequency
www.tradingview.com
Key Features
1. Frequency Decomposition with High-Pass and Low-Pass Filters:
The indicator decomposes the input time series using high-pass and low-pass filters to separate the high-frequency (detail) and low-frequency (trend) components of the data. This decomposition allows for a more accurate analysis of underlying trends, while mitigating the impact of noise.
2. Soft Thresholding for Noise Reduction:
A soft thresholding function is applied to the high-frequency component, allowing for the reduction of noise while retaining significant market signals. This function adjusts the coefficients of the high-frequency data, removing small fluctuations and leaving only the essential price movements.
3. Adaptive Upsampling Process:
The upsampling process in this script can be customized using different methods: sinusoidal upsampling, advanced upsampling, and simple upsampling. Each method serves a unique purpose:
Sinusoidal Upsample uses a sine wave to interpolate between data points, providing a smooth transition.
Advanced Upsample utilizes a Quinn-Fernandes algorithm to estimate frequency and apply more sophisticated interpolation techniques, adapting to the market’s cyclical behavior.
Simple Upsample linearly interpolates between data points, providing a basic upsampling technique for less complex analysis.
4. Reconstruction of Filtered Signal:
The indicator reconstructs the filtered signal by summing the high and low-frequency components after upsampling. This allows for a detailed yet smooth representation of the original time series, which can be used for analyzing underlying trends in the market.
5. Visualization of Reconstructed Data:
The reconstructed series is plotted, showing how the upsampling and filtering process enhances the clarity of the price movements. Additionally, the script provides the option to visualize the log returns of the reconstructed series as a histogram, with positive returns shown in green and negative returns in red.
6. Cumulative Series and Trend Detection:
A cumulative series is plotted to visualize the compounded effect of the filtered and reconstructed data. This feature helps traders track the overall performance of the asset over time, identifying whether the asset is following a sustained upward or downward trend.
7. Adaptive Thresholding and Noise Estimation:
The system estimates the noise level in the high-frequency component and applies an adaptive thresholding process based on the standard deviation of the downsampled data. This ensures that only significant price movements are retained, further refining the trend analysis.
8. Customizable Parameters for Flexibility:
Users can customize the following parameters to adjust the behavior of the indicator:
Frequency and Phase Shift: Control the periodicity of the wavelet transformation and the phase of the upsampling function.
Upsample Factor: Adjust the level of interpolation applied during the upsampling process.
Smoothing Period: Determine the length of time used to smooth the signal, helping to filter out short-term fluctuations.
References
Enhancing Cross-Sectional Currency Strategies with Context-Aware Learning to Rank
arxiv.org
Daubechies Wavelet - Wikipedia
en.wikipedia.org
Quinn Fernandes Fourier Transform of Filtered Price by Loxx
Note on Usage for Mean-Reversion Strategy
This indicator is primarily designed for trend-following strategies. However, by taking the inverse of the signals, it can be adapted for mean-reversion strategies. This involves buying underperforming assets and selling outperforming ones. Caution: This method may not work effectively with highly correlated assets, as the price movements between correlated assets tend to mirror each other, limiting the effectiveness of mean-reversion strategies.
Final Thoughts
The Wavelet Filter with Adaptive Upsampling is a powerful tool for traders seeking to improve their understanding of market trends and noise. By using advanced wavelet decomposition and adaptive upsampling, this system offers a clearer, more refined picture of price movements, enhancing trend-following strategies. It’s particularly useful for detecting subtle shifts in market momentum and reconstructing price data in a way that removes noise, providing more accurate insights into market conditions.

ErrorFunctionsLibrary "ErrorFunctions"
A collection of functions used to approximate the area beneath a Gaussian curve.
Because an ERF (Error Function) is an integral, there is no closed-form solution to calculating the area beneath the curve. Meaning all ERFs are approximations; precisely wrong, but mostly accurate. How close you need to get to the actual area depends entirely on your use case, with more precision being less efficient.
The internal precision of floats in Pine Script is 1e-16 (16 decimals, aka. double precision). This library adapts well known algorithms designed to efficiently reach double precision. Single precision alternates are also included. All of them were made free to use, modify, and distribute by their original authors.
HASTINGS
Adaptation of a single precision ERF by Cecil Hastings Jr, published through Princeton University in 1955. It was later documented by Abramowitz and Stegun as equation 7.1.26 in their 1972 Handbook of Mathematical Functions. Fast, efficient, and ideal when precision beyond a few decimals is unnecessary.
GILES
Adaptation of a single precision Inverse ERF by Michael Giles, published through the University of Oxford in 2012. It reverses the ERF, estimating an X coordinate from an area. It too is fast, efficient, and ideal when precision beyond a few decimals is unnecessary.
LIBC
Adaptation of the double precision ERF & ERFC in the standard C library (aka. libc). It is also the same ERF & ERFC that SciPy uses. While not quite as efficient as the Hastings approximation, it's still very fast and fully maximizes Pines precision.
BOOST
Adaptation of the double precision Inverse ERF & Inverse ERFC in the Boost Math C++ library. SciPy uses these as well. These reverse the ERF & ERFC, estimating an X coordinate from an area. It too isn't quite as efficient as the Giles approximation, but still fast and fully maximizes Pines precision.
While these algorithms are not exported directly, they are available through their exported counterparts.
- - -
ERROR FUNCTIONS
erf(x, precise)
An Error Function estimates the theoretical error of a measurement.
Parameters:
x (float) : (float) Upper limit of the integration.
precise (bool) : Double precision (true) or single precision (false).
Returns: (float) Between -1 and 1.
erfc(x, precise)
A Complementary Error Function estimates the difference between a theoretical error and infinity.
Parameters:
x (float) : (float) Lower limit of the integration.
precise (bool) : Double precision (true) or single precision (false).
Returns: (float) Between 0 and 2.
erfinv(x, precise)
An Inverse Error Function reverses the erf() by estimating the original measurement from the theoretical error.
Parameters:
x (float) : (float) Theoretical error.
precise (bool) : Double precision (true) or single precision (false).
Returns: (float) Between 0 and ± infinity.
erfcinv(x, precise)
An Inverse Complementary Error Function reverses the erfc() by estimating the original measurement from the difference between the theoretical error and infinity.
Parameters:
x (float) : (float) Difference between the theoretical error and infinity.
precise (bool) : Double precision (true) or single precision (false).
Returns: (float) Between 0 and ± infinity.
- - -
DISTRIBUTION FUNCTIONS
pdf(x, m, s)
A Probability Density Function estimates the probability density . For clarity, density is not a probability .
Parameters:
x (float) : (float) X coordinate for which a density will be estimated.
m (float) : (float) Mean
s (float) : (float) Sigma
Returns: (float) Between 0 and ∞.
cdf(z, precise)
A Cumulative Distribution Function estimates the area under a Gaussian curve between negative infinity and the Z Score.
Parameters:
z (float) : (float) Z Score.
precise (bool) : Double precision (true) or single precision (false).
Returns: (float) Between 0 and 1.
cdfinv(a, precise)
An Inverse Cumulative Distribution Function reverses the cdf() by estimating the Z Score from an area.
Parameters:
a (float) : (float) Area between 0 and 1.
precise (bool) : Double precision (true) or single precision (false).
Returns: (float) Between -∞ and +∞
cdfab(z1, z2, precise)
A Cumulative Distribution Function from A to B estimates the area under a Gaussian curve between two Z Scores (A and B).
Parameters:
z1 (float) : (float) First Z Score.
z2 (float) : (float) Second Z Score.
precise (bool) : Double precision (true) or single precision (false).
Returns: (float) Between 0 and 1.
ttt(z, precise)
A Two-Tailed Test estimates the area under a Gaussian curve between symmetrical ± Z scores and ± infinity.
Parameters:
z (float) : (float) One of the symmetrical Z Scores.
precise (bool) : Double precision (true) or single precision (false).
Returns: (float) Between 0 and 1.
tttinv(a, precise)
An Inverse Two-Tailed Test reverses the ttt() by estimating the absolute Z Score from an area.
Parameters:
a (float) : (float) Area between 0 and 1.
precise (bool) : Double precision (true) or single precision (false).
Returns: (float) Between 0 and ∞.
ott(z, precise)
A One-Tailed Test estimates the area under a Gaussian curve between an absolute Z Score and infinity.
Parameters:
z (float) : (float) Z Score.
precise (bool) : Double precision (true) or single precision (false).
Returns: (float) Between 0 and 1.
ottinv(a, precise)
An Inverse One-Tailed Test Reverses the ott() by estimating the Z Score from a an area.
Parameters:
a (float) : (float) Area between 0 and 1.
precise (bool) : Double precision (true) or single precision (false).
Returns: (float) Between 0 and ∞.

NIG Probability TableNormal-Inverse Gaussian Probability Table
This indicator implements the Normal-Inverse Gaussian (NIG) distribution to estimate the likelihood of future price based on recent market behavior.
📊 Key Features:
- Estimates the parameters (α: tail heaviness, β: skewness, δ: scale, μ: location)
of the NIG distribution using a sliding window over log returns.
- Uses a numerically approximated version of the modified Bessel function (K₁)
to calculate the NIG probability density function (PDF).
- Normalizes the total probability across all bins to ensure the values are interpretable.
- Displays a dynamic probability table showing the chance of future returns falling into each bin.
⚠️ Notes:
- This is a real-time approximation. The Bessel function and posterior inference are simplified.
- Tail probabilities and shape parameters are sensitive to the window size and input settings.
- Useful for risk analysis, option overlays, and strategy filters.
Stochastic Order Flow Momentum [ScorsoneEnterprises]This indicator implements a stochastic model of order flow using the Ornstein-Uhlenbeck (OU) process, combined with a Kalman filter to smooth momentum signals. It is designed to capture the dynamic momentum of volume delta, representing the net buying or selling pressure per bar, and highlight potential shifts in market direction. The volume delta data is sourced from TradingView’s built-in functionality:
www.tradingview.com
For a deeper dive into stochastic processes like the Ornstein-Uhlenbeck model in financial contexts, see these research articles: arxiv.org and arxiv.org
The SOFM tool aims to reveal the momentum and acceleration of order flow, modeled as a mean-reverting stochastic process. In markets, order flow often oscillates around a baseline, with bursts of buying or selling pressure that eventually fade—similar to how physical systems return to equilibrium. The OU process captures this behavior, while the Kalman filter refines the signal by filtering noise. Parameters theta (mean reversion rate), mu (mean level), and sigma (volatility) are estimated by minimizing a squared-error objective function using gradient descent, ensuring adaptability to real-time market conditions.
How It Works
The script combines a stochastic model with signal processing. Here’s a breakdown of the key components, including the OU equation and supporting functions.
// Ornstein-Uhlenbeck model for volume delta
ou_model(params, v_t, lkb) =>
theta = clamp(array.get(params, 0), 0.01, 1.0)
mu = clamp(array.get(params, 1), -100.0, 100.0)
sigma = clamp(array.get(params, 2), 0.01, 100.0)
error = 0.0
v_pred = array.new(lkb, 0.0)
array.set(v_pred, 0, array.get(v_t, 0))
for i = 1 to lkb - 1
v_prev = array.get(v_pred, i - 1)
v_curr = array.get(v_t, i)
// Discretized OU: v_t = v_{t-1} + theta * (mu - v_{t-1}) + sigma * noise
v_next = v_prev + theta * (mu - v_prev)
array.set(v_pred, i, v_next)
v_curr_clean = na(v_curr) ? 0 : v_curr
v_pred_clean = na(v_next) ? 0 : v_next
error := error + math.pow(v_curr_clean - v_pred_clean, 2)
error
The ou_model function implements a discretized Ornstein-Uhlenbeck process:
v_t = v_{t-1} + theta (mu - v_{t-1})
The model predicts volume delta (v_t) based on its previous value, adjusted by the mean-reverting term theta (mu - v_{t-1}), with sigma representing the volatility of random shocks (approximated in the Kalman filter).
Parameters Explained
The parameters theta, mu, and sigma represent distinct aspects of order flow dynamics:
Theta:
Definition: The mean reversion rate, controlling how quickly volume delta returns to its mean (mu). Constrained between 0.01 and 1.0 (e.g., clamp(array.get(params, 0), 0.01, 1.0)).
Interpretation: A higher theta indicates faster reversion (short-lived momentum), while a lower theta suggests persistent trends. Initial value is 0.1 in init_params.
In the Code: In ou_model, theta scales the pull toward \mu, influencing the predicted v_t.
Mu:
Definition: The long-term mean of volume delta, representing the equilibrium level of net buying/selling pressure. Constrained between -100.0 and 100.0 (e.g., clamp(array.get(params, 1), -100.0, 100.0)).
Interpretation: A positive mu suggests a bullish bias, while a negative mu indicates bearish pressure. Initial value is 0.0 in init_params.
In the Code: In ou_model, mu is the target level that v_t reverts to over time.
Sigma:
Definition: The volatility of volume delta, capturing the magnitude of random fluctuations. Constrained between 0.01 and 100.0 (e.g., clamp(array.get(params, 2), 0.01, 100.0)).
Interpretation: A higher sigma reflects choppier, noisier order flow, while a lower sigma indicates smoother behavior. Initial value is 0.1 in init_params.
In the Code: In the Kalman filter, sigma contributes to the error term, adjusting the smoothing process.
Summary:
theta: Speed of mean reversion (how fast momentum fades).
mu: Baseline order flow level (bullish or bearish bias).
sigma: Noise level (variability in order flow).
Other Parts of the Script
Clamp
A utility function to constrain parameters, preventing extreme values that could destabilize the model.
ObjectiveFunc
Defines the objective function (sum of squared errors) to minimize during parameter optimization. It compares the OU model’s predicted volume delta to observed data, returning a float to be minimized.
How It Works: Calls ou_model to generate predictions, computes the squared error for each timestep, and sums it. Used in optimization to assess parameter fit.
FiniteDifferenceGradient
Calculates the gradient of the objective function using finite differences. Think of it as finding the "slope" of the error surface for each parameter. It nudges each parameter (theta, mu, sigma) by a small amount (epsilon) and measures the change in error, returning an array of gradients.
Minimize
Performs gradient descent to optimize parameters. It iteratively adjusts theta, mu, and sigma by stepping down the "hill" of the error surface, using the gradients from FiniteDifferenceGradient. Stops when the gradient norm falls below a tolerance (0.001) or after 20 iterations.
Kalman Filter
Smooths the OU-modeled volume delta to extract momentum. It uses the optimized theta, mu, and sigma to predict the next state, then corrects it with observed data via the Kalman gain. The result is a cleaner momentum signal.
Applied
After initializing parameters (theta = 0.1, mu = 0.0, sigma = 0.1), the script optimizes them using volume delta data over the lookback period. The optimized parameters feed into the Kalman filter, producing a smoothed momentum array. The average momentum and its rate of change (acceleration) are calculated, though only momentum is plotted by default.
A rising momentum suggests increasing buying or selling pressure, while a flattening or reversing momentum indicates fading activity. Acceleration (not plotted here) could highlight rapid shifts.
Tool Examples
The SOFM indicator provides a dynamic view of order flow momentum, useful for spotting directional shifts or consolidation.
Low Time Frame Example: On a 5-minute chart of SEED_ALEXDRAYM_SHORTINTEREST2:NQ , a rising momentum above zero with a lookback of 5 might signal building buying pressure, while a drop below zero suggests selling dominance. Crossings of the zero line can mark transitions, though the focus is on trend strength rather than frequent crossovers.
High Time Frame Example: On a daily chart of NYSE:VST , a sustained positive momentum could confirm a bullish trend, while a sharp decline might warn of exhaustion. The mean-reverting nature of the OU process helps filter out noise on longer scales. It doesn’t make the most sense to use this on a high timeframe with what our data is.
Choppy Markets: When momentum oscillates near zero, it signals indecision or low conviction, helping traders avoid whipsaws. Larger deviations from zero suggest stronger directional moves to act on, this is on $STT.
Inputs
Lookback: Users can set the lookback period (default 5) to adjust the sensitivity of the OU model and Kalman filter. Shorter lookbacks react faster but may be noisier; longer lookbacks smooth more but lag slightly.
The user can also specify the timeframe they want the volume delta from. There is a default way to lower and expand the time frame based on the one we are looking at, but users have the flexibility.
No indicator is 100% accurate, and SOFM is no exception. It’s an estimation tool, blending stochastic modeling with signal processing to provide a leading view of order flow momentum. Use it alongside price action, support/resistance, and your own discretion for best results. I encourage comments and constructive criticism.

Order Flow Hawkes Process [ScorsoneEnterprises]This indicator is an implementation of the Hawkes Process. This tool is designed to show the excitability of the different sides of volume, it is an estimation of bid and ask size per bar. The code for the volume delta is from www.tradingview.com
Here’s a link to a more sophisticated research article about Hawkes Process than this post arxiv.org
This tool is designed to show how excitable the different sides are. Excitability refers to how likely that side is to get more activity. Alan Hawkes made Hawkes Process for seismology. A big earthquake happens, lots of little ones follow until it returns to normal. Same for financial markets, big orders come in, causing a lot of little orders to come. Alpha, Beta, and Lambda parameters are estimated by minimizing a negative log likelihood function.
How it works
There are a few components to this script, so we’ll go into the equation and then the other functions used in this script.
hawkes_process(params, events, lkb) =>
alpha = clamp(array.get(params, 0), 0.01, 1.0)
beta = clamp(array.get(params, 1), 0.1, 10.0)
lambda_0 = clamp(array.get(params, 2), 0.01, 0.3)
intensity = array.new_float(lkb, 0.0)
events_array = array.new_float(lkb, 0.0)
for i = 0 to lkb - 1
array.set(events_array, i, array.get(events, i))
for i = 0 to lkb - 1
sum_decay = 0.0
current_event = array.get(events_array, i)
for j = 0 to i - 1
time_diff = i - j
past_event = array.get(events_array, j)
decay = math.exp(-beta * time_diff)
past_event_val = na(past_event) ? 0 : past_event
sum_decay := sum_decay + (past_event_val * decay)
array.set(intensity, i, lambda_0 + alpha * sum_decay)
intensity
The parameters alpha, beta, and lambda all represent a different real thing.
Alpha (α):
Definition: Alpha represents the excitation factor or the magnitude of the influence that past events have on the future intensity of the process. In simpler terms, it measures how much each event "excites" or triggers additional events. It is constrained between 0.01 and 1.0 (e.g., clamp(array.get(params, 0), 0.01, 1.0)). A higher alpha means past events have a stronger influence on increasing the intensity (likelihood) of future events. Initial value is set to 0.1 in init_params. In the hawkes_process function, alpha scales the contribution of past events to the current intensity via the term alpha * sum_decay.
Beta (β):
Definition: Beta controls the rate of exponential decay of the influence of past events over time. It determines how quickly the effect of a past event fades away. It is constrained between 0.1 and 10.0 (e.g., clamp(array.get(params, 1), 0.1, 10.0)). A higher beta means the influence of past events decays faster, while a lower beta means the influence lingers longer. Initial value is set to 0.1 in init_params. In the hawkes_process function, beta appears in the decay term math.exp(-beta * time_diff), which reduces the impact of past events as the time difference (time_diff) increases.
Lambda_0 (λ₀):
Definition: Lambda_0 is the baseline intensity of the process, representing the rate at which events occur in the absence of any excitation from past events. It’s the "background" rate of the process. It is constrained between 0.01 and 0.3 .A higher lambda_0 means a higher natural frequency of events, even without the influence of past events. Initial value is set to 0.1 in init_params. In the hawkes_process function, lambda_0 sets the minimum intensity level, to which the excitation term (alpha * sum_decay) is added: lambda_0 + alpha * sum_decay
Alpha (α): Strength of event excitation (how much past events boost future events).
Beta (β): Rate of decay of past event influence (how fast the effect fades).
Lambda_0 (λ₀): Baseline event rate (background intensity without excitation).
Other parts of the script.
Clamp
The clamping function is a simple way to make sure parameters don’t grow or shrink too much.
ObjectiveFunction
This function defines the objective function (negative log-likelihood) to minimize during parameter optimization.It returns a float representing the negative log-likelihood (to be minimized).
How It Works:
Calls hawkes_process to compute the intensity array based on current parameters.Iterates over the lookback period:lambda_t: Intensity at time i.event: Event magnitude at time i.Handles na values by replacing them with 0.Computes log-likelihood: event_clean * math.log(math.max(lambda_t_clean, 0.001)) - lambda_t_clean.Ensures lambda_t_clean is at least 0.001 to avoid log(0).Accumulates into log_likelihood.Returns -log_likelihood (negative because the goal is to minimize, not maximize).
It is used in the optimization process to evaluate how well the parameters fit the observed event data.
Finite Difference Gradient:
This function calculates the gradient of the objective function we spoke about. The gradient is like a directional derivative. Which is like the direction of the rate of change. Which is like the direction of the slope of a hill, we can go up or down a hill. It nudges around the parameter, and calculates the derivative of the parameter. The array of these nudged around parameters is what is returned after they are optimized.
Minimize:
This is the function that actually has the loop and calls the Finite Difference Gradient each time. Here is where the minimizing happens, how we go down the hill. If we are below a tolerance, we are at the bottom of the hill.
Applied
After an initial guess the parameters are optimized with a mix of bid and ask levels to prevent some over-fitting for each side while keeping some efficiency. We initialize two different arrays to store the bid and ask sizes. After we optimize the parameters we clamp them for the calculations. We then get the array of intensities from the Hawkes Process of bid and ask and plot them both. When the bids are greater than the ask it represents a bullish scenario where there are likely to be more buy than sell orders, pushing up price.
Tool examples:
The idea is that when the bid side is more excitable it is more likely to see a bullish reaction, when the ask is we see a bearish reaction.
We see that there are a lot of crossovers, and I picked two specific spots. The idea of this isn’t to spot crossovers but avoid chop. The values are either close together or far apart. When they are far, it is a classification for us to look for our own opportunities in, when they are close, it signals the market can’t pick a direction just yet.
The value works just as well on a higher timeframe as on a lower one. Hawkes Process is an estimate, so there is a leading value aspect of it.
The value works on equities as well, here is NASDAQ:TSLA on a lower time frame with a lookback of 5.
Inputs
Users can enter the lookback value and timeframe.
No tool is perfect, the Hawkes Process value is also not perfect and should not be followed blindly. It is good to use any tool along with discretion and price action.

QuantifyPS - 1Library "QuantifyPS"
normdist(z)
Parameters:
z (float) : (float): The z-score for which the CDF is to be calculated.
Returns: (float): The cumulative probability corresponding to the input z-score.
Notes:
- Uses an approximation method for the normal distribution CDF, which is computationally efficient.
- The result is accurate for most practical purposes but may have minor deviations for extreme values of `z`.
Formula:
- Based on the approximation formula:
`Φ(z) ≈ 1 - f(z) * P(t)` if `z > 0`, otherwise `Φ(z) ≈ f(z) * P(t)`,
where:
`f(z) = 0.3989423 * exp(-z^2 / 2)` (PDF of standard normal distribution)
`P(t) = Σ [c * t^i]` with constants `c` and `t = 1 / (1 + 0.2316419 * |z|)`.
Implementation details:
- The approximation uses five coefficients for the polynomial part of the CDF.
- Handles both positive and negative values of `z` symmetrically.
Constants:
- The coefficients and scaling factors are chosen to minimize approximation errors.
gamma(x)
Parameters:
x (float) : (float): The input value for which the Gamma function is to be calculated.
Must be greater than 0. For x <= 0, the function returns `na` as it is undefined.
Returns: (float): Approximation of the Gamma function for the input `x`.
Notes:
- The Lanczos approximation provides a numerically stable and efficient method to compute the Gamma function.
- The function is not defined for `x <= 0` and will return `na` in such cases.
- Uses precomputed Lanczos coefficients for accuracy.
- Includes handling for small numerical inaccuracies.
Formula:
- The Gamma function is approximated as:
`Γ(x) ≈ sqrt(2π) * t^(x + 0.5) * e^(-t) * Σ(p / (x + k))`
where `t = x + g + 0.5` and `p` is the array of Lanczos coefficients.
Implementation details:
- Lanczos coefficients (`p`) are precomputed and stored in an array.
- The summation iterates over these coefficients to compute the final result.
- The constant `g` controls the precision of the approximation (commonly `g = 7`).
t_cdf(t, df)
Parameters:
t (float) : (float): The t-statistic for which the CDF value is to be calculated.
df (int) : (int): Degrees of freedom of the t-distribution.
Returns: (float): Approximate CDF value for the given t-statistic.
Notes:
- This function computes a one-tailed p-value.
- Relies on an approximation formula using gamma functions and standard t-distribution properties.
- May not be as accurate as specialized statistical libraries for extreme values or very high degrees of freedom.
Formula:
- Let `x = df / (t^2 + df)`.
- The approximation formula is derived using:
`CDF(t, df) ≈ 1 - * x^((df + 1) / 2) / 2`,
where Γ represents the gamma function.
Implementation details:
- Computes the gamma ratio for normalization.
- Applies the t-distribution formula for one-tailed probabilities.
tStatForPValue(p, df)
Parameters:
p (float) : (float): P-value for which the t-statistic needs to be calculated.
Must be in the interval (0, 1).
df (int) : (int): Degrees of freedom of the t-distribution.
Returns: (float): The t-statistic corresponding to the given p-value.
Notes:
- If `p` is outside the interval (0, 1), the function returns `na` as an error.
- The function uses binary search with a fixed number of iterations and a defined tolerance.
- The result is accurate to within the specified tolerance (default: 0.0001).
- Relies on the cumulative density function (CDF) `t_cdf` for the t-distribution.
Formula:
- Uses the cumulative density function (CDF) of the t-distribution to iteratively find the t-statistic.
Implementation details:
- `low` and `high` define the search interval for the t-statistic.
- The midpoint (`mid`) is iteratively refined until the difference between the cumulative probability
and the target p-value is smaller than the tolerance.
jarqueBera(n, s, k)
Parameters:
n (float) : (series float): Number of observations in the dataset.
s (float) : (series float): Skewness of the dataset.
k (float) : (series float): Kurtosis of the dataset.
Returns: (float): The Jarque-Bera test statistic.
Formula:
JB = n *
Notes:
- A higher JB value suggests that the data deviates more from a normal distribution.
- The test is asymptotically distributed as a chi-squared distribution with 2 degrees of freedom.
- Use this value to calculate a p-value to determine the significance of the result.
skewness(data)
Parameters:
data (float) : (series float): Input data series.
Returns: (float): The skewness value.
Notes:
- Handles missing values (`na`) by ignoring invalid points.
- Includes error handling for zero variance to avoid division-by-zero scenarios.
- Skewness is calculated as the normalized third central moment of the data.
kurtosis(data)
Parameters:
data (float) : (series float): Input data series.
Returns: (float): The kurtosis value.
Notes:
- Handles missing values (`na`) by ignoring invalid points.
- Includes error handling for zero variance to avoid division-by-zero scenarios.
- Kurtosis is calculated as the normalized fourth central moment of the data.
regression(y, x, lag)
Parameters:
y (float) : (series float): Dependent series (observed values).
x (float) : (series float): Independent series (explanatory variable).
lag (int) : (int): Number of lags applied to the independent series (x).
Returns: (tuple): Returns a tuple containing the following values:
- n: Number of valid observations.
- alpha: Intercept of the regression line.
- beta: Slope of the regression line.
- t_stat: T-statistic for the beta coefficient.
- p_value: Two-tailed p-value for the beta coefficient.
- r_squared: Coefficient of determination (R²) indicating goodness of fit.
- skew: Skewness of the residuals.
- kurt: Kurtosis of the residuals.
Notes:
- Handles missing data (`na`) by ignoring invalid points.
- Includes basic error handling for zero variance and division-by-zero scenarios.
- Computes residual-based statistics (skewness and kurtosis) for model diagnostics.
Adaptive Fisherized Z-scoreHello Fellas,
It's time for a new adaptive fisherized indicator of me, where I apply adaptive length and more on a classic indicator.
Today, I chose the Z-score, also called standard score, as indicator of interest.
Special Features
Advanced Smoothing: JMA, T3, Hann Window and Super Smoother
Adaptive Length Algorithms: In-Phase Quadrature, Homodyne Discriminator, Median and Hilbert Transform
Inverse Fisher Transform (IFT)
Signals: Enter Long, Enter Short, Exit Long and Exit Short
Bar Coloring: Presents the trade state as bar colors
Band Levels: Changes the band levels
Decision Making
When you create such a mod you need to think about which concepts are the best to conclude. I decided to take Inverse Fisher Transform instead of normalization to make a version which fits to a fixed scale to avoid the usual distortion created by normalization.
Moreover, I chose JMA, T3, Hann Window and Super Smoother, because JMA and T3 are the bleeding-edge MA's at the moment with the best balance of lag and responsiveness. Additionally, I chose Hann Window and Super Smoother because of their extraordinary smoothing capabilities and because Ehlers favours them.
Furthermore, I decided to choose the half length of the dominant cycle instead of the full dominant cycle to make the indicator more responsive which is very important for a signal emitter like Z-score. Signal emitters always need to be faster or have the same speed as the filters they are combined with.
Usage
The Z-score is a low timeframe scalper which works best during choppy/ranging phases. The direction you should trade is determined by the last trend change. E.g. when the last trend change was from bearish market to bullish market and you are now in a choppy/ranging phase confirmed by e.g. Chop Zone or KAMA slope you want to do long trades.
Interpretation
The Z-score indicator is a momentum indicator which shows the number of standard deviations by which the value of a raw score (price/source) is above or below the mean value of what is being observed or measured. Easily explained, it is almost the same as Bollinger Bands with another visual representation form.
Signals
B -> Buy -> Z-score crosses above lower band
S -> Short -> Z-score crosses below upper band
BE -> Buy Exit -> Z-score crosses above 0
SE -> Sell Exit -> Z-score crosses below 0
If you were reading till here, thank you already. Now, follows a bunch of knowledge for people who don't know the concepts I talk about.
T3
The T3 moving average, short for "Tim Tillson's Triple Exponential Moving Average," is a technical indicator used in financial markets and technical analysis to smooth out price data over a specific period. It was developed by Tim Tillson, a software project manager at Hewlett-Packard, with expertise in Mathematics and Computer Science.
The T3 moving average is an enhancement of the traditional Exponential Moving Average (EMA) and aims to overcome some of its limitations. The primary goal of the T3 moving average is to provide a smoother representation of price trends while minimizing lag compared to other moving averages like Simple Moving Average (SMA), Weighted Moving Average (WMA), or EMA.
To compute the T3 moving average, it involves a triple smoothing process using exponential moving averages. Here's how it works:
Calculate the first exponential moving average (EMA1) of the price data over a specific period 'n.'
Calculate the second exponential moving average (EMA2) of EMA1 using the same period 'n.'
Calculate the third exponential moving average (EMA3) of EMA2 using the same period 'n.'
The formula for the T3 moving average is as follows:
T3 = 3 * (EMA1) - 3 * (EMA2) + (EMA3)
By applying this triple smoothing process, the T3 moving average is intended to offer reduced noise and improved responsiveness to price trends. It achieves this by incorporating multiple time frames of the exponential moving averages, resulting in a more accurate representation of the underlying price action.
JMA
The Jurik Moving Average (JMA) is a technical indicator used in trading to predict price direction. Developed by Mark Jurik, it’s a type of weighted moving average that gives more weight to recent market data rather than past historical data.
JMA is known for its superior noise elimination. It’s a causal, nonlinear, and adaptive filter, meaning it responds to changes in price action without introducing unnecessary lag. This makes JMA a world-class moving average that tracks and smooths price charts or any market-related time series with surprising agility.
In comparison to other moving averages, such as the Exponential Moving Average (EMA), JMA is known to track fast price movement more accurately. This allows traders to apply their strategies to a more accurate picture of price action.
Inverse Fisher Transform
The Inverse Fisher Transform is a transform used in DSP to alter the Probability Distribution Function (PDF) of a signal or in our case of indicators.
The result of using the Inverse Fisher Transform is that the output has a very high probability of being either +1 or –1. This bipolar probability distribution makes the Inverse Fisher Transform ideal for generating an indicator that provides clear buy and sell signals.
Hann Window
The Hann function (aka Hann Window) is named after the Austrian meteorologist Julius von Hann. It is a window function used to perform Hann smoothing.
Super Smoother
The Super Smoother uses a special mathematical process for the smoothing of data points.
The Super Smoother is a technical analysis indicator designed to be smoother and with less lag than a traditional moving average.
Adaptive Length
Length based on the dominant cycle length measured by a "dominant cycle measurement" algorithm.
Happy Trading!
Best regards,
simwai
---
Credits to
@cheatcountry
@everget
@loxx
@DasanC
@blackcat1402

Chatterjee CorrelationThis is my first attempt on implementing a statistical method. This problem was given to me by @lejmer (who also helped me later on building more efficient code to achieve this) when we were debating on the need for higher resource allocation to run scripts so it can run longer and faster. The major problem faced by those who want to implement statistics based methods is that they run out of processing time or need to limit the data samples. My point was that such things need be implemented with an algorithm which suits pine instead of trying to port a python code directly. And yes, I am able to demonstrate that by using this implementation of Chatterjee Correlation.
🎲 What is Chatterjee Correlation?
The Chatterjee rank Correlation Coefficient (CCC) is a method developed by Sourav Chatterjee which can be used to study non linear correlation between two series.
Full documentation on the method can be found here:
arxiv.org
In short, the formula which we are implementing here is:
Algorithm can be simplified as follows:
1. Get the ranks of X
2. Get the ranks of Y
3. Sort ranks of Y in the order of X (Lets call this SortedYIndices)
4. Calculate the sum of adjacent Y ranks in SortedYIndices (Lets call it as SumOfAdjacentSortedIndices)
5. And finally the correlation coefficient can be calculated by using simple formula
CCC = 1 - (3*SumOfAdjacentSortedIndices)/(n^2 - 1)
🎲 Looks simple? What is the catch?
Mistake many people do here is that they think in Python/Java/C etc while coding in Pine. This makes code less efficient if it involves arrays and loops. And the simple code may look something like this.
var xArray = array.new()
var yArray = array.new()
array.push(xArray, x)
array.push(yArray, y)
sortX = array.sort_indices(xArray)
sortY = array.sort_indices(yArray)
SumOfAdjacentSortedIndices = 0.0
index = array.get(xSortIndices, 0)
for i=1 to n > 1? n -1 : na
indexNext = array.get(sortX, i)
SumOfAdjacentSortedIndices += math.abs(array.get(sortY, indexNext)-array.get(sortY, index))
index := indexNext
correlation := 1 - 3*SumOfAdjacentSortedIndices/(math.pow(n,2)-1)
But, problem here is the number of loops run. Remember pine executes the code on every bar. There are loops run in array.sort_indices and another loop we are running to calculate SumOfAdjacentSortedIndices. Due to this, chances of program throwing runtime errors due to script running for too long are pretty high. This limits greatly the number of samples against which we can run the study. The options to overcome are
Limit the sample size and calculate only between certain bars - this is not ideal as smaller sets are more likely to yield false or inconsistent results.
Start thinking in pine instead of python and code in such a way that it is optimised for pine. - This is exactly what we have done in the published code.
🎲 How to think in Pine?
In order to think in pine, you should try to eliminate the loops as much as possible. Specially on the data which is continuously growing.
My first thought was that sorting takes lots of time and need to find a better way to sort series - specially when it is a growing data set. Hence, I came up with this library which implements Binary Insertion Sort.
Replacing array.sort_indices with binary insertion sort will greatly reduce the number of loops run on each bar. In binary insertion sort, the array will remain sorted and any item we add, it will keep adding it in the existing sort order so that there is no need to run separate sort. This allows us to work with bigger data sets and can utilise full 20,000 bars for calculation instead of few 100s.
However, last loop where we calculate SumOfAdjacentSortedIndices is not replaceable easily. Hence, we only limit these iterations to certain bars (Even though we use complete sample size). Plots are made for only those bars where the results need to be printed.
🎲 Implementation
Current implementation is limited to few combinations of x and fixed y. But, will be converting this into library soon - which means, programmers can plug any x and y and get the correlation.
Our X here can be
Average volume
ATR
And our Y is distance of price from moving average - which identifies trend.
Thus, the indicator here helps to understand the correlation coefficient between volume and trend OR volatility and trend for given ticker and timeframe. Value closer to 1 means highly correlated and value closer to 0 means least correlated. Please note that this method will not tell how these values are correlated. That is, we will not be able to know if higher volume leads to higher trend or lower trend. But, we can say whether volume impacts trend or not.
Please note that values can differ by great extent for different timeframes. For example, if you look at 1D timeframe, you may get higher value of correlation coefficient whereas lower value for 1m timeframe. This means, volume to trend correlation is higher in 1D timeframe and lower in lower timeframes.
