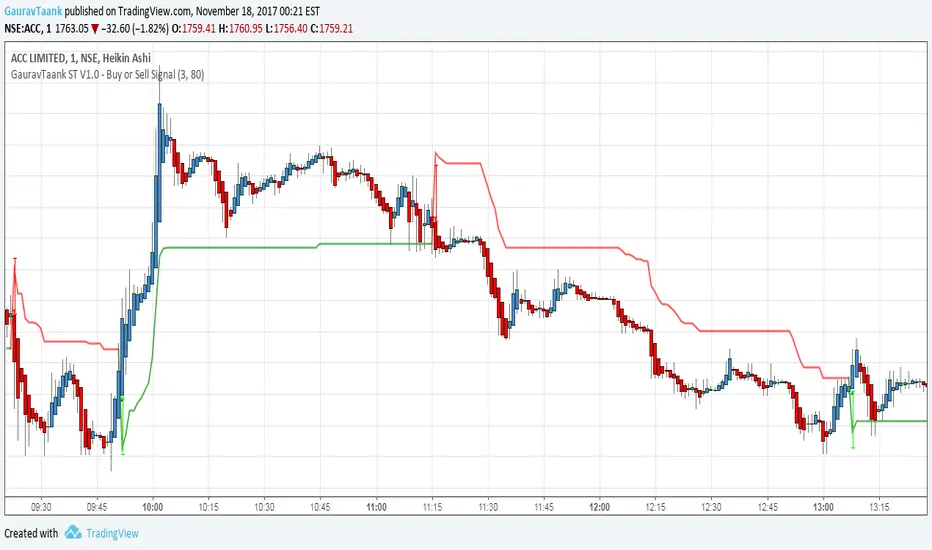
GauravTaank ST V1.0 - Buy or Sell SignalThis Indicator Indicates Trend of Script where To Buy Or Sell
Cerca negli script per "非ST、非创业板、非科创板主板股票的筹码分布数据"
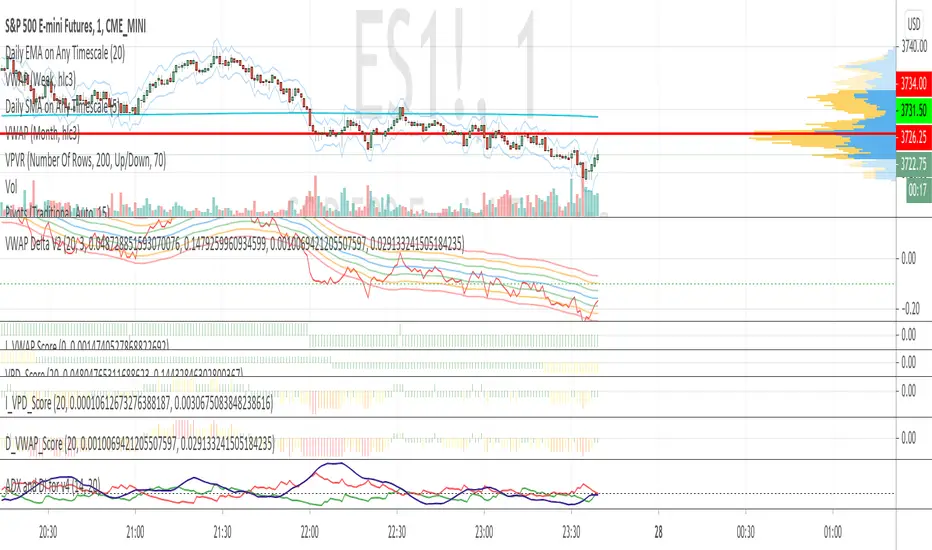
Supertrend CloudSupertrend is a simple yet great indicator which is based hard data, especially when combined with an additional ST line which has its multiplication doubled.
Enjoy :)

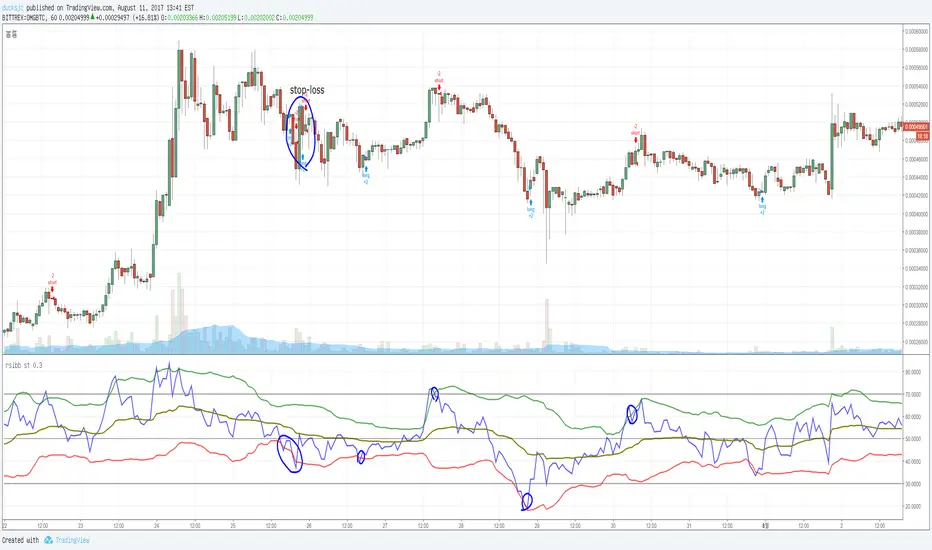
rsi+bb stadded BB in rsi .
if rsi touch green, sell.
if rsi touch red, buy.
also it has stop-loss function.
DecisionPoint Price Momentum Oscillator [LazyBear]The DecisionPoint Price Momentum Oscillator (PMO) is an oscillator based on a Rate of Change calculation that is smoothed twice with custom exponential moving averages. Because the PMO is normalized, it can also be used as a relative strength tool.
PMO can be used in many ways:
- PMO can be used to determine the OB/OS state. While the +2.5 to -2.5 is the usual range for broad stock market indexes, each price index will have its own “signature” range. You may have to tune this for your instrument.
- PMO triggers buy/sell on signal crossovers and ZERO crossovers.
- Common patterns like BullKiss, BearKiss are useful to track. See the link below for more info.
- Divergences.
- Histo-only mode that can be used similar to MACD-Histo.
I have exposed all params as configurable. Have fun tuning :) Don't forget to share what you found for your instrument.
More Info:
stockcharts.com
List of my public indicators: bit.ly
List of my app-store indicators: blog.tradingview.com
Some Sample Charts:
TWTR:
MSFT:
GOOGL:

MACD Color Trawler (by ChartArt)This version of the MACD indicator is 'trawling' (checking) if the MACD histogram and the zero line crossing with the MACD line are both positive or negative. The idea behind this is to show areas with higher or lower risk.
Features:
1. Enable the bar color
2. Enable the background color
3. Change zero line value
FYI:
"The MACD-Histogram is an indicator of an indicator. In fact, MACD is also an indicator of an indicator. This means that the MACD-Histogram is the fourth derivative of price."
First derivative: 12-day EMA and 26-day EMA
Second derivative: MACD (12-day EMA less the 26-day EMA)
Third derivative: MACD signal line (9-day EMA of MACD)
Fourth derivative: MACD-Histogram (MACD less MACD signal line)
Source: stockcharts.com