angle bar colors [LM]Hello guys,
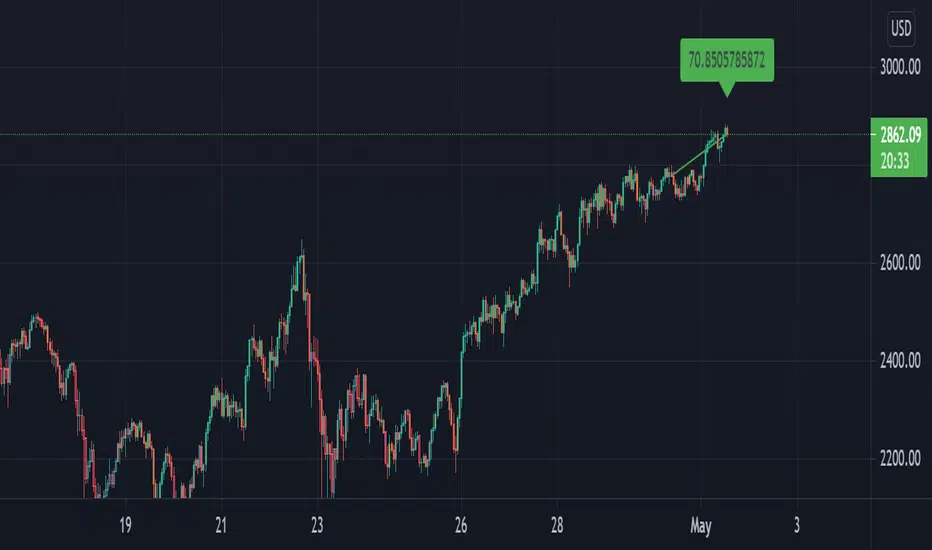
I would like to introduce you angle bar colors indicator. It colors bars depending the angle of the bar x length back and current one
lime angle > 70 degrees
green 20 < angle < 70 degrees
orange 0 > angle <= 20 degrees
purple 0 > angle >= -20 degrees
red -20 > angle > -70 degrees
maroon angle < -70 degrees
Any suggestions are welcome
Cerca negli script per "黄金近20年走势"
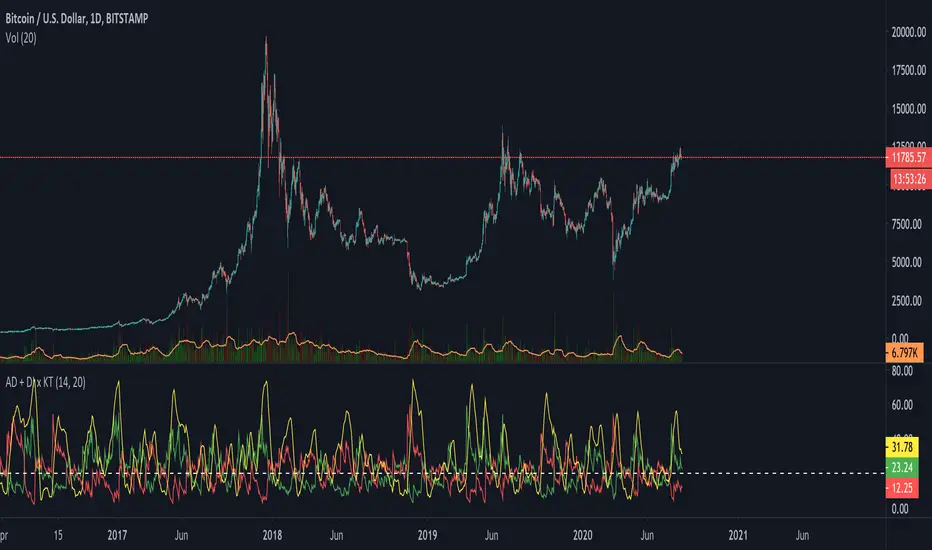
ADX + DI x Upgraded to Pine v4 x KingThiesAverage Directional Movement Index
Momentum based tool to measure trend strength on scale of 1-100
Similar to the aroon but incorporates a 3rd measure, while aroon uses two
The majority of these calculations were pre-existing in older pine scripts but have since been updated
signals are given when -DI and +DI cross, ADX illustrates corresponding strength at time of cross
Full Intro
ADX can help investors to identify trend strengths, as di - di determines the trend direction, while d - d is an impulse indicator. If the ADX is below 20, it can be considered impulsive, while it is above 25 on a trend line.
A trading signal can be generated when the di - DI line is switched to d - d and vice versa. If the di-line crosses and the ADX is above 20 (ideally 25), a potential buy signal could ebb away.
If the ADX is above 20, there is the possibility of potential short selling if the DI crosses over DI. You can also use crosses to get out of the current deal if you need it for a long time.
If the di-line is crossed and the Adx is below 20 (or 25), there may be opportunities to enter the potential for short trading, but only if di are above or below DI or if the price is trendy and may not prove to be the ideal time to start trading.
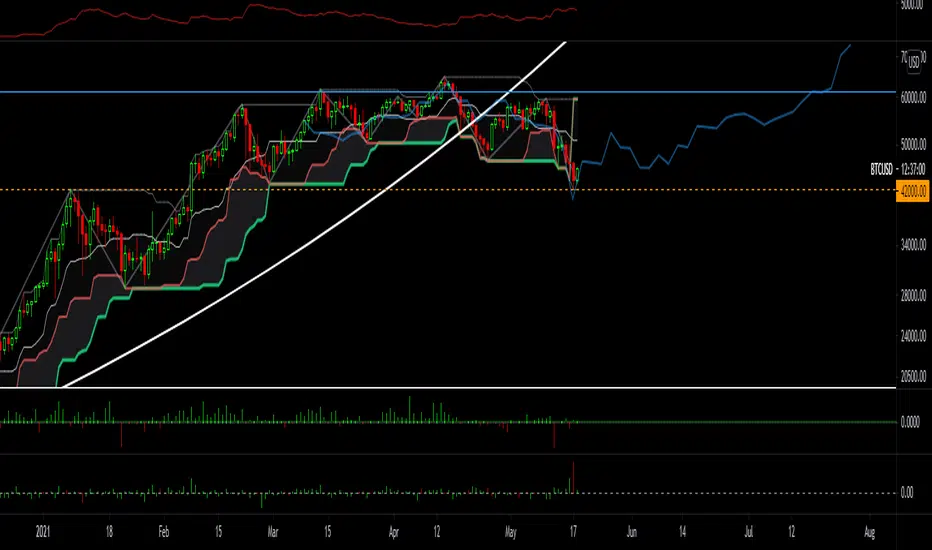
Weeknights Donchian CloudDonchian Channel Trading system visualised as a cloud.
Regular/Quick inputs;
Length: 20
Entry Length: 20
Stop Length: 10
Alternate/Slower Inputs;
Length: 55
Entry Length: 55
Stop Length: 20
For a more in-depth review, look up "Turtle Trading" rules
The simplest way to use the cloud;
-When the cloud flips from above to below (support), close any shorts and open a long
-When the cloud flips from below to above (resistance), close any longs and open a short
-Cloud is flipped based on a breakout on the high / low
-Most effectively used on the daily, but can be used on any time frame
-For traditional markets, an input of 20 is most commonly used
-For 24/7 markets, an input of 28 is most commonly used
-Find an input that makes the most sense to you!
I appreciate any feedback, feel free to message me on twitter / comment!
Twitter ; @ImWeeknight
Credit to user KivancOzbilgic for helping with the script
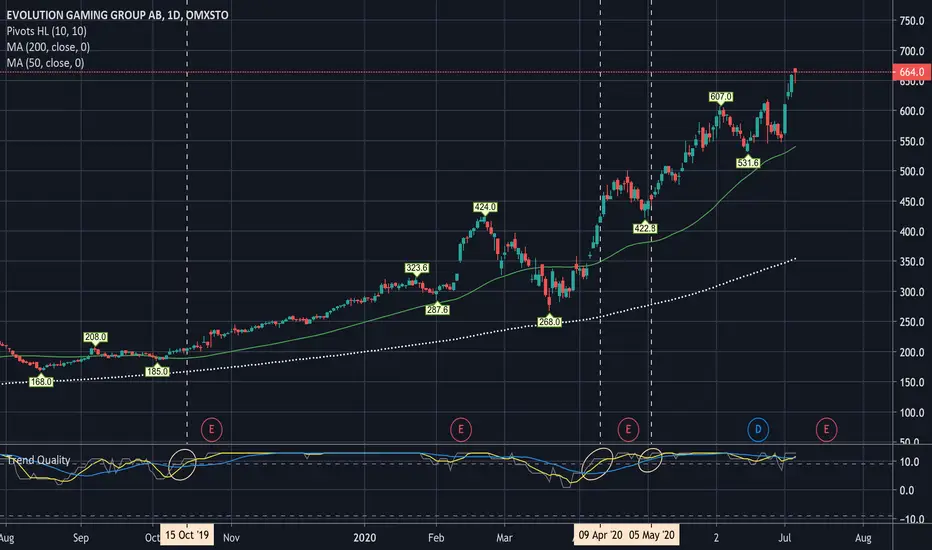
Trend QualityThe quality of the current trend is calculated by adding or subtracting
one point to the total value depending on the following criteras:
1. EMA-8, MA-20, MA-50, MA-100, MA-200 , each get a point if they are increasing.
2. EMA-8 > MA-20 > MA-20 > MA-50 > MA-100 > MA-200 , each condition that is true gets one point.
On top of the Trend Quality value we apply a "weekly" (5 periods) and
a "monthly" (22 periods) moving average.
When above a value of 5, a strong trend is indicated and hence
a trend following strategy should be used.
Use this to Buy when bouncing back from e.g MA-20 or a confirming
consolidation/candlestick/trendline pattern.
When the trend decreases below Zero a trend shift may have occured.
Idea, curtesy: Tobbe Rosèn
Simple Moving Average Double HelixThis one is a mix of colour-coded moving averages and Ichimoku. It features two pairs of SMAs--default values of 9/20 and 50/200. Each SMA will be green when it rises and red when it falls. The spaces between each pair will fill with green or red depending on which line is on top. 9 over 20 or 50 over 200 makes a green cloud; if 9 or 50 falls below, the cloud will switch to green.
There's also the Ichimoku lagging span and a 35-period SMA (grey) that can be used as a trailing stop loss guideline.
Ideal long setup:
9, 20, 50, and 200 SMA are all green
both clouds are green
lagging span is above historic price action
Ideal short setup:
9, 20, 50, and 200 SMA are all red
both clouds are red
lagging span is below historic price action

TA Basics: further "Steps" with our Moving AverageSo far in this series of posts, we have worked thru creating a basic zero-lag moving average, then moved forward all the way to coding a "Fibonacci" Weighted Moving Average.
in this post we take a look at a technique that can help traders minimize noise in the underlying data and get better insight on the changes that are happening in the data series represented by the moving average. we'll look at adding "stepping" to our Fibonacci Moving Average as an example. we introduce the Stepping Fibonacci Moving Average , or Step_FiMA
note that you can use the same technique with any plot you may have. feel free to copy or leverage the relevant parts of the script - the script is commented to make this easier.
How is this useful?
==================
with "stepping", you get your indicator to "round" the outcome into pre-specified bands or ranges. this works very similar to how, for example, range or Renko charts work. you can easily see the difference in the chart above once we look at a non-stepped and a stepping moving average of the same length side-by-side
the more granular your timeframe is, you will see the effect of the stepping clearer - here's how the same chart looks when we go into the 1-hr aggregation
Notes about this script
====================
there are couple of pieces i wanted to highlight in the script if you plan to use some of it :
1 - the step(x) function is meant to try to automatically pick the best "suitable" step size based on the range of the underlying series (for example, the closing price). these ranges i included here in the code are just my own "best choices" - you are totally welcome to adjust these ranges and the resulting step size to your own preference
2 - we applied the stepping as a user-choice. user can choose a manual entry, or "0" to get the code to automatically pick the step size, or enter -1 (or actually any value below zero) to cancel the stepping option altogether - this gives us some flexibility on how to use the stepping in an indicator
3 - very important (and somehow confusing): on the "rounding" approach:
the magic math formula that actually creates the stepping is this one
result = round(input / step) * step
now, this tells the script to "round" the result up or down (the basic rounding) -- so for example, a price of 17 with a step of 5 would be rounded (down) to 15, where as a price of 18 would be rounded "up" to 20 -- this is not the way some of us would expect or want, cause the price never reached 20 and they would want an 18 to still be rounded to 15 - and the stepping line not to show 20 *until* the price actually hits or exceeds 20 -- in that case, you would need to replace the function "round" with the function "floor" --
so the new formula becomes: floor(input / step) * step
-- in an ideal world, we can make this rounding choice a user-option in the settings -- maybe in an improved version
4 - we kept the smoothing option, and it takes place before the stepping is applied - we continue to use that smoothing to further minimize the level changes in the FiMA line.
I hope you find this script useful in your journey with technical analysis and DIY scripting, and good luck in your trading.

BTC and ETH Long strategy - version 1I will start with a small introduction about myself. I'm now trading cryto currencies manually for almost 2 years. I decided to start after watching a documentary on the TV showing people who made big money during the Bitcoin pump which happened at the end of 2017.
The next day, I asked myself "Why should I not give it a try and learn how to trade".
This was in February 2018 and the price of Bitcoin was around 11500USD.
I didn't know how to trade. In fact, I didn't know the trading industry at all.
So, my first step into trading was to open an account with a broken. Then I directly bought 200$ worst of BTC . At that time, I saw the graph and thought "This can only go back in the upward direction!" :)
I didn't know anything about Stop loss, Take profit and Risk management.
Today, almost 2 years after, I think that I know how to trade and can also confirm that I still hold this bag of 200$ of bitcoin from 2018 :)
I did spend the 2 last years to learn technical analysis , risk management and leverage trading.
Today (14/05/2020), I know what I'm doing and I'm happy to see that the 2 last years have been positive in terms of gains. Of course, I did not make crazy money with my saving but at least I made more than if I would have kept it in my bank account.
Even if I like trading, I have a full time job which requires my full energy and lots of focus, so, the biggest problem I had is that I didn't have enough time to look at the charts.
Also, I realized that sometimes, neither technical analysis , nor fundamentals worked with crypto currency (at least for short time trading). So, as I have a developer background I decided to try to have a look at algo trading.
The goal for me was neither to make complex algos nor to beat the market but just to automate my trading with simple bot catching the big waves.
I then started to take a look at TV pine script and played with it.
I did my first LONG script in February 2020 to Long the BTC Market. It has some limitations but works well enough for me for the time being. Even if the real trades will bring me half of what the back testing shows, this will still be a lot more than what I was used to win during the last 2 years with my manual trading.
So, here we are! Below you will find some details about my first LONG script. I'm happy to share it with you.
Feel free to play with it, give your comments and bring improvements to it.
But please note that it only works fine with the candle size and crypto pair that I have mentioned below. If you use other settings this algo might loose money!
- Crypto pairs : XBTUSD and ETHXBT
- Candle size: 2 Hours
- Indicator used: Volatility , MACD (12, 26, 7), SMA (100), SMA (200), EMA (20)
- Default StopLoss: -1.5%
- Entry in position if: Volatility < 2%
AND MACD moving up
AND AME (20) moving up
AND SMA (100) moving up
AND SMA (200) moving up
AND EMA (20) > SAM (100)
AND SMA (100) > SMA (200)
- Exit the postion if: Stoploss is reached
OR EMA (20) crossUnder SMA (100)
Here is a summary of the results for this script:
XBTUSD : 01/01/2019 --> 14/05/2020 = +107%
ETHXBT : 01/01/2019 --> 14/05/2020 = +39%
ETHUSD : 01/01/2019 --> 14/05/2020 = +112%
It is far away from being perfect. There are still plenty of things which can be done to improve it but I just wanted to share it :) .
Enjoy playing with it....

BO - Bar M15 2/3 SignalBO - Bar M15 2/3 Signal show the signal to trade Binary Option with rule below:
A. Indicator
* Bollinger Band (20,2): avoid waterfall
B. Rule of Signal
1. Rule1: Split Bar M15 to 3 part and load them on M5 chart (recommend use M5 IDC chart)
2. Rule 2: Delay 10' after bar M15 open => wait for price's pattern
3. Rule 3: Put Signal row 30-32
* Delay 10' after bar M15 open.
* Direction of 1/3 and 2/3 Bar M15 is upward
* close of 2/3 Bar M15 below upper band Bb(20,2) on M5 chart => avoid strong buy
4. Rule 4: Call Signal row 36-38
* Delay 10' after bar M15 open.
* Direction of 1/3 and 2/3 Bar M15 is downward
* close of 2/3 Bar M15 above lower band Bb(20,2) on M5 chart => avoid strong sell
C. Recommend Expiry time: Bar M15 close
* We try to catch the shadow of Bar M15 but dont trade when price run on the upper or lower band of BB(20,2,M5)

Average Candle Length 2.0This script will tell you the following:
• Average length of all the candles (wick to wick) for the last 20 candles
-- shown in blue
• Average length of bull (green) candles (wick to wick) for the last 20 candles
-- shown in green
• Average length of bear (red) candles (wick to wick) for the last 20 candles
-- shown in red
___________________________________________
Inputs:
• # of Candles to analyze (default = 20)
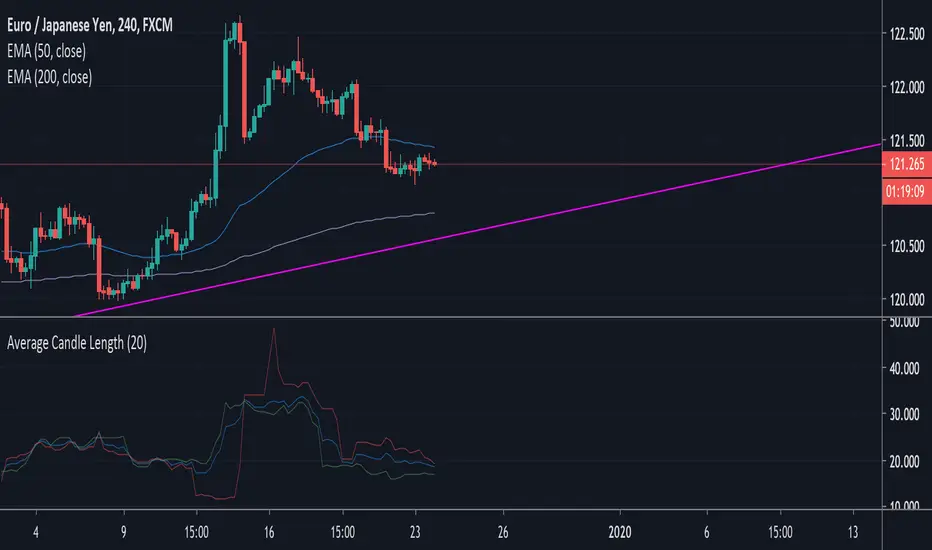
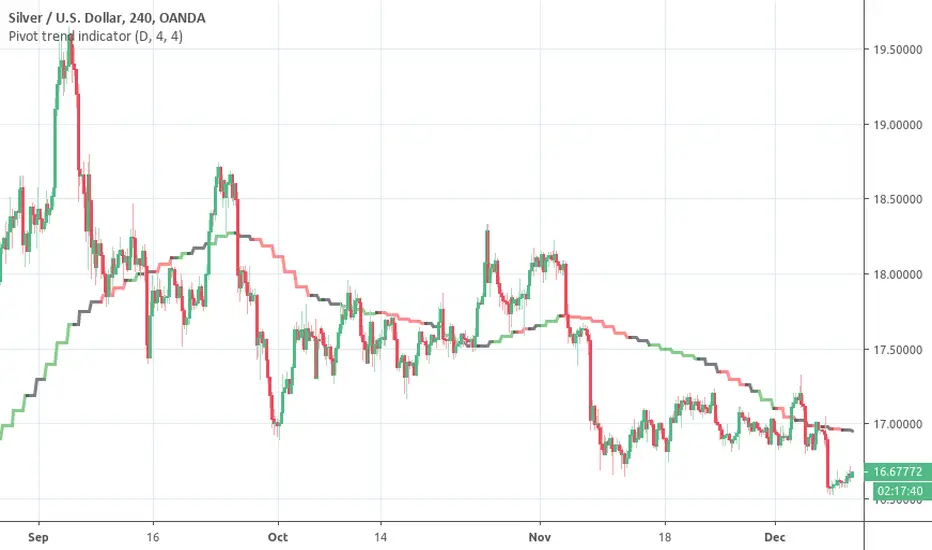
Pivot trend indicatorThis is a LAGGING indicator which can provide a good indication of trend. It require a certain (configurable) number of candles to have closed before it can determine whether a pivot has formed.
It provides a 20 period SMA for the timeframe of your choice which is color coded to show the trend according to confirmed pivots.
Anticipated usage:
Long / Short bias is determined by pivot trend
Trader seeks entries according to their strategy
Black consolidation areas may trigger a re-evaluation of the trade and can serve as good profit taking areas
The SMA colors:
Green -> Higher highs & Higher lows
Red -> Lower highs & Lowers lows
Black -> No clear trend from the pivots
Why the 20 SMA?
Feel free to adjust it for your purposes. I personally find that using a higher time frame 20 SMA is a better indication of trend than longer period MAs on shorter time frames. This can be seen from comparing the 20 daily SMA and 200 hourly SMA.
Pivot adjustment
The pivots use the selected time frame (not) the MA trend time frame. You can specify the left and right candles required to confirm a pivot
VIX reversion-Buschi
English:
A significant intraday reversion (commonly used: 3 points) on a high (over 20 points) S&P 500 Volatility Index (VIX) can be a sign of a market bottom, because there is the assumption that some of the "big guys" liquidated their options / insurances because the worst is over.
This indicator shows these reversions (3 points as default) when the VIX was over 20 points. The character "R" is then shown directly over the daily column, the VIX need not to be loaded explicitly.
Deutsch:
Eine deutliche Intraday-Umkehr (3 Punkte im Normalfall) bei einem hohen (über 20 Punkte) S&P 500 Volatility Index (VIX) kann ein Zeichen für eine Bodenbildung im Markt sein, weil möglicherweise einige "große Jungs" ihre Optionen / Versicherungen auflösen, weil das schlimmste vorbei ist.
Dieser Indikator zeigt diese Umkehr (Standardwert: 3 Punkte), wenn der VIX vorher über 20 Punkte lag. Der Buchstabe "R" wird dabei direkt über dem Tagesbalken angezeigt, wobei der VIX nicht explizit geladen werden muss.

Triple Moving Average HeatmapHi everyone
I didn't publish on Friday because I was working on an Expert Advisor in MT4. The day I don't publish, some scripts spamming guys published many (not useful) scripts the same to kick me out of the TOP #1 ranking.
So what I'm going to do about it? crying or sharing more quality scripts than before? :)
I guess you know the answer :) I'm gonna share a few quality scripts that I have in my library. I noticed that you guys tend to like more the scripts useful for your trading actually making you money rather than a copy-paste (of another copy-paste)
Alright, enough for the trolling now let's introduce the Three MA heatmap which is an upgrade of that script : MA-heatmap-Double-cross-edition/
The challenge was to keep the heatmap not rolling and to make it match with the MA cross. I did it using this
```
since_ma_buy = barssince(macrossover)
since_ma_sell = barssince(macrossunder)
heatmap_color() =>
since_ma_buy < since_ma_sell ? color.new(color.green, 20) : since_ma_buy > since_ma_sell ? color.new(color.red, 20) : na
```
This is a technique that I found after drinking three glasses of red wine (#french) to keep the heatmap stable and not rolling.
To get what I'm saying I invite you to replace the piece of code above by what everyone would normally do
```
heatmap_color() =>
macrossunder() ? color.new(color.green, 20) : macrossover() ? color.new(color.red, 20) : na
```
Ah and I'm not done sharing for the day, a few scripts are coming also after that one and tonight !!!!! I want to live in a world where you guys can enjoy quality scripts (mostly) :)
PS
____________________________________________________________
Feel free to hit the thumbs up as it shows me that I'm not doing this for nothing and will motivate to deliver more quality content in the future.
- I'm an officially approved PineEditor/LUA/MT4 approved mentor on codementor. You can request a coaching with me if you want and I'll teach you how to build kick-ass indicators and strategies
Jump on a 1 to 1 coaching with me
- You can also hire for a custom dev of your indicator/strategy/bot/chrome extension/python

Palex 2.0Atualização do SETUP do saudoso Professor Alexandre Fernandes "Palex"
- Bandas de Bolliger (Standard) =
*Banda Superior = Média Móvel Simples (20 dias) + (2 x Desvio Padrão de 20 dias)
*Banda Inferior = Média Móvel Simples (20 dias) – (2 x Desvio Padrão de 20 dias)
- EMA 9 (Média Móvel Exponencial)
- SMA 21 (Média Móvel Simples)
- SMA 200 (Média Móvel Simples) Clássica MA 200 períodos
- SMA 400 (Média Móvel Simples)
- EMA 400 (Média Móvel Exponencial)
- WILD (Média Móvel Welles Wilder)
O mesmo usado pelo nosso grande Mestre PALEX!
The 6 Line Death PunchIf you are looking to discover what trend you are in, you need to first what direction the price is going in...
I've been using and testing a mixture of EMA's and SMA's for a long time and I've found that these ones are by far the best.
EMA 3
EMA 8
MA 20
EMA 55
MA 100
MA 200
EMA 3 & 8 Crossover is a good method for confirming a coin going to the upside or to the downside.
EMA 8 is known as the Trigger Line (trademarked brand) as one of the fib numbers it shows good support or resistance of a trend.
MA 20 universal way of seeing trend direction in the stock market, works well with crypto too.
EMA 55, another trusty fib number. Works very well and could trade off that alone as support and resistance.
MA 100 and MA 200. Long ranged moving averages which govern the overall longer-term trend.
LONG ENTRY
Option 1 - 3/8 crossover
Option 2 - Candles above EMA 8
Option 3 - Candles above MA 20
Option 4 - Candles Above EMA 55.
SHORT ENTRY
Option 1 - 3/8 crossover
Option 2 - Candles below EMA 8
Option 3 - Candles below MA 20
Option 4 - Candles below EMA 55.

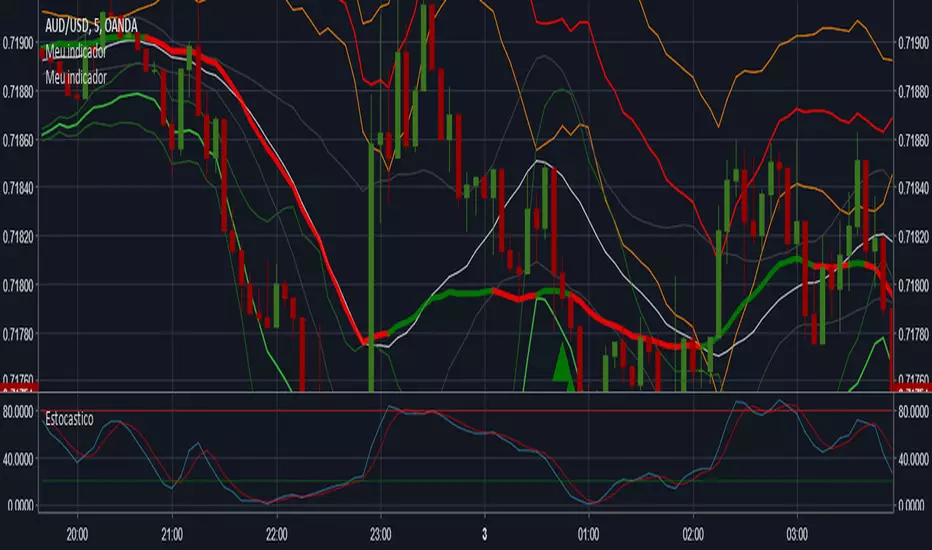
Signals for call and putSorry for the Google Translate English
Indicator for signals of call and put, using Bollinger bands (period 20, standard deviation 2.5), market trend of (sma, períod 100) and stochastic (period 20, %D 3).
I was overthrown but in pine scrip, the function "stoch()" no way to smooth (3). If anyone knows how to smooth inside the script, help me! Please.
With smoothed stochastic the hit rate grows a lot.
Português (Pt-Br)
Indicador de sinais de compra e venda, usando bandas de Bollinger (período de 20, desvio de 2,5), tendencia de mercado com (sma período 100) e estocástico (período 20, %D de 3).
Eu travei porque no pine script, a função "stoch()" não tem como aplicar a suavização (3). Se alguem souber como suavizar dentro do script, me ajude! Por favor.
MG - Multiple Moving Averages & Candle Wick Alerts - 1.0Features:
- Each moving average has customizable length, type and source
- The ability to change the source of all moving averages with one input (changing an individual MA source will override the general for that MA)
- At a glance comparison of 20 SMA and 20 VWMA to gauge volume trend
- Wick alerts which can be toggled for each moving average.
- Bullish wick alerts are when the wick is the only part of the candle to drop below the moving average
- Bearish wick alerts are when the wick is the only part of the candle to reach above the moving average
- Simple candle closed alert if you want a notification, for example each hour.
Defaults: Four SMAs (20, 50, 100, 200) and a 20 VWMA .
Recommended Usage:
- Set the general source (sets the source of all moving averages) to 'low' when in an uptrend and 'high' in a downtrend to maximize Risk : Reward.
- Use Fibonacci levels, oscillators .etc for confluence
NOTE: The moving average component of this indicator is the same as the previous indicator ()
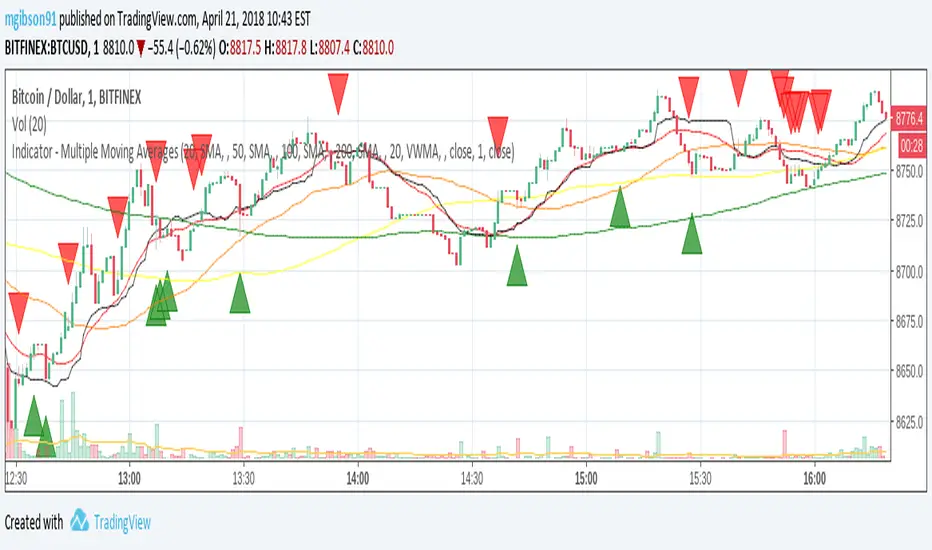
Indicator - Multiple Moving Averages 1.0Features:
- Each moving average has customizable length, type and source
- The ability to change the source of all moving averages with one input (changing an individual MA source will override the general for that MA)
- At a glance comparison of 20 SMA and 20 VWMA to gauge volume trend
Defaults: Four SMAs (20, 50, 100, 200) and a 20 VWMA.
Usage:
- Use Fibonacci levels, pivots .etc for confluence
- Personally, I like to set overall source to low in uptrends, to high in downtrends and then set alerts for when the price crosses any of the averages. Then pay particular attention to the candlesticks and other indicators.
TODO:
- Add alerts option so that it send alert on crossing up or down any alert lines.

XPloRR MA-Trailing-Stop StrategyXPloRR MA-Trailing-Stop Strategy
Long term MA-Trailing-Stop strategy with Adjustable Signal Strength to beat Buy&Hold strategy
None of the strategies that I tested can beat the long term Buy&Hold strategy. That's the reason why I wrote this strategy.
Purpose: beat Buy&Hold strategy with around 10 trades. 100% capitalize sold trade into new trade.
My buy strategy is triggered by the fast buy EMA (blue) crossing over the slow buy SMA curve (orange) and the fast buy EMA has a certain up strength.
My sell strategy is triggered by either one of these conditions:
the EMA(6) of the close value is crossing under the trailing stop value (green) or
the fast sell EMA (navy) is crossing under the slow sell SMA curve (red) and the fast sell EMA has a certain down strength.
The trailing stop value (green) is set to a multiple of the ATR(15) value.
ATR(15) is the SMA(15) value of the difference between the high and low values.
The scripts shows a lot of graphical information:
The close value is shown in light-green. When the close value is lower then the buy value, the close value is shown in light-red. This way it is possible to evaluate the virtual losses during the trade.
the trailing stop value is shown in dark-green. When the sell value is lower then the buy value, the last color of the trade will be red (best viewed when zoomed)(in the example, there are 2 trades that end in gain and 2 in loss (red line at end))
the EMA and SMA values for both buy and sell signals are shown as a line
the buy and sell(close) signals are labeled in blue
How to use this strategy?
Every stock has it's own "DNA", so first thing to do is tune the right parameters to get the best strategy values voor EMA , SMA, Strength for both buy and sell and the Trailing Stop (#ATR).
Look in the strategy tester overview to optimize the values Percent Profitable and Net Profit (using the strategy settings icon, you can increase/decrease the parameters)
Then keep using these parameters for future buy/sell signals only for that particular stock.
Do the same for other stocks.
Important : optimizing these parameters is no guarantee for future winning trades!
Here are the parameters:
Fast EMA Buy: buy trigger when Fast EMA Buy crosses over the Slow SMA Buy value (use values between 10-20)
Slow SMA Buy: buy trigger when Fast EMA Buy crosses over the Slow SMA Buy value (use values between 30-100)
Minimum Buy Strength: minimum upward trend value of the Fast SMA Buy value (directional coefficient)(use values between 0-120)
Fast EMA Sell: sell trigger when Fast EMA Sell crosses under the Slow SMA Sell value (use values between 10-20)
Slow SMA Sell: sell trigger when Fast EMA Sell crosses under the Slow SMA Sell value (use values between 30-100)
Minimum Sell Strength: minimum downward trend value of the Fast SMA Sell value (directional coefficient)(use values between 0-120)
Trailing Stop (#ATR): the trailing stop value as a multiple of the ATR(15) value (use values between 2-20)
Example parameters for different stocks (Start capital: 1000, Order=100% of equity, Period 1/1/2005 to now) compared to the Buy&Hold Strategy(=do nothing):
BEKB(Bekaert): EMA-Buy=12, SMA-Buy=44, Strength-Buy=65, EMA-Sell=12, SMA-Sell=55, Strength-Sell=120, Stop#ATR=20
NetProfit: 996%, #Trades: 6, %Profitable: 83%, Buy&HoldProfit: 78%
BAR(Barco): EMA-Buy=16, SMA-Buy=80, Strength-Buy=44, EMA-Sell=12, SMA-Sell=45, Strength-Sell=82, Stop#ATR=9
NetProfit: 385%, #Trades: 7, %Profitable: 71%, Buy&HoldProfit: 55%
AAPL(Apple): EMA-Buy=12, SMA-Buy=45, Strength-Buy=40, EMA-Sell=19, SMA-Sell=45, Strength-Sell=106, Stop#ATR=8
NetProfit: 6900%, #Trades: 7, %Profitable: 71%, Buy&HoldProfit: 2938%
TNET(Telenet): EMA-Buy=12, SMA-Buy=45, Strength-Buy=27, EMA-Sell=19, SMA-Sell=45, Strength-Sell=70, Stop#ATR=14
NetProfit: 129%, #Trade

EMA Indicators with BUY sell SignalCombine 3 EMA indicators into 1. Buy and Sell signal is based on
- Buy signal based on 20 Days Highest High resistance
- Sell signal based on 10 Days Lowest Low support
Input :-
1 - Short EMA (20), Mid EMA (50) and Long EMA (200)
2 - Resistance (20) = 20 Days Highest High line
3 - Support (10) = 10 Days Lowest Low line

Reversal_Detector//@version=6
indicator("상승 반전 탐지기 (Reversal Detector)", overlay=true)
// ==========================================
// 1. 설정 (Inputs)
// ==========================================
rsiLen = input.int(14, title="RSI 길이")
lbR = input.int(5, title="다이버전스 확인 범위 (오른쪽)")
lbL = input.int(5, title="다이버전스 확인 범위 (왼쪽)")
rangeUpper = input.int(60, title="RSI 과매수 기준")
rangeLower = input.int(30, title="RSI 과매도 기준")
// ==========================================
// 2. RSI 상승 다이버전스 계산 (핵심 로직)
// ==========================================
osc = ta.rsi(close, rsiLen)
// 피벗 로우(Pivot Low) 찾기: 주가의 저점
plFound = na(ta.pivotlow(osc, lbL, lbR)) ? false : true
// 다이버전스 조건 확인
// 1) 현재 RSI 저점이 이전 RSI 저점보다 높아야 함 (상승)
// 2) 현재 주가 저점이 이전 주가 저점보다 낮아야 함 (하락)
showBull = false
if plFound
// 이전 피벗 지점 찾기
oscLow = osc
priceLow = low
// 과거 데이터를 탐색하여 직전 저점과 비교
for i = 1 to 60
if not na(ta.pivotlow(osc, lbL, lbR) ) // 이전에 저점이 있었다면
prevOscLow = osc
prevPriceLow = low
// 다이버전스 조건: 가격은 더 떨어졌는데(Lower Low), RSI는 올랐을 때(Higher Low)
if priceLow < prevPriceLow and oscLow > prevOscLow and oscLow < rangeLower
showBull := true
break // 하나 찾으면 루프 종료
// ==========================================
// 3. 보조 조건 (MACD 골든크로스 & 이평선)
// ==========================================
= ta.macd(close, 12, 26, 9)
macdCross = ta.crossover(macdLine, signalLine) // MACD 골든크로스
ma5 = ta.sma(close, 5)
ma20 = ta.sma(close, 20)
maCross = ta.crossover(ma5, ma20) // 5일선이 20일선 돌파
// ==========================================
// 4. 시각화 (Plotting)
// ==========================================
// 1) 상승 다이버전스 발생 시 (강력한 바닥 신호)
plotshape(showBull,
title="상승 다이버전스",
style=shape.labelup,
location=location.belowbar,
color=color.red,
textcolor=color.white,
text="Bull Div\n(바닥신호)",
size=size.small,
offset=-lbR) // 과거 시점에 표시
// 2) MACD 골든크로스 (추세 확인용)
plotshape(macdCross and macdLine < 0, // 0선 아래에서 골든크로스 날 때만
title="MACD 골든크로스",
style=shape.triangleup,
location=location.belowbar,
color=color.yellow,
size=size.tiny,
text="MACD")
// 3) 이동평균선
plot(ma5, color=color.blue, title="5일선")
plot(ma20, color=color.orange, title="20일선")
// 알림 설정
alertcondition(showBull, title="상승 다이버전스 포착", message="상승 다이버전스 발생! 추세 반전 가능성")

Trinity CCI Pro PlusWhat It Is
Trinity CCI Pro Plus is an innovative overlay indicator that reimagines the classic Commodity Channel Index (CCI) by plotting its levels directly on the price chart. No more separate oscillator panel—instead, you get dynamic price-based bands and lines for instant momentum insights.
What You See on the Chart
Orange line: The CCI zero line (20-period SMA of typical price, hlc3)—acts as the baseline.
Aqua line: Dynamic upper band at CCI = +100 (overbought threshold).
Purple line: Dynamic lower band at CCI = -100 (oversold threshold).
Optional thick purple line: The extra SMA of CCI (14-period smooth) scaled back to price—serves as a signal line for crossovers.
Optional outer zones: ±200 bands (aqua/purple extensions) for extreme momentum levels, often added as dotted or filled areas to spot blow-off tops/bottoms.
Key Differences from Regular CCI
Standard CCI lives in a lower pane with fixed horizontal lines at +100, 0, and -100, forcing you to split your focus. This version overlays everything on price: the bands curve with market volatility, the zero line becomes a moving average, and the extra SMA/signal line integrates seamlessly for price-action trading. Plus, it naturally supports outer ±200 zones without extra coding, making extremes visually pop.
How Traders Use It
Momentum breakouts: Buy when price closes above the +100 aqua band (or +200 for aggressive entries); sell below -100 purple (or -200).
Mean reversion: Fade touches on the bands—take profits if price rejects the +100/-100 levels, or watch for exhaustion at ±200.
Trend bias: Price above orange zero = bullish filter; below = bearish. Use the extra SMA for confirmation (e.g., price crossing above it signals upside).
Crossover signals: Price vs. the thick purple SMA line—bullish above, bearish below—pairs perfectly with band breaks.
Range trading: Treat ±100 bands as dynamic support/resistance; outer ±200 zones highlight potential breakout setups.
This setup shines in trending markets (e.g., stocks or forex on 1H/daily charts), turning CCI into a one-glance channel system. Start with the defaults, add the ±200 and extra SMA via simple code tweaks, and backtest for your style—it's versatile and reduces screen clutter dramatically.
More Info
The 20 period MA is the original and still the most common setting for CCI, and it is exactly what the creator of the CCI, Donald Lambert, published it in 1980 with these exact parameters:
Length: 20 periods
Constant: 0.015 (to make CCI fall between +100 and –100 about 70–80 % of the time)
Typical Price: hlc3 (or sometimes (high + low + close)/3)
Deviation measure: Mean Deviation (not standard deviation)
So the “Trinity CCI Pro Plus” you are using is 100 % faithful to Lambert’s original design when the length is set to 20.

Volume Profile DeltaMap [MHA Finverse]Volume Profile DeltaMap with Session Analysis
SHORT DESCRIPTION (for listing)
Advanced Volume Profile indicator with Delta Analysis, Value Area, Volume Nodes, Imbalance Zones, and Multi-Session Profiles. Professional tool for institutional-style volume analysis and market structure understanding.
---
DETAILED DESCRIPTION
📊 OVERVIEW
The Volume Profile DeltaMap is a comprehensive institutional-grade indicator that visualizes volume distribution across price levels, revealing where the most significant trading activity occurred. Unlike traditional indicators that plot data over time, Volume Profile analyzes price levels to identify key support/resistance zones, equilibrium areas, and buyer/seller dominance.
This indicator combines multiple advanced features:
- Volume Profile Analysis with customizable bins
- Delta Heat Map showing buyer vs seller pressure
- Value Area (VAH/VAL) calculations
- High/Low Volume Node Detection
- Imbalance Zone Identification
- Multi-Session Profile Separation (Tokyo, London, NY, Sydney)
- Point of Control (POC) highlighting
---
🎯 KEY FEATURES
1. Volume Profile Core
- Divides price range into customizable bins (10-100 levels)
- Accumulates volume at each price level over a lookback period
- Displays volume distribution horizontally on the chart
- Configurable lookback period (default: 200 bars)
2. Delta Analysis & Heat Map
- Delta (Δ) : Measures the difference between buying and selling pressure
- Color-coded visualization :
- Green/Teal = Buyer dominance
- Red/Pink = Seller dominance
- Heat map intensity : Shows volume concentration with gradient colors
- Percentage labels : Displays exact buyer/seller ratios at each level
3. Point of Control (POC)
- Automatically identifies the price level with maximum volume
- Marked with cyan border and volume label
- Acts as a strong magnetic level where price tends to return
- Often serves as major support/resistance
4. Value Area (VAH/VAL)
- Value Area : Price range containing 70% of total volume (configurable 50-90%)
- VAH (Value Area High) : Upper boundary - resistance level
- VAL (Value Area Low) : Lower boundary - support level
- Displayed with dashed lines and labels
- Represents fair value zone where institutional traders are most active
5. Volume Nodes
- HVN (High Volume Nodes) : Areas with ≥80% of maximum volume
- Highlighted in yellow/amber
- Strong support/resistance zones
- Price tends to consolidate here
- LVN (Low Volume Nodes) : Areas with ≤30% of maximum volume
- Highlighted in orange
- Low liquidity gaps
- Price moves quickly through these zones
- Potential breakout areas
6. Imbalance Zones
- Identifies areas with extreme directional bias (≥70% threshold)
- Buy Imbalance : Green overlay - exhaustion of buying pressure
- Sell Imbalance : Red overlay - exhaustion of selling pressure
- Indicates potential reversal or continuation zones
7. Session-Based Analysis
- Session Background Overlay : Color-codes current trading session
- Separate Session Profiles : Creates individual volume profiles for:
- 🇯🇵 Tokyo Session (00:00-09:00)
- 🇬🇧 London Session (07:00-16:00)
- 🇺🇸 New York Session (13:00-22:00)
- 🇦🇺 Sydney Session (21:00-06:00)
- Compare volume patterns across different market sessions
- Identify session-specific support/resistance levels
---
⚙️ CONFIGURATION SETTINGS
Basic Settings
- LookBack : Number of bars to analyze (50-500 recommended)
- Bins : Number of price levels (10-100, default: 30)
- Horizontal Offset : Adjust profile position on chart
#### Features Toggle
- Delta Heat Map
- Delta Labels
- Volume Bars (Buy/Sell split)
- POC Line
- Custom colors for positive/negative volume
Advanced Features
- Value Area calculation with adjustable percentage
- Volume Nodes (HVN/LVN) with custom thresholds
- Imbalance Zones with adjustable sensitivity
- Session backgrounds and separate profiles
- Profile spacing for multi-session view
---
📈 HOW TO USE THIS INDICATOR
Installation & Setup
1. Add to Chart :
- Search for "Volume Profile DeltaMap"
- Click "Add to favorites" ⭐
- Apply to your chart
2. Recommended Timeframes :
- Scalping : 1-5 minute charts
- Day Trading : 5-15 minute charts
- Swing Trading : 1-4 hour charts
- Position Trading : Daily charts
3. Initial Settings :
- Start with default settings
- For intraday: Set LookBack to 200-400 bars
- For higher timeframes: Use 100-200 bars
4. Enable Session Profiles (Optional):
- Go to Settings → Advanced Features
- Enable "Separate Profiles Per Session"
- Adjust "Profile Spacing" for better visibility
---
🔍 READING THE INDICATOR
Understanding the Display
Main Profile Elements:
- Horizontal bars : Length represents volume at that price
- Color gradient : Shows delta (buyer vs seller dominance)
- Bright cyan line : Point of Control (POC) - highest volume
- Green dashed line : Value Area High (VAH)
- Red dashed line : Value Area Low (VAL)
- Yellow highlights : High Volume Nodes (HVN)
- Orange highlights : Low Volume Nodes (LVN)
Volume Bars (if enabled):
- Top half (Red) : Selling volume percentage
- Bottom half (Teal) : Buying volume percentage
Delta Labels:
- Shows Δ percentage
- Positive = More buyers
- Negative = More sellers
---
📊 MARKET ANALYSIS & TRADING STRATEGIES
1. Support & Resistance Trading
POC as Key Level:
- Price tends to return to POC (magnetic effect)
- Strategy :
- When price is above POC → Look for pullbacks to POC for long entries
- When price is below POC → Look for rallies to POC for short entries
- POC acts as dynamic support/resistance
Value Area Trading:
- Inside Value Area (between VAH & VAL):
- Market is in balance/equilibrium
- Range-bound trading strategies
- Look for mean reversion
- Outside Value Area :
- Price accepted above VAH = Bullish breakout
- Price accepted below VAL = Bearish breakdown
- Trend-following strategies
Example Setup:
Price above VAH + Strong buying delta = Bullish trend
→ Wait for pullback to VAH
→ Enter long with stop below VAH
→ Target: Next HVN or previous session high
2. Volume Node Trading
High Volume Nodes (HVN):
- Characteristics : Strong support/resistance, consolidation zones
- Trading Strategy :
- Price approaching HVN from above → Potential support
- Price approaching HVN from below → Potential resistance
- Breakout from HVN → Strong momentum move
- Setup : Place limit orders at HVN boundaries
Low Volume Nodes (LVN):
- Characteristics : Low liquidity, fast price movement
- Trading Strategy :
- Price in LVN = Don't chase, wait for next HVN
- LVN breakout = Rapid moves, use wider stops
- Price rejection from LVN = Quick return to HVN
- Setup : Avoid placing stops in LVN zones
Example:
Price consolidating at HVN (yellow) near $50,000
→ Breakout above with volume
→ Fast move through LVN (orange) gap
→ Next target: Upper HVN at $51,500
3. Delta Analysis for Entry Timing
Strong Buying Delta (Green zones):
- Δ > +20% = Buyers in control
- Bullish Signal : Accumulation zone
- Strategy : Look for long entries on pullbacks
- Confirmation : Rising price + positive delta
Strong Selling Delta (Red zones):
- Δ < -20% = Sellers in control
- Bearish Signal : Distribution zone
- Strategy : Look for short entries on rallies
- Confirmation : Falling price + negative delta
Delta Divergence (Advanced):
- Bullish Divergence : Price making lower lows, but delta improving (less negative)
- Indicates selling pressure weakening
- Potential reversal signal
- Bearish Divergence : Price making higher highs, but delta weakening (less positive)
- Indicates buying pressure exhausting
- Potential reversal signal
4. Imbalance Zone Trading
Buy Imbalance (Bright Green):
- 70%+ buying pressure
- Interpretation :
- Potential exhaustion of buyers
- Smart money distribution
- Strategy :
- Look for reversal signals (bearish candles, resistance)
- Take profits on long positions
- Consider short entries with confirmation
Sell Imbalance (Bright Red):
- 70%+ selling pressure
- Interpretation :
- Potential exhaustion of sellers
- Smart money accumulation
- Strategy :
- Look for reversal signals (bullish candles, support)
- Take profits on short positions
- Consider long entries with confirmation
Example:
```
Price at VAH with 80% sell imbalance
→ Selling exhaustion likely
→ Wait for bullish reversal candle
→ Enter long with stop below VAL
```
5. Multi-Session Analysis
When "Separate Profiles Per Session" is enabled:
Session-Specific Levels:
- Each session creates its own POC and value area
- Compare sessions to identify:
- Where institutions accumulated/distributed
- Which levels each session respected
- Unfinished business from previous sessions
Trading Strategies:
A. Session POC Confluence
London POC: $49,500
NY POC: $49,550
→ Strong support zone at $49,500-$49,550
→ High probability long setup on pullback
B. Value Area Overlap
London VAH: $50,000
NY VAL: $49,800
→ Overlap creates strong consolidation zone
→ Breakout strategy: Enter on break above $50,000
C. Unfinished Business
London session rejected $51,000 (sell imbalance)
NY session hasn't tested this level yet
→ Watch for NY session to revisit $51,000
→ Potential reversal zone
D. Session Handoff
Tokyo session: Sideways, low volume
London session: Strong buying delta, break above VAH
NY session: Continuation or reversal?
→ Monitor NY open for direction confirmation
6. Market Profile Analysis
Profile Shape Interpretation:
A. P-Shape (Peak at Top)
- High volume at top of range
- Interpretation : Distribution, potential reversal down
- Strategy : Look for shorts at resistance
B. b-Shape (Peak at Bottom)
- High volume at bottom of range
- Interpretation : Accumulation, potential reversal up
- Strategy : Look for longs at support
C. D-Shape (Peak in Middle)
- Balanced profile, POC in center
- Interpretation : Equilibrium, neutral market
- Strategy : Range trading between VAH/VAL
D. Thin Profile (LVN Gap)
- Low volume throughout
- Interpretation : Trending market, little acceptance
- Strategy : Trend following, avoid counter-trend trades
---
🎯 COMPLETE TRADING WORKFLOW
Step 1: Market Structure Analysis
1. Identify overall profile shape
2. Locate POC, VAH, VAL
3. Note HVN and LVN zones
4. Check current price position relative to value area
Step 2: Delta & Imbalance Check
1. Review delta distribution (where are buyers/sellers?)
2. Identify imbalance zones
3. Look for delta divergences
4. Note any exhaustion signals
Step 3: Session Analysis (if enabled)
1. Compare current session vs previous sessions
2. Identify key levels each session created
3. Look for level confluences or gaps
4. Note unfinished business
Step 4: Trade Setup
1. Define your bias (long/short/neutral)
2. Identify entry zone (HVN, VAH/VAL, POC)
3. Set stop loss (below/above key level or opposite LVN)
4. Set target (next HVN, VAH/VAL, or session high/low)
Step 5: Execution & Management
1. Wait for price to reach entry zone
2. Confirm with price action (candlestick patterns)
3. Enter trade with defined risk
4. Move stop to breakeven at first target
5. Trail stop or take profits at resistance/support
---
📋 EXAMPLE TRADE SCENARIOS
Scenario 1: Long Setup at VAL
Setup:
- Price pulled back to VAL ($49,200)
- VAL coincides with HVN (yellow zone)
- Delta showing +15% buying (green)
- London session POC also at $49,200
Entry:
- Buy at $49,200 (VAL/HVN confluence)
- Stop loss: $49,000 (below VAL, in LVN)
- Target 1: $49,800 (POC)
- Target 2: $50,200 (VAH)
Management:
- Move stop to breakeven when Target 1 reached
- Trail stop below recent swing lows
- Exit 50% at VAH, let remainder run
Risk:Reward : 200 points risk / 1000 points potential = 1:5 R:R
---
Scenario 2: Short Setup at Sell Imbalance
Setup:
- Price at VAH ($50,500)
- Sell imbalance zone (85% sellers, bright red)
- Bearish divergence (higher high, weaker delta)
- Previous session rejected this level
Entry:
- Short at $50,500 after bearish engulfing candle
- Stop loss: $50,750 (above VAH + imbalance zone)
- Target 1: $50,000 (POC)
- Target 2: $49,600 (VAL)
Management:
- Take 50% profit at POC
- Trail stop above recent swing highs
- Exit remainder at VAL or if delta turns positive
Risk:Reward : 250 points risk / 900 points potential = 1:3.6 R:R
---
Scenario 3: Range Trading Inside Value Area
Setup:
- Market consolidating between VAH ($50,200) and VAL ($49,600)
- POC at $49,900
- Multiple HVNs creating range boundaries
- Delta oscillating between +/-10%
Long Trade:
- Entry: $49,650 (near VAL)
- Stop: $49,500 (below VAL)
- Target: $50,150 (near VAH)
- Risk:Reward: 150/500 = 1:3.3
Short Trade:
- Entry: $50,150 (near VAH)
- Stop: $50,300 (above VAH)
- Target: $49,700 (near VAL)
- Risk:Reward: 150/450 = 1:3
Management:
- Reduce position size in range trading
- Take profits at opposite boundary
- Exit if breakout occurs (stop hunt possible)
---
Scenario 4: Session Breakout Trade
Setup:
- London session: Range-bound $49,500-$50,000
- London VAH at $50,000 (resistance)
- NY session opens: Strong buying delta (+35%)
- Price breaks above $50,000 with momentum
Entry:
- Buy on breakout above $50,000
- Or buy on retest of $50,000 (old resistance = new support)
- Stop loss: $49,700 (below breakout level + buffer)
- Target 1: $50,500 (next HVN from previous day)
- Target 2: $51,000 (measured move)
Management:
- Enter 50% position on breakout
- Add remaining 50% on successful retest
- Move stop to breakeven when price +$300
- Trail stop below 20 EMA or recent higher lows
Risk:Reward : 300 points risk / 1000 points potential = 1:3.3 R:R
---
⚠️ BEST PRACTICES & RISK MANAGEMENT
Do's:
✅ Use on liquid markets (major crypto, forex, indices)
✅ Combine with price action and candlestick patterns
✅ Wait for confirmation before entering trades
✅ Always use stop losses based on volume structure
✅ Take partial profits at key levels (HVN, VAH/VAL)
✅ Adjust lookback period based on timeframe
✅ Use higher timeframe profiles for context
✅ Compare current profile with previous day/session
✅ Consider volume trends (increasing/decreasing)
✅ Backtest strategies on your specific market
Don'ts:
❌ Don't trade solely based on this indicator
❌ Don't ignore price action and market context
❌ Don't place stops in LVN zones (prone to spikes)
❌ Don't chase price in low volume areas
❌ Don't overtrade - wait for quality setups
❌ Don't use on extremely low volume/illiquid assets
❌ Don't forget to adjust for different market conditions
❌ Don't ignore fundamental news events
❌ Don't use excessive leverage even with good setups
❌ Don't force trades - patience is key
Risk Management Rules:
1. Risk per trade : Never risk more than 1-2% of capital
2. Position sizing : Based on stop loss distance
3. Stop placement : Always below/above key volume levels
4. Profit taking : Scale out at multiple targets
5. Drawdown limits : Stop trading after 3 consecutive losses
6. Win rate expectation : 50-60% is realistic
7. Risk:Reward minimum : Aim for 1:2 or better
8. Correlation : Don't take correlated positions
---
🔧 TROUBLESHOOTING & OPTIMIZATION
If profiles look too compressed:
- Increase "Bins" to 40-50
- Reduce "LookBack" period
- Adjust "Horizontal Offset"
If too cluttered:
- Disable "Delta Labels"
- Disable "Volume Bars"
- Keep only POC and Value Area
- Use "Session Background Overlay" instead of separate profiles
For scalping (1-5 min):
- LookBack: 300-500 bars
- Bins: 20-30
- Enable separate session profiles
- Focus on imbalance zones
For swing trading (1H-4H):
- LookBack: 100-200 bars
- Bins: 25-35
- Focus on VAH/VAL and HVN
- Disable session features
For position trading (Daily):
- LookBack: 50-100 bars
- Bins: 30-40
- Focus on weekly/monthly POC
- Compare with previous week profiles
---
📚 ADVANCED CONCEPTS
1. Composite Profiles
- Build profiles across multiple days
- Increase LookBack to 500+ bars on 15-min chart
- Identifies major support/resistance from weeks of data
- Use for swing trading key levels
2. Profile Migration
- Track how POC moves day over day
- Uptrend : POC migrating higher
- Downtrend : POC migrating lower
- Range : POC oscillating in same area
3. Failed Auctions
- Price briefly leaves value area but quickly returns
- Failed auction high : Bearish signal
- Failed auction low : Bullish signal
- Indicates rejection of new price levels
4. Overnight Inventory
- Compare previous day's close to value area
- Close above VAH : Bullish bias for next day
- Close below VAL : Bearish bias for next day
- Close in value area : Neutral, range expected
5. Volume Delta Momentum
- Track cumulative delta across time
- Rising cumulative delta + rising price : Strong trend
- Falling cumulative delta + rising price : Weak/topping
- Rising cumulative delta + falling price : Potential reversal
---
📊 INTEGRATION WITH OTHER INDICATORS
Complementary Indicators:
1. Moving Averages (20/50/200 EMA)
- Use with POC and VAH/VAL
- Confluence with EMAs = stronger levels
2. RSI/Stochastic
- Overbought at resistance (VAH/HVN) = strong short
- Oversold at support (VAL/HVN) = strong long
3. VWAP
- POC often aligns with VWAP
- Deviation from VWAP + Volume Profile = trade setup
4. Order Flow/Footprint Charts
- Confirm delta analysis
- Detailed buyer/seller pressure
5. Market Profile (TPO)
- Similar concept, different visualization
- Use together for complete picture
Example Multi-Indicator Setup:
Price at VAL ✓
+ 200 EMA support ✓
+ RSI oversold (30) ✓
+ Positive delta zone ✓
+ Bullish engulfing candle ✓
= High probability long entry
---
🎓 LEARNING CURVE & PRACTICE
Week 1-2: Understanding
- Study each feature individually
- Identify POC, VAH, VAL on historical charts
- Note HVN and LVN patterns
- Observe how price reacts to these levels
Week 3-4: Pattern Recognition
- Track different profile shapes
- Identify session-specific patterns
- Note delta distribution patterns
- Document imbalance zone outcomes
Week 5-6: Paper Trading
- Take simulated trades based on setups
- Record entry/exit reasoning
- Track win rate and R:R
- Refine strategy based on results
Week 7-8: Live Trading (Small Size)
- Start with minimal position sizes
- Focus on execution and discipline
- Build confidence with real money
- Gradually increase size as proficiency grows
Ongoing:
- Review trades weekly
- Keep trading journal
- Adapt to changing market conditions
- Continuously refine strategy
---
💡 KEY TAKEAWAYS
1. Volume Profile shows WHERE the market is most active (POC, HVN)
2. Delta shows WHO is in control (buyers vs sellers)
3. Value Area shows FAIR VALUE (equilibrium zone)
4. Volume Nodes show STRUCTURE (support/resistance)
5. Imbalances show EXHAUSTION (potential reversals)
6. Sessions show PARTICIPATION (institutional activity)
The indicator is a MAP, not a SIGNAL:
- It shows you the battlefield terrain
- You still need to decide when/how to engage
- Combine with price action for best results
- Risk management is always paramount
---
⚖️ DISCLAIMER
This indicator is for educational and informational purposes only.
- Not financial advice
- Past performance does not guarantee future results
- Trading involves substantial risk of loss
- Only trade with capital you can afford to lose
- Always do your own research and due diligence
- Test strategies thoroughly before risking real money
- Consider consulting a licensed financial advisor
The creator is not responsible for any trading losses incurred while using this indicator.
---
Happy Trading! 📈🚀

VCP Base Detector
📊 VCP BASE DETECTOR - AUTO-DETECT CONSOLIDATION ZONES
🎯 WHAT IS THIS INDICATOR?
This indicator automatically detects and marks ALL consolidation bases (VCP bases) on your chart. It:
✅ Auto-detects when price enters consolidation
✅ Measures base tightness (volatility contraction)
✅ Tracks base duration (how long consolidating)
✅ Rates base quality (1-5 stars)
✅ Shows volume drying confirmation
✅ Detects base breakouts
✅ Shows progression of multiple bases (VCP pattern)
Use this WITH the "Mark Minervini SEPA Balanced" indicator for complete trading setups!
✅ Mark Minervini SEPA Balanced = Trend + RS + Stage
✅ VCP Base Detector = Base Quality + Progression
Combined = Complete professional trading system!
🎨 WHAT YOU SEE ON YOUR CHART
1️⃣ COLORED BOXES (Base Zones):
🟦 Aqua Box = ⭐⭐⭐⭐⭐ Excellent base (tightest)
🔵 Blue Box = ⭐⭐⭐⭐ Very good base
🟣 Purple Box = ⭐⭐⭐ Good base
🟠 Orange Box = ⭐⭐ Fair base
⬜ Gray Box = ⭐ Weak base
2️⃣ BASE LABELS (With Metrics):
Shows above each base:
• Duration: 20 days
• Tightness: 0.9%
• Quality: ⭐⭐⭐⭐⭐
3️⃣ BREAKOUT LABELS (When price exits base):
Green "BREAKOUT ✓" label shows:
• Price: ₹800
• Volume: 1.6x
4️⃣ DASHBOARD (Top-Left Panel):
Real-time base metrics showing:
• In Base: YES/NO
• Tightness: 0.8%
• Duration: 22 days
• Range: 3.5%
• Volume: Drying/Normal
• Quality: ⭐⭐⭐⭐
📊 UNDERSTANDING BASE QUALITY (⭐ Rating System)
⭐⭐⭐⭐⭐ (EXCELLENT)
├─ Tightness: < 0.8% ATR
├─ Duration: 15-40 days
├─ Volume: Significantly drying
├─ Price Range: < 5%
└─ Result: Most explosive breakouts (best quality)
⭐⭐⭐⭐ (VERY GOOD)
├─ Tightness: 0.8-1.0% ATR
├─ Duration: 15-35 days
├─ Volume: Very dry
├─ Price Range: < 7%
└─ Result: High probability breakouts
⭐⭐⭐ (GOOD)
├─ Tightness: 1.0-1.3% ATR
├─ Duration: 15-30 days
├─ Volume: Drying
├─ Price Range: < 8%
└─ Result: Decent breakout probability
⭐⭐ (FAIR)
├─ Tightness: 1.3-1.5% ATR
├─ Duration: 15-25 days
├─ Volume: Moderate drying
├─ Price Range: < 10%
└─ Result: Lower quality, riskier
⭐ (WEAK)
├─ Tightness: > 1.5% ATR
├─ Duration: Varies
├─ Volume: Not drying enough
├─ Price Range: > 10%
└─ Result: Low quality, skip these
📈 HOW TO USE - STEP BY STEP
STEP 1: ADD INDICATOR TO CHART
────────────────────────────────
1. Open any stock chart (use 1D timeframe for swing trading)
2. Click "Indicators"
3. Search "VCP Base Detector"
4. Click to add to chart
5. Wait a moment for boxes to appear
STEP 2: SCAN FOR BASES
───────────────────────
Look for:
✓ Colored boxes appearing on chart (bases forming)
✓ Dashboard showing "In Base: YES"
✓ Tightness below 1.5%
✓ Volume Dry: YES
STEP 3: MONITOR BASE QUALITY
──────────────────────────────
Dashboard shows stars:
⭐⭐⭐⭐⭐ = Wait for breakout (best setup)
⭐⭐⭐⭐ = Good quality, watch for breakout
⭐⭐⭐ = Decent, but not ideal
⭐⭐ or ⭐ = Skip (lower probability)
STEP 4: WAIT FOR BREAKOUT
──────────────────────────
When price breaks above the box:
✓ Green "BREAKOUT ✓" label appears
✓ Shows breakout price and volume
✓ If volume shows 1.3x+, breakout is confirmed
✓ This is your entry signal!
STEP 5: CHECK MINERVINI CRITERIA (Use Both Indicators)
───────────────────────────────────────────────────────
Before entering:
✓ VCP Base Detector shows ⭐⭐⭐⭐+ quality base
✓ Mark Minervini indicator shows BUY SIGNAL
✓ Dashboard shows 10+ criteria GREEN
✓ Stage shows S2
Result: HIGH-PROBABILITY SETUP! 🎯
📋 DASHBOARD INDICATORS - WHAT EACH MEANS
BASE METRICS SECTION:
─────────────────────
In Base = ✓ YES or ✗ NO
Show if price is currently consolidating
Tightness = 0-3% (lower = tighter = better)
< 0.8% = ⭐⭐⭐⭐⭐ (excellent)
0.8-1.0% = ⭐⭐⭐⭐ (very good)
1.0-1.3% = ⭐⭐⭐ (good)
1.3-1.5% = ⭐⭐ (fair)
> 1.5% = ⭐ (weak)
Duration = Number of days in consolidation
15 days = ⭐ (too short, weak)
20 days = ⭐⭐⭐ (ideal)
30 days = ⭐⭐⭐⭐ (very long, strong)
> 40 days = ⚠️ (too long, may break down)
Range = % movement within the base
< 5% = ⭐⭐⭐⭐⭐ (excellent, very tight)
5-8% = ⭐⭐⭐ (good)
> 10% = ⭐ (loose, not ideal)
Vol Dry = Volume status during consolidation
✓ YES = Volume contracting (good)
✗ NO = Normal/high volume (weak setup)
QUALITY SECTION:
────────────────
Stars = Overall base quality rating
⭐⭐⭐⭐⭐ = Best quality bases (most explosive)
⭐⭐⭐⭐ = Excellent quality
⭐⭐⭐ = Good quality
⭐⭐ = Fair quality
⭐ = Weak quality (skip)
52W INFO SECTION:
─────────────────
From 52W Hi = How far below 52-week high is price?
< 25% = In sweet zone ✓
> 25% = Too far from highs ✗
From 52W Lo = How far above 52-week low is price?
> 30% = In sweet zone ✓
< 30% = Too close to lows ✗
⚙️ CUSTOMIZATION GUIDE
Click ⚙️ gear icon next to indicator to adjust:
MINIMUM BASE DAYS (Default: 15)
──────────────────────────────
Current: 15 = Include shorter bases
Change to 20 = Longer bases only (higher quality)
Change to 10 = Include very short bases (more frequent)
Why: Longer bases = better breakouts, but fewer opportunities
ATR% TIGHTNESS THRESHOLD (Default: 1.5)
────────────────────────────────────────
Current: 1.5 = BALANCED for Indian stocks
Change to 1.0 = ONLY very tight bases (⭐⭐⭐⭐⭐)
Change to 2.0 = Looser bases included (more frequent)
Why: Lower = tighter bases = better quality, fewer signals
VOLUME DRYING THRESHOLD (Default: 0.7)
──────────────────────────────────────
Current: 0.7 = Volume at 70% of average (good drying)
Change to 0.6 = Stricter (more volume drying required)
Change to 0.8 = Looser (less volume drying required)
Why: Volume drying = consolidation confirmation
52W PERIOD (Default: 252)
─────────────────────────
Current: 252 = Full year lookback
Don't change unless you know what you're doing
📈 REAL TRADING EXAMPLE
SCENARIO: Trading MARUTI over 6 weeks
WEEK 1: Nothing happening
─────────────────────────
- No boxes on chart
- Dashboard: "In Base: NO"
- Action: SKIP (not consolidating)
WEEK 2: Base Starting to Form
─────────────────────────────
- Purple box appears (⭐⭐⭐ quality)
- Dashboard: "In Base: YES"
- Tightness: 1.2%
- Duration: 3 days (too new)
- Action: MONITOR (let it develop)
WEEK 3-4: Base Tightening
──────────────────────────
- Box color changes from Purple → Blue (⭐⭐⭐⭐ quality)
- Dashboard: Duration: 12 days
- Tightness: 0.9%
- Vol Dry: YES
- Action: GET READY (high-quality base forming)
WEEK 4-5: Perfect Base Formed
──────────────────────────────
- Box changes to Aqua (⭐⭐⭐⭐⭐ EXCELLENT!)
- Dashboard: Duration: 22 days ✓
- Tightness: 0.8% ✓
- Vol Dry: YES ✓
- Range: 4.2% ✓
- Action: WATCH FOR BREAKOUT
WEEK 5: BREAKOUT HAPPENS!
──────────────────────────
- Price closes above box
- Green "BREAKOUT ✓" label appears
- Shows: Price ₹850, Volume 1.6x
- Mark Minervini indicator: BUY SIGNAL ✓
- Dashboard all GREEN ✓
- Action: ENTER TRADE
Entry: ₹850
Stop: Box low (₹820)
Target: ₹980 (20% move)
RESULT: +15.3% profit in 2 weeks! ✅
💡 PRO TIPS FOR BEST RESULTS
1. COMBINE WITH MINERVINI INDICATOR
Use BOTH indicators together:
✓ VCP Detector = Base quality
✓ Minervini = Trend + RS + Volume
Result = Best high-probability setups
2. PREFER ⭐⭐⭐⭐+ QUALITY BASES
Don't trade ⭐⭐ or ⭐ quality bases
Only trade ⭐⭐⭐+ (ideally ⭐⭐⭐⭐+)
Higher quality = Higher win rate
3. WAIT FOR VOLUME CONFIRMATION
Base must show "Vol Dry: YES"
Breakout must have 1.3x+ volume
Low volume breakouts fail often
4. USE 1D TIMEFRAME ONLY
This indicator optimized for daily charts
Intraday = Too many false signals
Weekly = Misses good setups
5. MONITOR MULTIPLE BASES (VCP PATTERN)
Multiple bases getting tighter = VCP pattern
Each base should be better quality than last
Tightest base = Biggest breakout
6. COMBINE WITH 52W CONTEXT
Dashboard shows "From 52W Hi" and "From 52W Lo"
Price should be in sweet zone:
< 25% from 52W high (uptrend territory)
> 30% above 52W low (not oversold)
7. BACKTEST FIRST
Use TradingView Replay
Go back 6-12 months
See how many bases appeared
See which were profitable
❌ BASES TO SKIP (Lower Probability)
Skip if:
❌ Quality rating < ⭐⭐⭐ (only 1-2 stars)
❌ Tightness > 1.5% (too loose)
❌ Duration < 10 days (too short, weak)
❌ Duration > 50 days (too long, may break down)
❌ Vol Dry: NO (volume not contracting)
❌ Range > 10% (not tight consolidation)
❌ Price < 30% from 52W low (too weak)
❌ Price > 30% from 52W high (too far up, late entry)
⚠️ IMPORTANT DISCLAIMERS
✓ This indicator is for educational purposes only
✓ Past performance does not guarantee future results
✓ Always use proper risk management (position sizing, stop loss)
✓ Never risk more than 2% of your account on one trade
✓ Base detection is technical analysis, not investment advice
✓ Losses can occur - trade at your own risk
✓ Combine with other indicators for best results
🎓 LEARNING RESOURCES
To understand VCP bases better:
→ Study "Trade Like a Stock Market Wizard" by Mark Minervini
→ Watch: "VCP Pattern" videos on YouTube
→ Practice: Backtest on 1-2 years of historical data
→ Learn: How consolidation precedes breakouts
🚀 YOU'RE READY!
Happy trading! 📈🎯
