Multi-Indicator Signals with Selectable Options by DiGetMulti-Indicator Signals with Selectable Options
Script Overview
This Pine Script is a multi-indicator trading strategy designed to generate buy/sell signals based on combinations of popular technical indicators: RSI (Relative Strength Index) , CCI (Commodity Channel Index) , and Stochastic Oscillator . The script allows you to select which combination of signals to display, making it highly customizable and adaptable to different trading styles.
The primary goal of this script is to provide clear and actionable entry/exit points by visualizing buy/sell signals with arrows , labels , and vertical lines directly on the chart. It also includes input validation, dynamic signal plotting, and clutter-free line management to ensure a clean and professional user experience.
Key Features
1. Customizable Signal Types
You can choose from five signal types:
RSI & CCI : Combines RSI and CCI signals for confirmation.
RSI & Stochastic : Combines RSI and Stochastic signals.
CCI & Stochastic : Combines CCI and Stochastic signals.
RSI & CCI & Stochastic : Requires all three indicators to align for a signal.
All Signals : Displays individual signals from each indicator separately.
This flexibility allows you to test and use the combination that works best for your trading strategy.
2. Clear Buy/Sell Indicators
Arrows : Buy signals are marked with upward arrows (green/lime/yellow) below the candles, while sell signals are marked with downward arrows (red/fuchsia/gray) above the candles.
Labels : Each signal is accompanied by a label ("BUY" or "SELL") near the arrow for clarity.
Vertical Lines : A vertical line is drawn at the exact bar where the signal occurs, extending from the low to the high of the candle. This ensures you can pinpoint the exact entry point without ambiguity.
3. Dynamic Overbought/Oversold Levels
You can customize the overbought and oversold levels for each indicator:
RSI: Default values are 70 (overbought) and 30 (oversold).
CCI: Default values are +100 (overbought) and -100 (oversold).
Stochastic: Default values are 80 (overbought) and 20 (oversold).
These levels can be adjusted to suit your trading preferences or market conditions.
4. Input Validation
The script includes built-in validation to ensure that oversold levels are always lower than overbought levels for each indicator. If the inputs are invalid, an error message will appear, preventing incorrect configurations.
5. Clean Chart Design
To avoid clutter, the script dynamically manages vertical lines:
Only the most recent 50 buy/sell lines are displayed. Older lines are automatically deleted to keep the chart clean.
Labels and arrows are placed strategically to avoid overlapping with candles.
6. ATR-Based Offset
The vertical lines and labels are offset using the Average True Range (ATR) to ensure they don’t overlap with the price action. This makes the signals easier to see, especially during volatile market conditions.
7. Scalable and Professional
The script uses arrays to manage multiple vertical lines, ensuring scalability and performance even when many signals are generated.
It adheres to Pine Script v6 standards, ensuring compatibility and reliability.
How It Works
Indicator Calculations :
The script calculates the values of RSI, CCI, and Stochastic Oscillator based on user-defined lengths and smoothing parameters.
It then checks for crossover/crossunder conditions relative to the overbought/oversold levels to generate individual signals.
Combined Signals :
Depending on the selected signal type, the script combines the individual signals logically:
For example, a "RSI & CCI" buy signal requires both RSI and CCI to cross into their respective oversold zones simultaneously.
Signal Plotting :
When a signal is generated, the script:
Plots an arrow (upward for buy, downward for sell) at the corresponding bar.
Adds a label ("BUY" or "SELL") near the arrow for clarity.
Draws a vertical line extending from the low to the high of the candle to mark the exact entry point.
Line Management :
To prevent clutter, the script stores up to 50 vertical lines in arrays (buy_lines and sell_lines). Older lines are automatically deleted when the limit is exceeded.
Why Use This Script?
Versatility : Whether you're a scalper, swing trader, or long-term investor, this script can be tailored to your needs by selecting the appropriate signal type and adjusting the indicator parameters.
Clarity : The combination of arrows, labels, and vertical lines ensures that signals are easy to spot and interpret, even in fast-moving markets.
Customization : With adjustable overbought/oversold levels and multiple signal options, you can fine-tune the script to match your trading strategy.
Professional Design : The script avoids clutter by limiting the number of lines displayed and using ATR-based offsets for better visibility.
How to Use This Script
Add the Script to Your Chart :
Copy and paste the script into the Pine Editor in TradingView.
Save and add it to your chart.
Select Signal Type :
Use the "Signal Type" dropdown menu to choose the combination of indicators you want to use.
Adjust Parameters :
Customize the lengths of RSI, CCI, and Stochastic, as well as their overbought/oversold levels, to match your trading preferences.
Interpret Signals :
Look for green arrows and "BUY" labels for buy signals, and red arrows and "SELL" labels for sell signals.
Vertical lines will help you identify the exact bar where the signal occurred.
Tips for Traders
Backtest Thoroughly : Before using this script in live trading, backtest it on historical data to ensure it aligns with your strategy.
Combine with Other Tools : While this script provides reliable signals, consider combining it with other tools like support/resistance levels or volume analysis for additional confirmation.
Avoid Overloading the Chart : If you notice too many signals, try tightening the overbought/oversold levels or switching to a combined signal type (e.g., "RSI & CCI & Stochastic") for fewer but higher-confidence signals.
VENDI

Zerg range filter credit to Kivanc turkish pinecoder for base indicator i reworked with chatgpt and some common sense
this indicator similar to the ADX but i think its better visually to keep you out of market conditions that are unfavorable.
i made original indicator to work in a 0-100 enviroment (before it was a zero middle line oscillator) and added background coloring that has a lower and higher threshold setting. i also added a smoothing moving average. this will trigger threshold levels (not the core oscillator)
above higher level would indicate trending market conditions and its purple. these are the areas where you might want to buy low period moving average bounces like 10 or 21 ema
lower band will paint indicator background blue and its cold, meaning range bound trade ideas are likely play out better. selling resistance and buying horizontal supports for example.
you are encourage to play with lookback period and change thresholds until you find something that works for your trading.
on the picture above it illustrates how i intended its usage.
it also shows divergences which was not intended but also a function.
you can also observe as the oscillator likes to coil up into a tight range (horizontal or a wedge formation) and when these break their trendlines explosive moves are incoming usually.
if you have a trading system and can generate a lot of signals but want to filter out some loser trades this could be the indicator you were looking for.
i hope this will be inline with community guidelines. my other publishing got removed unfortunately

Phase Cross Strategy with Zone### Introduction to the Strategy
Welcome to the **Phase Cross Strategy with Zone and EMA Analysis**. This strategy is designed to help traders identify potential buy and sell opportunities based on the crossover of smoothed oscillators (referred to as "phases") and exponential moving averages (EMAs). By combining these two methods, the strategy offers a versatile tool for both trend-following and short-term trading setups.
### Key Features
1. **Phase Cross Signals**:
- The strategy uses two smoothed oscillators:
- **Leading Phase**: A simple moving average (SMA) with an upward offset.
- **Lagging Phase**: An exponential moving average (EMA) with a downward offset.
- Buy and sell signals are generated when these phases cross over or under each other, visually represented on the chart with green (buy) and red (sell) labels.
2. **Phase Zone Visualization**:
- The area between the two phases is filled with a green or red zone, indicating bullish or bearish conditions:
- Green zone: Leading phase is above the lagging phase (potential uptrend).
- Red zone: Leading phase is below the lagging phase (potential downtrend).
3. **EMA Analysis**:
- Includes five commonly used EMAs (13, 26, 50, 100, and 200) for additional trend analysis.
- Crossovers of the EMA 13 and EMA 26 act as secondary buy/sell signals to confirm or enhance the phase-based signals.
4. **Customizable Parameters**:
- You can adjust the smoothing length, source (price data), and offset to fine-tune the strategy for your preferred trading style.
### What to Pay Attention To
1. **Phases and Zones**:
- Use the green/red phase zone as an overall trend guide.
- Avoid taking trades when the phases are too close or choppy, as it may indicate a ranging market.
2. **EMA Trends**:
- Align your trades with the longer-term trend shown by the EMAs. For example:
- In an uptrend (price above EMA 50 or EMA 200), prioritize buy signals.
- In a downtrend (price below EMA 50 or EMA 200), prioritize sell signals.
3. **Signal Confirmation**:
- Consider combining phase cross signals with EMA crossovers for higher-confidence trades.
- Look for confluence between the phase signals and EMA trends.
4. **Risk Management**:
- Always set stop-loss and take-profit levels to manage risk.
- Use the phase and EMA zones to estimate potential support/resistance areas for exits.
5. **Whipsaws and False Signals**:
- Be cautious in low-volatility or sideways markets, as the strategy may generate false signals.
- Use additional indicators or filters to avoid entering trades during unclear market conditions.
### How to Use
1. Add the strategy to your chart in TradingView.
2. Adjust the input settings (e.g., smoothing length, offsets) to suit your trading preferences.
3. Enable the strategy tester to evaluate its performance on historical data.
4. Combine the signals with your own analysis and risk management plan for best results.
This strategy is a versatile tool, but like any trading method, it requires proper understanding and discretion. Always backtest thoroughly and trade with discipline. Let me know if you need further assistance or adjustments to the strategy!

Optimus trader Optimus Trader
Indicator Description:
The Optimus Trader indicator is designed for technical traders looking for entry and exit points in financial markets. It combines signals based on volume, moving averages, VWAP (Volume Weighted Average Price), as well as the recognition of candlestick patterns such as Pin Bar and Inside Bars. This indicator helps identify opportune moments to buy or sell based on trends, volumes, and recent liquidity zones.
Parameters and Features:
1. Simple Moving Average (MA) and VWAP:
- Optimus Trader uses a 50-period simple moving average to determine the underlying trend. It also includes VWAP for precise price analysis based on traded volumes.
- These two indicators help identify whether the market is in an uptrend or downtrend, enhancing the reliability of buy and sell signals.
2. Volume :
- To avoid false signals, a volume threshold is set using a 20-period moving average, adjusted to 1.2 times the average volume. This filters signals by considering only high-volume periods, indicating heightened market interest.
3. Candlestick Pattern Recognition:
- Pin Bar: This sought-after candlestick pattern is detected for both bullish and bearish setups. A bullish or bearish *Pin Bar* often signals a possible reversal or continuation.
- *Inside Bar*: This price compression pattern is also detected, indicating a zone of indecision before a potential movement.
4. Trend:
- An uptrend is confirmed when the price is above the MA and VWAP, while a downtrend is identified when the price is below both indicators.
5. Liquidity Zones:
- Optimus Trader includes an approximate liquidity zone detection feature. By identifying recent support and resistance levels, the indicator detects if the price is near these zones. This feature strengthens the relevance of buy or sell signals.
6. Buy and Sell Signals:
- Buy: A buy signal is generated when the indicator detects a bullish *Pin Bar* or *Inside Bar* in an uptrend with high volume, and the price is close to a liquidity zone.
- Sell: A sell signal is generated when a bearish *Pin Bar* or *Inside Bar* is detected in a downtrend with high volume, and the price is near a liquidity zone.
Signal Display:
The signals are visible directly on the chart:
- A "BUY" label in green is displayed below the bar for buy signals.
- A "SELL" label in red is displayed above the bar for sell signals.
Summary:
This indicator is intended for traders seeking precise entry and exit points by integrating trend analysis, volume, and candlestick patterns. With liquidity zones, *Optimus Trader* helps minimize false signals, providing clear and accurate alerts.
---
This description can be directly added to TradingView to help users quickly understand the features and logic of this indicator.

Future Trend Channel [ChartPrime]The Future Trend Channel indicator is a dynamic tool for identifying trends and projecting future prices based on channel formations. The indicator uses SMA (Simple Moving Average) and volatility calculations to plot channels that visually represent trends. It also detects moments of lower momentum, indicated by neutral color changes in the channels, and projects future price levels for up to 50 bars ahead.
⯁ KEY FEATURES AND HOW TO USE
⯌ Dynamic Trend Channels :
The indicator draws channels when a trend is identified. It uses a combination of SMA and volatility to determine the direction and strength of the trend. Each channel is visualized with a specific color, where green indicates an uptrend and orange represents a downtrend.
Example of channels during uptrend and downtrend:
⯌ Momentum-Based Color Shifts :
The indicator adapts its channel colors based on momentum changes. When the starting point (Y1) of a channel is higher than its ending point (Y2) during an uptrend, the channel turns neutral, indicating lower momentum and a possible ranging market. The same applies in a downtrend, where the channel turns neutral if Y1 is lower than Y2.
Example of neutral momentum channels:
⯌ Future Price Projection :
At the end of each channel, the indicator generates a projected future price based on the midpoint of the channel. By default, this projection is made 50 bars into the future, but users can adjust the number of bars to their preference.
Example of future price projection:
⯌ Diamond Signals for Valid Trends :
Lime-colored diamonds appear when an uptrend channel is confirmed, while orange diamonds indicate valid downtrend channels. These signals confirm the presence of a strong trend and help identify valid entry and exit points. Neutral channels, which indicate lower momentum, do not show diamond signals.
Example of trend confirmation signals:
⯌ Customizable Settings :
Users can adjust the channel length (how far back the trend is analyzed) and the width (which determines the channel boundaries based on volatility). The future price projection can also be customized to forecast further or fewer bars into the future.
⯁ USER INPUTS
Trend Length : Sets the number of bars used to calculate the trend channels.
Channel Width : Adjusts the width of the channels, based on volatility (ATR multiplier).
Up and Down Colors : Allows customization of the colors used for uptrend and downtrend channels.
Future Bars : Sets the number of bars used for future price projection.
⯁ CONCLUSION
The Future Trend Channel indicator is a versatile tool for identifying and trading trends. With its ability to detect momentum shifts and project future prices, it provides traders with key insights for making more informed decisions. The use of diamond signals for trend validation adds an extra layer of confirmation, helping traders act with greater confidence during volatile or trending markets.

Trend Levels [ChartPrime]The Trend Levels indicator is designed to identify key trend levels (High, Mid, and Low) during market trends, based on real-time calculations of highest, lowest, and mid-level values over a customizable length. Additionally, the indicator calculates trend strength by measuring the ratio of candles closing above or below the midline, providing a clear view of the ongoing trend dynamics and strength.
⯁ KEY FEATURES AND HOW TO USE
⯌ Trend Shift Signals :
Trend shifts, based on highest and lowest values during input length. When high is == to highest it will change trend to up when low == lowest value it will be shift to down trend.
// Calculate highest and lowest over the specified length
h = ta.highest(length)
l = ta.lowest(length)
// Determine trend direction: if the current high is the highest value, set trend to true
if h == high
trend := true
// If the current low is the lowest value, set trend to false
if l == low
trend := false
Whenever the trend changes direction (from uptrend to downtrend or vice versa), the indicator provides visual cues in the form of arrows. This gives traders clear signals to identify potential trend reversals, enabling them to adjust their strategies accordingly.
⯌ Trend Level Calculation :
As soon as a trend is detected (uptrend or downtrend), the indicator starts calculating the highest, lowest, and mid-level values over the defined period. These levels are plotted on the chart as color-coded lines for easy visualization, allowing traders to quickly spot the key levels within a trend.
⯌ Midline Retests :
Throughout the trend, the mid-level line is often retested, acting as a potential zone for pullbacks or rejections. Traders can use these retests as opportunities for entering positions or confirming trend continuation. The chart shows how price frequently interacts with the midline, helping to identify important reaction levels.
⯌ Trend Strength Calculation :
The indicator measures the trend strength by calculating the delta between the number of candles closing above and below the midline. This percentage-based delta is displayed in real-time, providing a clear indication of whether the trend is gaining or losing momentum.
⯁ USER INPUTS
Length : Specifies the lookback period for calculating the highest and lowest values, which determines the key trend levels.
Candle Counting : Measures the number of candles closing above and below the midline to calculate the trend strength delta.
⯁ CONCLUSION
The Trend Levels indicator provides traders with a powerful tool for visualizing trend dynamics, key levels of support and resistance, and real-time trend strength. By identifying midline retests, tracking candle counts, and providing trend shift signals, this indicator can help traders make well-informed decisions during market trends.

Regression Indicator [BigBeluga]Regression Indicator
Indicator Overview:
The Regression Indicator is designed to help traders identify trends and potential reversals in price movements. By calculating a regression line and a normalized regression indicator, it provides clear visual signals for market direction, aiding in making informed trading decisions. The indicator dynamically updates with the latest market data, ensuring timely and relevant signals.
Key Features:
⦾ Calculations
Regression Indicator: Calculates the linear regression coefficients (slope and intercept) and derives the normalized distance close from the regression line.
// @function regression_indicator is a Normalized Ratio of Regression Lines with close
regression_indicator(src, length) =>
sum_x = 0.0
sum_y = 0.0
sum_xy = 0.0
sum_x_sq = 0.0
distance = 0.0
// Calculate Sum
for i = 0 to length - 1 by 1
sum_x += i + 1
sum_y += src
sum_xy += (i + 1) * src
sum_x_sq += math.pow(i + 1, 2)
// Calculate linear regression coefficients
slope = (length * sum_xy - sum_x * sum_y)
/ (length * sum_x_sq - math.pow(sum_x, 2))
intercept = (sum_y - slope * sum_x) / length
// Calculate Regression Indicator
y1 = intercept + slope
distance := (close - y1)
distance_n = ta.sma((distance - ta.sma(distance, length1))
/ ta.stdev(distance, length1), 10)
⦿ Reversion Signals:
Marks potential trend reversal points.
⦿ Trend Identification:
Highlights when the regression indicator crosses above or below the zero line, signaling potential trend changes.
⦿ Color-Coded Candles:
Changes candle colors based on the regression indicator's value.
⦿ Arrow Markers:
Indicate trend directions on the chart.
⦿ User Inputs
Regression Length: Defines the period for calculating the regression line.
Normalization Length: Period used to normalize the regression indicator.
Signal Line: Length for averaging the regression indicator to generate signals.
Main Color: Color used for plotting the regression line and signals.
The Regression Indicator is a powerful tool for analyzing market trends and identifying potential reversal points. With customizable inputs and clear visual aids, it enhances the trader's ability to make data-driven decisions. The dynamic nature of the indicator ensures it remains relevant with up-to-date market information, making it a valuable addition to any trading strategy."

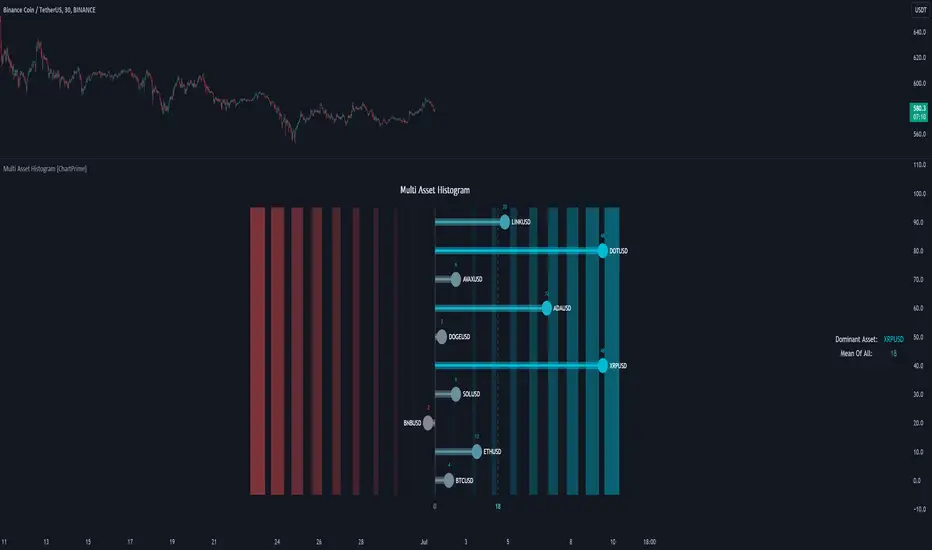
Multi Asset Histogram [ChartPrime]Multi Asset Histogram Indicator
Overview:
The "Multi Asset Histogram" indicator provides a comprehensive visualization of the performance of multiple assets relative to each other. By calculating a score for each asset and displaying it in a histogram format, this indicator helps traders quickly identify the trends, dominant asset and the average performance of the assets in the selected group.
Key Features:
◆ Multi-Asset Score Calculation:
The indicator calculates a trend score for each selected asset based on the price source (e.g., hl2).
The trend score is determined by comparing the current price to the prices over the past bars back defined by user, adding or subtracting points based on whether the current price is higher or lower than previous prices.
// Score Function
trscore(src) =>
total = 0.0
for i = 1 to 50
total += (src >= nz(src ) ? 1 : -1)
total
◆ Flexible Symbol Input:
Traders can input up to 10 different symbols (e.g., BTCUSD, ETHUSD, etc.) to be included in the histogram analysis.
◆ Dynamic Visualization:
A histogram is plotted for each asset, with bars colored based on the score, providing a clear visual representation of the relative performance.
Color gradients from red to aqua indicate the performance, with red representing negative scores and aqua representing positive scores.
◆ Adaptive Histogram Lines:
The width and placement of histogram lines adapt based on the calculated scores, ensuring clear visualization regardless of the values.
Dashed lines represent the mean score of all assets, helping traders identify the overall market trend.
◆Detailed Labels and Values:
Labels are placed on the histogram to display the exact score for each asset.
Mean value and zero line labels provide additional context for the overall performance.
◆ Visual Scaling Lines:
Zero line and mean line are clearly marked, helping traders understand the distribution and scale of scores.
Scales on the left and right of the histogram indicate the performance range.
◆ Informative Table:
A table is displayed on the chart, showing the dominant asset (the one with the highest score) and the mean score of all assets.
The table updates dynamically to reflect real-time changes in asset performance.
◆ Settings:
Length: The value of number bars back is greater or less than the current value of the source
Source: The price source to be used for score calculation (e.g., hl2).
Symbols: Up to 10 different asset symbols can be input for analysis.
Usage Notes:
This indicator is useful for traders who monitor multiple assets simultaneously and need a quick visual reference to identify the strongest and weakest performers.
The color coding and dynamic labels make it easy to interpret the relative performance and make informed trading decisions.
This indicator is designed to enhance multi-asset analysis by providing a clear, visual representation of each asset's performance relative to the others, making it easier to identify trends and dominant assets in the market.
Volume Positive & Negative Levels [ChartPrime]Volume Positive & Negative Levels
Overview:
The Volume Positive & Negative Levels indicator by ChartPrime is designed to provide traders with a clear visualization of volume activity across different price levels. By plotting volume levels as histograms, this tool helps identify significant areas of buying (positive volume) and selling (negative volume) pressure, enhancing the ability to spot potential support and resistance zones.
Key Features:
⯁ Lookback Period:
- The `lookbackPeriod` parameter, set to 500 bars, determines the range over which the volume analysis is conducted, ensuring a comprehensive view of the market’s volume activity. The maximum lookback period is 500 bars or the bars currently visible on the chart, whichever is smaller.
⯁ Dynamic Volume Calculation:
- Volume is calculated dynamically based on the price action, with positive volume indicating buying pressure (close > open) and negative volume indicating selling pressure (close < open).
⯁ Color Coding for Clarity:
- Positive Volume: Represented with a distinct color (`#ad9a2c`), making it easy to identify areas of buying interest.
- Negative Volume: Highlighted with another color (`#ad2cad`), simplifying the detection of selling pressure.
Volume Threshold and Bins:
- The indicator allows users to set a volume threshold (`volume_level`) to highlight significant volume levels, with the default set at 70.
- The number of bins (`numBins`) defines the granularity of the volume profile, with a higher number providing more detail.
⯁ Volume Profile Visualization:
- The volume profile is plotted as a histogram, with the height of each bar proportional to the volume at that price level. This visualization helps in quickly assessing the strength of volume at various price points.
⯁ Interactive Labels and Threshold Indicators:
- Labels: The indicator uses labels to mark significant volume levels, providing quick reference points for traders.
- Threshold Lines: Lines are drawn at specified volume thresholds, with colors and widths dynamically adjusted based on the volume levels.
⯁ User Inputs:
- Volume Threshold (`volume_level`): Sets the minimum volume required to highlight significant levels.
- Number of Bins (`numBins`): Determines the resolution of the volume profile.
- Line Width (`line_withd`): Specifies the width of the lines used in the visualization.
The Volume Positive & Negative Levels indicator is a powerful tool for traders looking to gain deeper insights into market dynamics. By providing a clear visual representation of volume activity across different price levels, it helps traders identify key support and resistance zones, spot trends, and make more informed trading decisions. Whether you are a day trader or a swing trader, this indicator enhances your ability to analyze volume data effectively, improving your overall trading strategy.

Higher Timeframe High & Low [ChartPrime]The Higher Timeframe High & Low Indicator plots key levels (high, low, and average price) from a higher timeframe onto the current chart, aiding traders in identifying significant support and resistance zones.
The indicator also detects and labels breakout points and can display trend directions based on these higher timeframe levels breakout points.
Key Features:
◆ Higher Timeframe Levels:
Plots the high, low, and average price from a selected higher timeframe onto the current chart.
Extends these levels into the future for better visualization.
◆ Breakout Detection:
Identifies and labels breakouts above the higher timeframe high or below the higher timeframe low.
Breakout points are clearly marked with labels indicating "High Break" or "Low Break" with timeframe mark.
If the following break out type is the same that previous, it does not marked by labels, but still marked by bar color.
◆ Trend Visualization:
Optionally displays trend direction by changing bar colors and line styles based on breakout conditions.
Trend indication helps in identifying bullish or bearish market conditions.
◆ Support and Resistance Indication:
Marks support and resistance points with '◆' symbols when the current timeframe's high or low interacts with the higher timeframe's levels.
◆ Period separation:
Background color changes to indicate period separation if enabled.
◆ Inputs:
Extension to the right of High and Low: Sets the number of bars to extend the high and low lines into the future.
Timeframe: Selects the higher timeframe (e.g., Daily) to use for plotting high and low levels.
Period Separator: Toggles the visual separator for periods.
Show Trend?: Toggles the trend visualization, changing bar colors and plot styles based on breakouts.
Show Breakout Labels?: Toggles the Breakout Labels visualization.
Indicator Logic:
Historical vs. Real-Time Bars: Adjusts values based on whether the bar is historical or real-time to ensure accurate plotting.
High and Low Prices: Retrieves the high and low prices from the selected higher timeframe.
Breakout Conditions: Determines if the current price has crossed above the higher timeframe high (high break) or below the higher timeframe low (low break).
Color and Trend Logic: Adjusts colors and checks for breakouts to avoid multiple labels and indicate trend direction.
Usage Notes:
This indicator is ideal for traders looking to integrate multi-timeframe analysis into their strategy.
The higher timeframe levels act as significant support and resistance zones, helping traders identify potential reversal or continuation points.
The breakout labels and trend visualization provide additional context for trading decisions, indicating when the price has breached key levels and is likely to continue in that direction.
This indicator enhances chart analysis by providing clear, visual cues from higher timeframe data, helping traders make more informed decisions based on a broader market perspective.

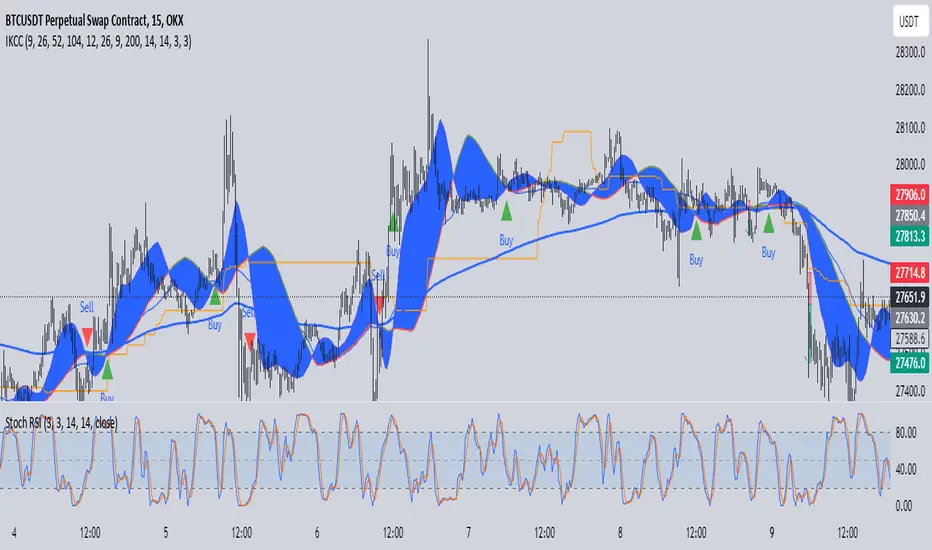
IchimokuBuy Sell With Stoch RSIIchimoku Kumo Cloud Crossover Indicator
The "Ichimoku Kumo Cloud Crossover" indicator is a custom technical analysis tool designed for use in the TradingView platform. This indicator is built to assist traders in identifying potential buy and sell signals based on a combination of Ichimoku Cloud analysis, Moving Average Convergence Divergence (MACD), Exponential Moving Average (EMA), Relative Strength Index (RSI), and Stochastic RSI.
Key Components and Parameters:
Ichimoku Kumo Cloud Calculation:
The Ichimoku Kumo Cloud is calculated using the Ichimoku Cloud's Conversion Line and Base Line.
Conversion Line, Base Line, Leading Span 1, and Leading Span 2:
These are key components of the Ichimoku Cloud, and they help identify trends and potential support/resistance levels in the market.
MACD Oscillator:
The Moving Average Convergence Divergence (MACD) is used to gauge the strength and direction of the trend.
EMA 200 (Exponential Moving Average):
The EMA 200 is a long-term moving average used to identify the overall trend direction.
RSI (Relative Strength Index):
The RSI is a momentum oscillator that measures the speed and change of price movements, helping to identify overbought and oversold conditions.
Stochastic RSI (Stoch RSI):
Stoch RSI is calculated based on the RSI values and helps to identify overbought and oversold conditions in a more dynamic manner.
Signal Generation:
The indicator generates buy and sell signals based on the following criteria:
Buy Signal (Long Position):
The Conversion Line crosses above the Base Line (Ichimoku Cloud crossover).
The closing price is above the EMA 200, indicating a bullish bias.
The RSI is between 50 and 70, suggesting the potential for an uptrend.
The MACD Histogram is positive, indicating increasing bullish momentum.
The high price is at least 25% above the EMA 200.
Sell Signal (Short Position):
The Conversion Line crosses below the Base Line (Ichimoku Cloud crossover).
The closing price is below the EMA 200, indicating a bearish bias.
The RSI is between 20 and 50, suggesting the potential for a downtrend.
The MACD Histogram is negative, indicating increasing bearish momentum.
The low price is at least 25% below the EMA 200.
Stoch RSI Filter:
Additionally, a filter based on Stoch RSI slope is applied. The indicator will only open a position if the Stoch RSI is declining for short positions (sell) and rising for long positions (buy).
Visualization:
Buy signals are marked with green triangles below the bars.
Sell signals are marked with red triangles above the bars.
The Ichimoku Cloud is plotted in the background, with cloud colors changing based on whether the Conversion Line or Base Line is higher.
This indicator can be a valuable tool for traders looking to combine multiple technical analysis techniques to make informed trading decisions in the financial markets.
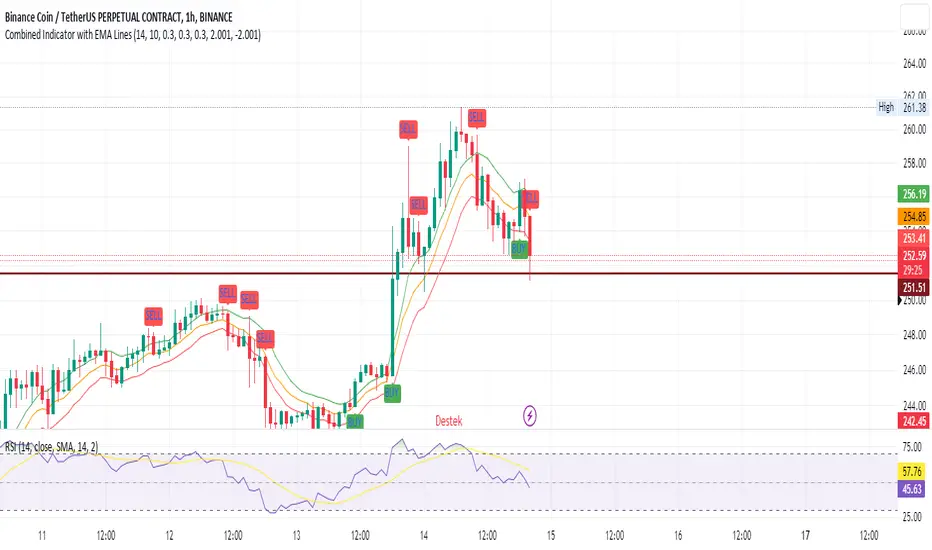
SEC-Combined Indicator with EMA LinesTitle: Combined Indicator with EMA Lines
Description:
The Combined Indicator with EMA Lines is a technical analysis tool that combines multiple indicators to provide insights into the market's strength and potential buying or selling opportunities. It incorporates the Relative Strength Index (RSI), Exponential Moving Average (EMA) lines, and the trend over the past three days to generate signals.
The indicator calculates a combined data value by assigning weights to the RSI, EMA, and past trend. The RSI measures the strength of price movements, while the EMA lines provide an indication of the average price over a specific period. The past trend considers the price behavior over the last three days. By combining these factors, the indicator offers a comprehensive view of market conditions.
Buy and sell signals are generated based on the change in the combined data. A buy signal occurs when there is an increase in the combined data above a specified threshold, indicating a potential buying opportunity. Conversely, a sell signal is triggered when there is a decrease in the combined data below a specified threshold, suggesting a potential selling opportunity.
The indicator also plots the EMA lines, which include the EMA High, EMA Average, and EMA Low. These lines provide additional visual cues about the price trend and potential support and resistance levels.
Traders can use the Combined Indicator with EMA Lines to identify potential entry and exit points in the market. It helps in capturing trends, evaluating price strength, and making informed trading decisions. The buy and sell signals, along with the EMA lines, aid in spotting potential reversals, confirming trends, and managing risk.
It's important to note that this indicator should be used in conjunction with other analysis techniques and risk management strategies. Traders should consider combining it with additional indicators, chart patterns, and fundamental analysis to enhance their trading decisions.
Remember to backtest and validate the indicator's performance using historical data before using it in real-time trading. Adjust the input parameters, such as RSI period, EMA period, and threshold values, to suit your trading style and market conditions.
Futures All List / Sell SignalAs of May 2023, there are more than 180 usdt perpetual coins on the binance futures exchange. These coins are included in the indicator in lists of 40. They are sorted instantly in the table from largest to smallest. The sorting style can be changed in the indicator settings. This indicator collects RSI and TSI values at desired values. The result has a maximum value of 600. A value of 600 signals that the price will decrease or remain stable for a certain period of time. Generally, a short can be expected from the closest point to 600. If 3 separate lists are selected by using 3 of these indicators, 120 coins can be analyzed at the same time. Available in all time zones. Examine it in a 3-minute timeframe. The line inside the indicator draws the instantaneous values of the relevant coin.

Parabolic SAR + EMA 200 + MACD SignalsParabolic SAR + EMA 200 + MACD Signals Indicator, a powerful tool designed to help traders identify optimal entry points in the market.
This indicator combines three popular technical indicators: Parabolic SAR (Stop and Reverse), EMA200 (Exponential Moving Average 200) and MACD (Moving Average Convergence Divergence) - to provide clear and concise buy and sell signals based on market trends.
The MACD component of this indicator calculates the difference between two exponentially smoothed moving averages, providing insight into the trend strength of the market. The Parabolic SAR component helps identify potential price reversals, while the EMA200 acts as a key level of support and resistance, providing additional confirmation of the overall trend direction.
Whether you're a seasoned trader or just starting out, the MACD-Parabolic SAR-EMA200 Indicator is a must-have tool for anyone looking to improve their trading strategy and maximize profits in today's dynamic markets.
Buy conditions
The price should be above the EMA 200
Parabolic SAR should show an upward trend
MACD Delta should be positive
ُSell conditions
The price should be below the EMA 200
Parabolic SAR should show an downward trend
MACD Delta should be negative

B/S Volume with Timeframe InputDaytrading For Success's volume indicator with timeframe input selection added. Example shown is 1 minute time frame with 5 minute input selected.

VWAP + 2 Moving Averages + RSI + Buy and SellIndicator: VWAP + 2 Moving Averages + RSI + Buy and Sell
Buy and Sell Arrows (Great for use alone or in conjunction with other scripts on the chart)
This indicator displays BUY (BUY) and SELL (SELL) arrows on the chart based on a combination of moving averages, VWAP and RSI. Arrows are a visual way to identify trading opportunities and can be useful for traders who want to follow a strategy based on these conditions.
The indicator uses two moving averages (20 and 50 periods) to identify upward crosses (buy) and downward crosses (sell). In addition, it takes into account VWAP (Volume Weighted Average Price) and RSI (Relative Strength Index) as additional filters to confirm buy and sell signals.
This script is great for use both independently and in conjunction with other indicators and strategies. You can combine it with other indicators and customize it to your preferences to create a more comprehensive trading strategy.
Please remember that this indicator is provided for educational purposes only and does not constitute financial advice. It is always recommended to carry out a thorough analysis before making any trading decisions.
Give this indicator a try and enjoy clear visualization of buy and sell arrows on your chart. Happy trading!

Ema ScalpThis is another simple strategy based on ema
Entry Buy - 1) when close crossover ema then buy and only open one trade till it not close
2) if previous buy trade is profitable open another trade and check again trade is profitable or not
3)if trade is not profitable reset and wait for sell condition...
Entry Sell -1) when close crossunder ema then sell and only open one trade till it not close
2) if previous sell trade is profitable open another trade and check again trade is profitable or not
3) if trade is not profitable reset and wait for buy condition.....
stop loss and take profit is percentage based ...

Buy Sell Calendar [LuxAlgo]The Buy Sell Calendar indicator displays a calendar showing the sentiment for the current day/month. Three different methods can be used to determine this sentiment.
The calendar can also highlight the percentage of bullish days/months for a month/year.
🔶 SETTINGS
Frequency: Calendar frequency, options include "Daily" and "Monthly"
Sentiment Method: Method used to determine the sentiment for the day/month, options include: "Linreg", "Accumulated Deltas", and "Max/Min"
Timezone Offset: UTC time zone offset.
Limit Date: Limit date used by the calendar, the sentiment of days/months outside this limit will not be returned.
🔹 Calendar
Show Calendar: Determines whether to display or hide the calendar.
Location: Location of the calendar on the chart.
Size: Calendar size.
🔶 USAGE
The proposed script can allow users to quickly determine if a specific day/month is considered bullish or bearish. A green cell is used for bullish days/months, while a red one is used for bearish days/months.
Additionally vertical lines are displayed on new days/months with a color highlighting the current sentiment for this specific day/month. Note that this is done retrospectively, the color of a line set at time t might differ at time t+n .
🔶 SENTIMENT METHODS
Determining whether a day/month is bullish or bearish can be done using three different methods. Note that each method makes use of the closing price as the input, and as such can eventually return different results depending on the selected timeframe. Each method is described below:
🔹 Linreg
The Linreg method fit lines between each day/month using the method of least squares and determines if that particular day is bullish or bearish based on the line slope sign. For example, a rising line would indicate a bullish day/month.
🔹 Accumulated Deltas
The method of accumulated deltas simply accumulates bullish and bearish price changes for the current day/month, the result with the highest magnitude determines the sentiment for that day/month.
🔹 Max/Min
The max/min method computes a trailing maximum and a trailing minimum for the current day/month. The sentiment is determined by the price position relative to the average between the obtained maximum/minimum, with a bullish sentiment being determined if price is above the average.

Rotational Gravity OscillatorMade using elements from two Cheatcountry scripts:
Includes a Bollinger Band for bounds that forms a trend follower based on the 0 point.
Includes CheatCountry color code signals, different color scheme. Bright colors are strong signals, ark are weak, green bull, red bear, the basics.
Switches for Bollinger Band color codes, which can actually be useful signals.
This oscillator can be used for divergences, trends, signal strength, confirmation, volatility readings, you name it.
It is a comparative oscillator, that compares adaptively smoothed, weighted modified Change of Gravity oscillators between 2 symbols and multiple lengths to determine directional momentum as one asset compares to another.
The default uses the Crypto TOTAL market cap to help trade cryptocurrencies. You will notice that BTC will give sell signals in uptrends at times. That is because it is being compared to an index of the total Crypto market cap, and since alt-coins move faster, BTC will lag behind this index.
Give CheatCountry a follow, hes one of the MVPs of Tradingview Pinescripters, constantly giving us access to novel new concepts as they are published by professionals.

Ma PullbackThis indicator is based on ema band....
condition for buy =>
1) price should crossover ema band
2) price pullback on ema band but price should not close below lower band
3)after pullback green candle should close above ema band
4)check candle size when its crossing ema band
5)check previous canlde 7 should not touching cloud so (we can reduce range signal)
condition for sell =>
1) price should crossunder ema band
2) price pullback on ema band but price should not close above upper band
3)after pullback red candle should crossunder ema band
4)check candle size when its crossing ema band
5)check previous canlde 7 should not touching cloud so (we can reduce range signal)
this indicator also for education purpuse how we can make pullback condition....

Orb breakout Buy condition =>ORB range 9:20-9:25. On 5 min TF if candle breaks high and next candle break high of that candle. buy signal when third candle breaks high of 2nd candle
Sell condition=>ORB range 9:20-9:25. On 5 min TF if candle breaks low and next candle break low of that candle. sell signal when third candle breaks low of 2nd candle
this indicator is extended version of my previous indicator i got a comment request from @RISHISAKHARE to devlope indicator based on above mention rule ....

HMA Breakout Buy/Sell indicator for Scalping & Intraday - ShyamHi All,
This is a very simple indicator which provides the buy signal, when the moving average lines turns Green and sell signal, when the moving average signal turns red. This can be used for both intraday and scalping method with different timeframes. But best time frame is 5 minutes.
Buy Signal >>> Line turns GREEN (Use trailing SL to cover maximum profit)
Sell Signal >>> Line turns RED (Use trailing SL to cover maximum profit)
No trade >>> Line turns GRAY
Best timeframe >>> 5 minutes
Thanks,
Shyam

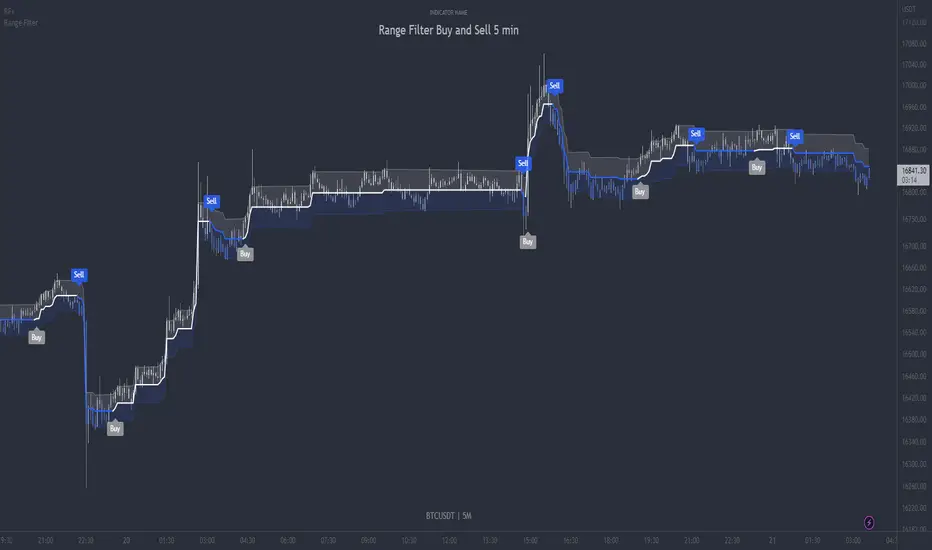
Range Filter Buy and Sell 5min - guikroth versionRange Filter Buy and Sell 5min - the @guikroth version, republished.
Since this popular version of the Range Filter is no longer available via the original author, I republish it here under the same name.
This version remains true to the guikroth version from the calculations to the default settings and comments in the code, with the exception of an update to the latest version of PineScript, minor styling adjustments and the addition of an all-in-one 'buy or sell' alert option.
The guikroth version was a simplified modification of the original Range Filter by @DonovanWall .
Including having just 3 bar colours based on the filtered price trend, different source input options to the original, and the addition of buy and sell signals and alerts based upon the Range Filter colour change. It consisted of just three inputs; source, sampling period, and range multipler. With the update to version 5, external indicators can also be used as inputs, for example using a VWAP or EMA loaded on your chart as the input on the Range Filter is now also possible.
What is the Range Filter?
As the author of the original Range Filter describes it:
"This is an experimental study designed to filter out minor price action for a clearer view of trends. Inspired by the QQE's volatility filter, this filter applies the process directly to price rather than to a smoothed RSI .
First, a smooth average price range is calculated for the basis of the filter and multiplied by a specified amount.
Next, the filter is calculated by gating price movements that do not exceed the specified range.
Lastly the target ranges are plotted to display the prices that will trigger filter movement.
Custom bar colors are included. The color scheme is based on the filtered price trend."
Popularity of the Range Filter
The Range Filter is a very popular and effective indicator in its own right, with adjustments to the few simple settings it is possible to use the Range Filter for helping filter price movement, whether helping to determine trend direction or ranges, to timing breakout or even reversal entries. Its practical versatility makes it ideal for integrating it's signals into a variety of trading strategies or even other indicators.
With many thanks to the authors of the previous and original versions; @guikroth and @DonovanWall .