NIFTY RENKO OPTION CE/PENIFTY RENKO OPTION CE/PE ek non-repainting intraday Renko-based option direction indicator hai jo price action + money flow ko combine karke CE / PE buy signals generate karta hai.
Sellers

[AlbaTherium] Volume Venturius Premium Volume Venturius Premium
Introduction
The Volume Venturius Premium is an advanced market analysis tool designed to deeply investigate the behavior of active market participants. By focusing exclusively on executed market orders, Volume Venturius offers traders a unique perspective on buy and sell volumes. Unlike traditional order books that track passive orders, this indicator isolates active orders, shedding light on real market dynamics.
Chapter 1: Understanding Market Participants
1.1 Categories of Market Participants
Market participants can be classified into several categories based on their:
Size : The volume of trades executed.
Influence : Their ability to initiate bull or bear campaigns.
Strategy : The trading methods employed, such as scalping, swing trading, or high-frequency trading.
Objectives : Whether their focus is on speculation, hedging, or arbitrage.
Time Horizon : Short-term versus long-term goals.
Behavioral Patterns : Their reaction to liquidity levels or price movements.
1.2 Objectives of Market Participants
Each category pursues specific objectives, such as profit-making or risk management. Regulatory reports like the Commitment of Traders (COT) provide weekly insights into the positions and intentions of major players.
Chapter 2: The Philosophy of Volume Analysis
2.1 Active Orders vs. Passive Orders
Unlike passive orders waiting to be filled at specific prices, active orders directly impact market prices. By focusing on these executed orders, Volume Venturius Premium provides traders with actionable insights into market trends and momentum.
2.2 Wyckoff’s Market Dynamics
According to Wyckoff, markets operate in two primary phases:
Manipulation: Where large participants accumulate or distribute positions to prepare for a move.
Expansion: The phase where price trends begin to unfold, either in a bullish or bearish direction.
Wyckoff’s theory emphasizes understanding how major players manipulate the market to identify accumulation or distribution zones. Volume Venturius Premium aids in pinpointing these manipulative actions by analyzing volume and order flow data.
Chapter 3: The Secrets of Order Flow and Volume
3.1 Unveiling Market Control
By studying the positioning and execution volumes of large players, traders can discern who holds control in the market. Volume Venturius Premium identifies the balance of power and tracks shifts that signal potential trend reversals.
3.2 Behavioral Patterns in Volume
Key metrics tracked by Volume Venturius Premium include:
Volume Clusters : Areas of concentrated buying or selling activity.
Directional Bias : Whether market participants are net buyers or sellers.
Momentum Shifts : Changes in execution speed and volume that may precede major moves.
3.2.1 Volume Clusters, Directional Bias and Directional Bias: Areas of Concentrated Buying or Selling Activity
Volume clusters play a crucial role in understanding market dynamics by highlighting areas where aggressive buying or selling activity is most concentrated. These clusters often serve as key decision zones, providing insights into potential reversals, breakouts, or continuations. To better visualize and interpret these zones, a distinct color-coding system has been implemented. Each color represents a specific market condition or level of activity, allowing for a more intuitive analysis of volume behavior and its influence on price movement.
Below is a detailed explanation of the color logic used to represent these clusters and their significance within the trading framework.
Color Interpretation and Meaning :
Extra Extreme Zones
These zones highlight areas where clusters of aggressive buyers or sellers are most heavily concentrated. They represent critical levels for identifying potential reversals or strong continuations.
Bright Red (#ff003c) : Represents extra-extreme sell zones, where aggressive sellers dominate.
Meaning: Indicates extreme selling pressure, often signaling potential exhaustion of sellers.
Bright Blue (#001eff) : Represents extra-extreme buy zones, where aggressive buyers are most active.
Meaning: Shows extreme buying pressure, possibly marking a saturation point for buyers.
Main Zones
These zones help identify key levels based on volume activity and well-defined clusters.
Dark Red (#d60033) : Represents strong selling pressure.
Orange (#ff8000) : Indicates significant selling pressure that begins to fade.
Yellow (#ffff00) : Represents moderate selling pressure, signaling a potential slowdown.
White (#ffffff) : Marks transition zones, which are interesting entry points for potential reversals or continuations.
Transition Zones (Frontier Zones)
These zones indicate intermediate movements and potential shifts in momentum.
Transparent Black (#000000, 50) : Represents transition areas, where the market tests boundaries between buyers and sellers.
Meaning: These are critical decision points.
Neutral Zone (Sea Zone)- Trend Zones
These zones represent more balanced market activity, where neither buyers nor sellers dominate clearly.
Transparent Green (#00e040, 25) : Indicates slight bullish activity in a neutral zone.
Transparent Red (#e01a00, 25) : Indicates slight bearish activity in a neutral zone.
This color logic allows you to pinpoint areas where volume clusters show a clear dominance, exhaustion, or optimal entry opportunities.
3.3 Divergences Between Price and Volume
Divergences between price and volume are critical for identifying key shifts in market sentiment. Volume Venturius Premium distinguishes two main types of divergences: Lack of Participation and Absorption, each offering valuable signals for potential reversals or continuations.
Lack of Participation
This divergence occurs when price movements are not supported by corresponding volume dynamics, signaling a reduction in activity from significant market participants.
1. Bullish Lack of Participation:
Characteristics : Price is making lower lows, but volume is making higher lows.
This indicates waning selling pressure as prices drop.
Inference : A potential bullish reversal may occur. Traders could consider looking for opportunities to go long.
2.Bearish Lack of Participation:
Characteristics : Price is making higher highs, but volume is making lower highs. This suggests diminishing buying pressure even as prices rise.
Inference : A potential bearish reversal might follow. Traders might position to go short.
Absorption
Absorption occurs when larger market participants neutralize the pressure from smaller participants, often leading to significant market moves.
1.Bullish Absorption:
Characteristics : Price is making higher bottoms, but volume is making lower bottoms.
This reflects sellers being trapped as their selling efforts are absorbed by larger buyers.
Inference : A potential upward breakout is likely. Traders may look for opportunities to go long.
2.Bearish Absorption:
Characteristics : Price is making lower tops, but volume is making higher tops. This indicates buyers being trapped as larger sellers absorb their buying activity.
Inference : A downward breakout is probable. Traders may consider positioning to go short.
Chapter 4: Practical Application and Trading Strategies
4.1 Leveraging Active Order Insights
Learn how to use Volume Venturius Premium to detect hidden accumulation or distribution phases. Strategies include identifying spikes in active volume that signal institutional participation.
4.2 Confirming Bull and Bear Campaigns
Gain confidence in detecting the early stages of bullish or bearish campaigns by analyzing the interplay between active orders and volume flow.
Chapter 5: Real-World Examples
5.1 Analyzing Market Manipulation
See how Volume Venturius Premium can reveal manipulation tactics employed by large players to trigger liquidity events.
5.2 Spotting Trends with Active Orders
Real-life scenarios demonstrate how the tool can be used to identify and ride the market’s dominant trend.
Conclusion
The Volume Venturius Premium is an indispensable tool for traders who seek to understand the underlying mechanics of market movement. By focusing on active order flows and drawing on Wyckoff’s principles, it provides unique insights into market manipulation and expansion phases. Whether you’re an intraday trader or a long-term strategist, this tool empowers you to anticipate market shifts and trade with confidence.
Stay tuned for updates as we continue to refine Volume Venturius Premium to further enhance your trading journey.

buyer_seller_scalping_indicatorThis code is a custom script designed for analyzing trading volume within a specific time window on the TradingView platform. It offers a comprehensive analysis of buying and selling activity during a defined period and provides visual aids and data summaries for traders to make informed decisions. Here's a detailed breakdown of its functionality and how to use it:
1. Custom Time Period: The script starts by allowing you to specify a custom time period for analysis. In this example, it's set from 04:00 to 09:29. You can modify these time values to suit your specific trading needs.
2. Volume Calculation: The script calculates buying and selling volume based on price levels. It takes into account the open, high, low, and close prices to determine whether buying or selling pressure is dominant during the specified time frame.
3. Total Volume Calculation: It calculates the total volume within the custom time period. This can help you gauge the overall activity and liquidity during the chosen time window.
4. Visualizations: The script then plots visual elements on the chart:
- A volume histogram, which provides a graphical representation of the total volume during the time period.
- Buying and selling volume indicators, which are shown as circles on the chart, highlighting the relative strength of buyers and sellers.
- An average volume line, represented in gray, which helps you identify the average trading volume over a 50-period moving average.
5. Volume Type Determination: The script determines whether buyers or sellers dominate the market during the specified time period. It labels this as "Buyers Volume > Sellers Volume," "Sellers Volume > Buyers Volume," or "Buyers Volume = Sellers Volume." This information can be crucial for assessing market sentiment.
6. Percentage Breakdown: The script calculates the percentage of buying and selling volume in relation to the total volume, helping you understand the distribution of market participants. These percentages are displayed in a table.
7. Table Display: Finally, the script creates a table that displays the following information:
- The current volume type (buyers, sellers, or balanced), with corresponding text colors.
- The percentage of buyers and sellers in the market.
How to Use:
1. Copy the script and add it as a custom script on TradingView.
2. Apply the script to your desired financial chart.
3. Adjust the custom time period if needed.
4. Interpret the visual elements and table to gain insights into market sentiment and volume distribution during the specified time frame.
5. Use this information to inform your trading decisions and strategies, especially when trading within the chosen time window.
This script is a valuable tool for traders seeking to understand market dynamics and volume behavior during specific trading hours, ultimately aiding in more informed trading decisions.
Disclaimer:
The indicator provided herein is experimental and has not undergone comprehensive testing. Its usage is solely at your own risk.
The publisher assumes no responsibility for any trading decisions made based on the utilization of this indicator.

Volume with Buy and SellDesign for Day Trade only
Calculate a lower timeframe (e.g. 1min).
assuming buyers are more when close > open, sellers are more when open > close.
average by hma and plot buyer / seller as a line.
Change background color

Realtime Volume Analysis ToolbarThis script displays an intrabar volume analysis in realtime
displayed data is the following
Total volume
Up volume
Down volume
Delta
Buyers %
More options will be added in the future, at least customization of the colors.

Trapped Traders - SR Levels/Zones (Expo) Trapped Traders - SR Levels/Zones (Expo) automatically identifies and displays support and resistance levels based on where Bulls & Bears can be trapped.
Levels are displayed where there is a high probability that market participants will be trapped and forced to exit their positions if the price breakouts from the SR level.
If the price doesn't breakouts from the SR level there's a chance that the market has topped or bottomed out.
The indicator can be used standalone or as a part of your current trading strategy.
Real-time
No repainting
Works on any market
HOW TO USE
1. Use the indicator to identify where Bulls and Bears can be trapped.
2. Use the indicator to identify potential breakouts in the trend direction.
3. Use the indicator to identify potential reversal points.
INDICATOR IN ACTION
Daily Chart
I hope you find this indicator useful , and please comment or contact me if you like the script or have any questions/suggestions for future improvements. Thanks!
I will continually work on this indicator, so please share your experience and feedback as it will enable me to make even better improvements. Thanks to everyone that has already contacted me regarding my scripts. Your feedback is valuable for future developments!
ACCESS THE INDICATOR
• Contact me on TradingView or use the links below
-----------------
Disclaimer
Copyright by Zeiierman.
The information contained in my scripts/indicators/ideas does not constitute financial advice or a solicitation to buy or sell any securities of any type. I will not accept liability for any loss or damage, including without limitation any loss of profit, which may arise directly or indirectly from the use of or reliance on such information.
All investments involve risk, and the past performance of a security, industry, sector, market, financial product, trading strategy, or individual’s trading does not guarantee future results or returns. Investors are fully responsible for any investment decisions they make. Such decisions should be based solely on an evaluation of their financial circumstances, investment objectives, risk tolerance, and liquidity needs.
My scripts/indicators/ideas are only for educational purposes!

Color Coded Commodity Channel IndexThis is a simple CCI that has the levels needed marked and color coded based on the place it sits on the zones. The CCI is one of the best tools you can use to identify which side of the market is in control at the moment.

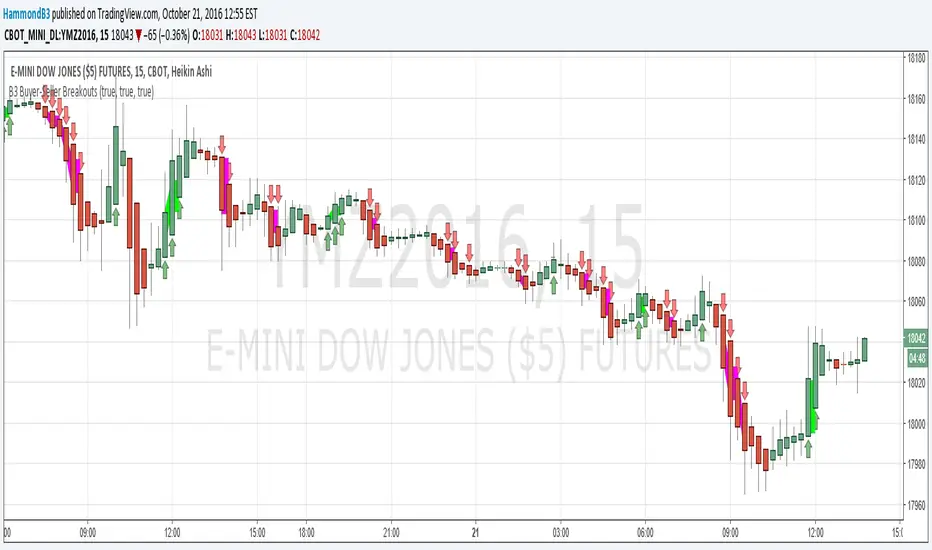
B3 Buyer-Seller BreakoutsB3 Buyer-Seller Breakouts = If a bar is showing that it is moving in a direction with highs lows and close, all of which are >respectively< moving against the open from the bar before, then it prints indicating buyers or sellers bringing momentum. The arrows and cloud carry into the next bar to give lots of awareness of the micro-term momentum. The cloud represents the better price range from which to add to a position.
This study repaints within the bar, most of my indicators do not, but this one is about timing to get an edge on adding to your already in play position, becoming part of the needed momentum to hit profit targets faster. Also, this theory helps you add to winners, and if you never add to losers, you now have statistical odds in your favor. I got the idea for the study reading about turtle trader method and how that statistical edge is really why it works, always adding on every breakout. Keep in mind that I never buy or sell breakouts to initiate trades, only to scale in.
~Cheers!~ ~B3