Rolling 250-Day Sharpe RatioThis Pine Script indicator, “Rolling 250-Day Sharpe Ratio”, computes the trailing Sharpe Ratio for any traded asset over a 250-session window, equivalent to approximately one trading year. The script first derives daily log returns and adjusts them by subtracting the daily equivalent of the 3-month US Treasury yield to obtain the excess return. It then calculates the rolling mean and standard deviation of these excess returns to produce the annualized Sharpe Ratio, which is displayed as a continuous time series on the chart. This allows traders and analysts to assess how the asset’s risk-adjusted performance evolves over time relative to a risk-free benchmark.
A persistently high Sharpe Ratio can indicate strong risk-adjusted returns, but it is essential to approach extreme values with caution. Elevated Sharpe readings can sometimes reflect unsustainable trends, excessive leverage, or periods of unusually low volatility that may revert abruptly. Conversely, a low or negative Sharpe Ratio does not automatically imply an asset should be avoided; it might signal an opportunity if the risk environment normalizes.
Sharperatio

Bitcoin Macro Oscillator | [DeV]The Bitcoin Macro Oscillator (BMO) is a sophisticated fundamental indicator designed to provide a comprehensive view of Bitcoin’s market conditions by combining four key on-chain metrics: the Market Value to Realized Value (MVRV) Ratio, Volume-Weighted Average Price (VWAP) Ratio, Cumulative Value-Days Destroyed (CVDD) Ratio, and Sharpe Ratio. These metrics are individually z-scored and weighted according to user-defined preferences, then averaged to produce a single oscillating value, the BMO Z-score. This helps users identify whether Bitcoin is in a bullish (above zero) or bearish (below zero) phase, offering insights into potential market tops, bottoms, and overall trend strength. Inspired and reverse engineered from the BMO of Woonomics, this indicator is enhanced with a customizable moving average.
Market Value to Realized Value (MVRV) Ratio
The MVRV Ratio compares Bitcoin’s current market capitalization (price multiplied by circulating supply) to its realized capitalization (the value of all coins at the price they were last moved on the blockchain). Calculated as MVRV = Market Cap / Realized Cap, it is then z-scored over a user-defined lookback period (default 120 days). This metric tracks whether Bitcoin is overvalued (high MVRV, suggesting a market top) or undervalued (low MVRV, indicating a potential bottom), providing a gauge of investor profitability and market sentiment.
Volume-Weighted Average Price (VWAP) Ratio
The VWAP Ratio measures Bitcoin’s current price against its volume-weighted average price, which is computed by summing the product of price and volume over a lookback period (default 120 days) and dividing by total volume, with a fallback to the current price if volume is zero. The ratio is z-scored to standardize it. This tracks the relationship between price and the average price paid with volume consideration, helping identify overbought or oversold conditions—high values may signal tops, while low values suggest bottoms.
Cumulative Value-Days Destroyed (CVDD) Ratio
The CVDD Ratio is based on the CVDD metric, which estimates the total value of Bitcoin that has been “destroyed” (spent at a loss) over time, approximated here using a longer-term simple moving average (SMA) of the price over twice the lookback period. The ratio is calculated as the current price divided by this CVDD price, then z-scored. It tracks the accumulation of value destruction, with low values indicating bearish exhaustion and high values suggesting bullish momentum.
Sharpe Ratio
The Sharpe Ratio assesses Bitcoin’s risk-adjusted return by comparing the average return (calculated as the natural log of the price change) to its volatility (standard deviation of returns) over a user-defined Sharpe lookback period (default 180 days). If volatility is zero, it defaults to zero to avoid errors. This z-scored value tracks whether Bitcoin’s price movements offer a favorable return for the risk taken—positive values indicate good risk-adjusted performance, while negative values suggest caution.
Together, the MVRV, VWAP, CVDD, and Sharpe Ratio metrics provide a multi-faceted view of Bitcoin’s market health, with each contributing unique insights into valuation, volume, value destruction, and risk-adjusted performance. Their weighted combination into the BMO Z-score balances these inputs to offer a unified signal, enhanced by a customizable moving average (default 90-period EMA) that smooths the Z-score for trend confirmation—rising when bullish, falling when bearish. Credit to Woonomics for inspiring this robust framework, which adapts their BMO concept into a flexible, user-tailored tool.

Sharpe and Sortino Ratios with Date RangeThis indicator calculates the Sharpe and Sortino ratios using a chart symbol's periodic price returns.
I added the ability to calculate SORTINO and Sharpe based on CUSTOM DATES within the option menu.
It builds on the script here: by adding this feature.
A little about the Sortino Ratio.
www.nasdaq.com
I want equity market returns, but I don’t want equity market volatility. This is the sentiment many investors naturally feel. This sentiment often grows stronger as one approaches or is in the phase where they desire distributions from their savings to improve lifestyle. This is why there is a need for active management in the investment arena. The desire to control downside volatility, but also participate in the upside growth is a very fundamental human desire. The Sortino Ratio measures how well a particular investment meets this fundamental human desire.
There is the old adage, “volatility is the price you pay for returns.” However, what if we could measure the historical performance of an investment and see if it has given above average returns compared to the downside volatility. This is a simple division problem. It will tell us if the volatility “price we are paying for returns” is good. We can then compare that to other investments to see how they compare.
Let us take the return and subtract the risk-free interest rate and then simply divide that by the downside movement from the average. A basic division problem yielding a number that measures a very basic human desire: How well did this investment do compared to the downside risk it experienced.
In the world of financial analysis and investment management, ratios are abundant. There are many ratios that are truly important to a particular analysis. However, the sheer abundance of ratios that are available often overwhelms the casual investor, leading them to disregard ratios altogether. I would argue for those investors that desire a way to rank an investment by its ability to satisfy this very fundamental human desire, the Sortino Ratio is the number they need to consider.
Disappointing in the marketplace for research, the Sortino Ratio is not featured prominently. It is much easier to find the inflows a particular ETF has experienced than the Sortino Ratio. Inflows are important. They measure how much people are investing into an ETF. However, they are mostly only important to the fund manager, not the investor. What investors care about is the Risk-Adjusted Return. This is the Sortino Ratio.

Dynamic Risk-Adjusted Performance Ratios with TableWith this indicator, you have everything you need to monitor and compare the Sharpe ratio, Sortino ratio, and Omega ratio across multiple assets—all in one place. This tool is designed to help save time and improve efficiency by letting you track up to 15 assets simultaneously in a fully customizable table. You can adjust the lookback period to fit your trading strategy and get a clearer picture of how your assets perform over time. Instead of switching between charts, this indicator puts all the critical information you need at your fingertips.
Sharpe Ratio -
Helps evaluate the overall efficiency of investments by comparing the average return to the total risk (measured by the standard deviation of all returns). Essentially, it tells you how much excess return you’re getting for each unit of risk you’re taking. A higher Sharpe ratio means you’re getting better risk-adjusted performance—something you’ll want to aim for in your portfolio.
Sortino Ratio -
Goes a step further by focusing only on downside risk—because let’s face it, no one worries about positive volatility. This ratio is calculated by dividing the average return by the standard deviation of only the negative returns. Perfect for those concerned about avoiding losses rather than chasing extreme gains. It gives you a sharper view of how well your assets are performing relative to the risks you’re trying to avoid.
Omega Ratio -
Offers a unique perspective by comparing the sum of positive returns to the absolute sum of negative returns. It’s a straightforward way to see if your wins outweigh your losses. A higher Omega ratio means your positive returns significantly exceed the downside, which is exactly what you want when building a strong, reliable portfolio.
This indicator is perfect for traders who want to streamline their decision-making process and gain an edge. Bringing together these three critical ratios into a single user-defined table makes it easy to compare and rank assets at a glance. Whether optimizing a portfolio or looking for the best opportunities, this tool helps you stay ahead by focusing on risk-adjusted returns. The customizable lookback period lets you tailor the analysis to fit your unique trading approach, giving you insights that align with your goals. If you’re serious about making data-driven decisions and improving your trading outcomes, this indicator is a game-changer for your toolkit.

The Adaptive Pairwise Momentum System [QuantraSystems]The Adaptive Pairwise Momentum System
QuantraSystems guarantees that the information created and published within this document and on the Tradingview platform is fully compliant with applicable regulations, does not constitute investment advice, and is not exclusively intended for qualified investors.
Important Note!
The system equity curve presented here has been generated as part of the process of testing and verifying the methodology behind this script.
Crucially, it was developed after the system was conceptualized, designed, and created, which helps to mitigate the risk of overfitting to historical data. In other words, the system was built for robustness, not for simply optimizing past performance.
This ensures that the system is less likely to degrade in performance over time, compared to hyper-optimized systems that are tailored to past data. No tweaks or optimizations were made to this system post-backtest.
Even More Important Note!!
The nature of markets is that they change quickly and unpredictably. Past performance does not guarantee future results - this is a fundamental rule in trading and investing.
While this system is designed with broad, flexible conditions to adapt quickly to a range of market environments, it is essential to understand that no assumptions should be made about future returns based on historical data. Markets are inherently uncertain, and this system - like all trading systems - cannot predict future outcomes.
Introduction
The Adaptive Pairwise Momentum System is not just an indicator but a comprehensive asset rotation and trend-following system. In short, it aims to find the highest performing asset from the provided range.
The system dynamically optimizes capital allocation across up to four high-performing assets, ensuring that the portfolio adapts swiftly to changing market conditions. The system logic consists of sophisticated quantitative methods, rapid momentum analysis, and robust trend filtering. The overarching goal is to ensure that the portfolio is always invested in the highest-performing asset based on dynamic market conditions, while at the same time managing risk through broader market filters and internal mechanisms like volatility and beta analysis.
Legend
System Equity Curve:
The equity curve displayed in the chart is dynamically colored based on the asset allocation at any given time. This color-coded approach allows traders to immediately identify transitions between assets and the corresponding impact on portfolio performance.
Highlighting of Current Highest Performer:
The current bar in the chart is highlighted based on the confirmed highest performing asset. This is designed to give traders advanced notice of potential shifts in allocation even before a formal position change occurs. The highlighting enables traders to prepare in real time, making it easier to manage positions without lag, particularly in fast-moving markets.
Highlighted Symbols in the Asset Table:
In the table displayed on the right hand side of the screen, the current top-performing symbol is highlighted. This clear signal at a glance provides immediate insight into which asset is currently being favored by the system. This feature enhances clarity and helps traders make informed decisions quickly, without needing to analyze the underlying data manually.
Performance Overview in Tables:
The left table provides insight into both daily and overall system performance from inception, offering traders a detailed view of short-term fluctuations and long-term growth. The right-hand table breaks down essential metrics such as Sharpe ratio, Sortino ratio, Omega ratio, and maximum drawdown for each asset, as well as for the overall system and HODL strategy.
Asset-Specific Signals:
The signals column in the table indicates whether an asset is currently held or being considered for holding based on the system's dynamic rankings. This is a critical visual aid for asset reallocation decisions, signaling when it may be appropriate to either maintain or change the asset of the portfolio.
Core Features and Methodologies
Flexibility in Asset Selection
One of the major advantages of this system is its flexibility. Users can easily modify the number and type of assets included for comparison. You can quickly input different assets and backtest their performance, allowing you to verify how well this system might fit different tokens or market conditions. This flexibility empowers users to adapt the system to a wide range of market environments and tailor it to their unique preferences.
Whole System Risk Mitigation - Macro Trend Filter
One of the features of this script is its integration of a Macro-level Trend Filter for the entire portfolio. The purpose of this filter is to ensure no capital is allocated to any token in the rotation system unless Bitcoin itself is in a positive trend. The logic here is that Bitcoin, as the cryptocurrency market leader, often sets the tone for the entire cryptocurrency market. By using Bitcoins trend direction as a barometer for overall market conditions, we create a system where capital is not allocated during unfavorable or bearish market conditions - significantly reducing exposure to downside risk.
Users have the ability to toggle this filter on and off in the input menu, with five customizable options for the trend filter, including the option to use no filter. These options are:
Nova QSM - a trend aggregate combining the Rolling VWAP, Wave Pendulum Trend, KRO Overlay, and the Pulse Profiler provides the market trend signal confirmation.
Kilonova QSM - a versatile aggregate combining the Rolling VWAP, KRO Overlay, the KRO Base, RSI Volatility Bands, NNTRSI, Regression Smoothed RSI and the RoC Suite.
Quasar QSM - an enhanced version of the original RSI Pulsar. The Quasar QSM refines the trend following approach by utilizing an aggregated methodology.
Pairwise Momentum and Strength Ranking
The backbone of this system is its ability to identify the strongest-performing asset in the selected pool, ensuring that the portfolio is always exposed to the asset showing the highest relative momentum. The system continually ranks these assets against each other and determines the highest performer by measure of past and coincident outperformance. This process occurs rapidly, allowing for swift responses to shifts in market momentum, which ensures capital is always working in the most efficient manner. The speed and precision of this reallocation strategy make the script particularly well-suited for active, momentum-driven portfolios.
Beta-Adjusted Asset Selection as a Tiebreaker
In the circumstance where two (or more) assets exhibit the same relative momentum score, the system introduces another layer of analysis. In the event of a strength ‘tie’ the system will preference maintaining the current position - that is, if the previously strongest asset is now tied, the system will still allocate to the same asset. If this is not the case, the asset with the higher beta is selected. Beta is a measure of an asset’s volatility relative to Bitcoin (BTC).
This ensures that in bullish conditions, the system favors assets with a higher potential for outsized gains due to their inherent volatility. Beta is calculated based on the Average Daily Return of each asset compared to BTC. By doing this, the system ensures that it is dynamically adjusting to risk and reward, allocating to assets with higher risk in favorable conditions and lower risk in less favorable conditions.
Dynamic Asset Reallocation - Opposed to Multi-Asset Fixed Intervals
One of the standout features of this system is its ability to dynamically reallocate capital. Unlike traditional portfolio allocation strategies that may rebalance between a basket of assets monthly or quarterly, this system recalculates and reallocates capital on the next bar close (if required). As soon as a new asset exhibits superior performance relative to others, the system immediately adjusts, closing the previous position and reallocating funds to the top-ranked asset.
This approach is particularly powerful in volatile markets like cryptocurrencies, where trends can shift quickly. By reallocating swiftly, the system maximizes exposure to high-performing assets while minimizing time spent in underperforming ones. Moreover, this process is entirely automated, freeing the trader from manually tracking and measuring individual token strength.
Our research has demonstrated that, from a risk-adjusted return perspective, concentration into the top-performing asset consistently outperforms broad diversification across longer time horizons. By focusing capital on the highest-performing asset, the system captures outsized returns that are not achievable through traditional diversification. However, a more risk-averse investor, or one seeking to reduce drawdowns, may prefer to move the portfolio further left along the theoretical Capital Allocation Line by incorporating a blend of cash, treasury bonds, or other yield-generating assets or even include market neutral strategies alongside the rotation system. This hybrid approach would effectively lower the overall volatility of the portfolio while still maintaining exposure to the system’s outsized returns. In theory, such an investor can reduce risk without sacrificing too much potential upside, creating a more balanced risk-return profile.
Position Changes and Fees/Slippage
Another critical and often overlooked element of this system is its ability to account for fees and slippage. Given the increased speed and frequency of allocation logic compared to the buy-and-hold strategy, it is of vital importance that the system recognises that switching between assets may incur slippage, especially in highly volatile markets. To account for this, the system integrates realistic slippage and fee estimates directly into the equity curve, simulating expected execution costs under typical market conditions and gives users a more realistic view of expected performance.
Number of Position Changes
Understanding the number of position changes in a strategy is critical to assessing its feasibility in real world trading. Frequent position changes can lead to increased costs due to slippage and fees. Monitoring the number of position changes provides insight into the system’s behavior - helping to evaluate how active the strategy is and whether it aligns with the trader's desired time input for position management.
Equity Curve and Performance Calculations
To provide a benchmark, the script also generates a Buy-and-Hold (or "HODL") equity curve that represents an equal split across the four selected assets. This allows users to easily compare the performance of the dynamic rotation system with that of a more traditional investment strategy.
The script tracks key performance metrics for both the dynamic portfolio and the HODL strategy, including:
Sharpe Ratio
The Sharpe Ratio is a key metric that evaluates a portfolio’s risk-adjusted return by comparing its ‘excess’ return to its volatility. Traditionally, the Sharpe Ratio measures returns relative to a risk-free rate. However, in our system’s calculation, we omit the risk-free rate and instead measure returns above a benchmark of 0%. This adjustment provides a more universal comparison, especially in the context of highly volatile assets like cryptocurrencies, where a traditional risk-free benchmark, such as the usual 3-month T-bills, is often irrelevant or too distant from the realities of the crypto market.
By using 0% as the baseline, we focus purely on the strategy's ability to generate raw returns in the face of market risk, which makes it easier to compare performance across different strategies or asset classes. In an environment like cryptocurrency, where volatility can be extreme, the importance of relative return against a highly volatile backdrop outweighs comparisons to a risk-free rate that bears little resemblance to the risk profile of digital assets.
Sortino Ratio
The Sortino Ratio improves upon the Sharpe Ratio by specifically targeting downside risk and leaves the upside potential untouched. In contrast to the Sharpe Ratio (which penalizes both upside and downside volatility), the Sortino Ratio focuses only on negative return deviations. This makes it a more suitable metric for evaluating strategies like the Adaptive Pairwise Momentum Strategy - that aim to minimize drawdowns without restricting upside capture. By measuring returns relative to a 0% baseline, the Sortino ratio provides a clearer assessment of how well the system generates gains while avoiding substantial losses in highly volatile markets like crypto.
Omega Ratio
The Omega Ratio is calculated as the ratio of gains to losses across all return thresholds, providing a more complete view of how the system balances upside and downside risk even compared to the Sortino Ratio. While it achieves a similar outcome to the Sortino Ratio by emphasizing the system's ability to capture gains while limiting losses, it is technically a mathematically superior method. However, we include both the Omega and Sortino ratios in our metric table, as the Sortino Ratio remains more widely recognized and commonly understood by traders and investors of all levels.
Case Study
Notes
For the sake of brevity, the Important Notes section found in the header of this text will not be rewritten. Instead, it will be highlighted that now is the perfect time to reread these notes. Reading this case study in the context of what has been mentioned above is of key importance.
As a second note, it is worth mentioning that certain market periods are referred to as either “Bull” or “Bear” markets - terms I personally find to be vague and undefinable - and therefore unfavorable. They will be used nevertheless, due to their familiarity and ease of understanding in this context. Substitute phrases could be “Macro Uptrend” or “Macro Downtrend.”
Overview
This case study provides an in-depth performance analysis of the Adaptive Pairwise Momentum System , a long-only system that dynamically allocates to outperforming assets and moves into cash during unfavorable conditions.
This backtest includes realistic assumptions for slippage and fees, applying a 0.5% cost for every position change, which includes both asset reallocation and moving to a cash position. Additionally, the system was tested using the top four cryptocurrencies by market capitalization as of the test start date of 01/01/2022 in order to minimize selection bias.
The top tokens on this date (excluding Stablecoins) were:
Bitcoin
Ethereum
Solana
BNB
This decision was made in order to avoid cherry picking assets that might have exhibited exceptional historical performance - minimizing skew in the back test. Furthermore, although this backtest focuses on these specific assets, the system is built to be flexible and adaptable, capable of being applied to a wide range of assets beyond those initially tested.
Any potential lookahead bias or repainting in the calculations has been addressed by implementing the lookback modifier for all repainting sensitive data, including asset ratios, asset scoring, and beta values. This ensures that no future information is inadvertently used in the asset allocation process.
Additionally, a fixed lookback period of one bar is used for the trend filter during allocations - meaning that the trend filter from the prior bar must be positive for an allocation to occur on the current bar. It is also important to note that all the data displayed by the indicator is based on the last confirmed (closed) bar, ensuring that the entire system is repaint-proof.
The study spans the 2022 cryptocurrency bear market through the subsequent bull market of 2023 and 2024. The stress test highlights how the system reacted to one of the most challenging market downturns in crypto history - which includes events such as:
Luna and TerraUSD crash
Three Arrows Capital liquidation
Celsius bankruptcy
Voyager Digital bankruptcy
FTX collapse
Silicon Valley + Signature + Silvergate banking collapses
Subsequent USDC deppegging
And arguably more important, 2022 was characterized by a tightening of monetary policy after the unprecedented monetary easing in response to the Covid pandemic of 2020/2021. This shift undeniably puts downward pressure on asset prices, most probably to the extent that this had a causal role to many of the above events.
By incorporating these real-world challenges, the backtest provides a more accurate and robust performance evaluation that avoids overfitting or excessive optimization for one specific market condition.
The Bear Market of 2022: Stress Test and System Resilience
During the 2022 bear market, where the overall crypto market experienced deep and consistent corrections, the Adaptive Pairwise Momentum System demonstrated its ability to mitigate downside risk effectively.
Dynamic Allocation and Cash Exposure:
The system rotated in and out of cash, as indicated by the gray period on the system equity curve. This allocation to cash during downtrending periods, specifically in late 2022, acted as the systems ‘risk-off’ exposure - the purest form of such an exposure. This prevented the system from experiencing the magnitude of drawdown suffered by the ‘Buy-and-Hold (HODL) investors.
In contrast, a passive HODL strategy would have suffered a staggering 75.32% drawdown, as it remained fully allocated to chosen assets during the market's decline. The active Pairwise Momentum system’s smaller drawdown of 54.35% demonstrates its more effective capital preservation mechanisms.
The Bull Market of 2023 and 2024: Capturing Market Upside
Following the crypto bear market, the system effectively capitalized on the recovery and subsequent bull market of 2023 and 2024.
Maximizing Market Gains:
As trends began turning bullish in early 2023, the system caught the momentum and promptly allocated capital to only the quantified highest performing asset of the time - resulting in a parabolic rise in the system's equity curve. Notably, the curve transitions from gray to purple during this period, indicating that Solana (SOL) was the top-performing asset selected by the system.
This allocation to Solana is particularly striking because, at the time, it was an asset many in the market shunned due to its association with the FTX collapse just months prior. However, this highlights a key advantage of quantitative systems like the one presented here: decisions are driven purely from objective data - free from emotional or subjective biases. Unlike human traders, who are inclined (whether consciously or subconsciously) to avoid assets that are ‘out of favor,’ this system focuses purely on price performance, often uncovering opportunities that are overlooked by discretionary based investors. This ability to make data-driven decisions ensures that the strategy is always positioned to capture the best risk-adjusted returns, even in scenarios where judgment might fail.
Minimizing Volatility and Drawdown in Uptrends
While the system captured substantial returns during the bull market it also did so with lower volatility compared to HODL. The sharpe ratio of 4.05 (versus HODL’s 3.31) reflects the system's superior risk-adjusted performance. The allocation shifts, combined with tactical periods of cash holding during minor corrections, ensured a smoother equity curve growth compared to the buy-and-hold approach.
Final Summary
The percentage returns are mentioned last for a reason - it is important to emphasize that risk-adjusted performance is paramount. In this backtest, the Pairwise Momentum system consistently outperforms due to its ability to dynamically manage risk (as seen in the superior Sharpe, Sortino and Omega ratios). With a smaller drawdown of 54.35% compared to HODL’s 75.32%, the system demonstrates its resilience during market downturns, while also capturing the highest beta on the upside during bullish phases.
The system delivered 266.26% return since the backtest start date of January 1st 2022, compared to HODL’s 10.24%, resulting in a performance delta of 256.02%
While this backtest goes some of the way to verifying the system’s feasibility, it’s important to note that past performance is not indicative of future results - especially in volatile and evolving markets like cryptocurrencies. Market behavior can shift, and in particular, if the market experiences prolonged sideways action, trend following systems such as the Adaptive Pairwise Momentum Strategy WILL face significant challenges.

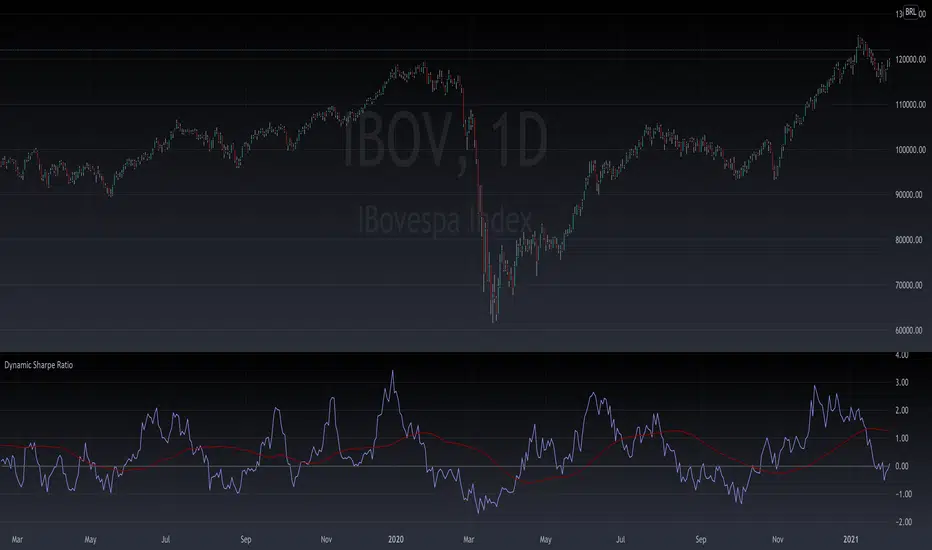
Leonid's Bitcoin Sharpe RatioThe Sharpe ratio is an old formula used to value the risk-adjusted return of an asset. It was developed by Nobel Laureate William F. Sharpe. In this case, I have applied it to Bitcoin with an adjustable look-back date.
The Sharpe Ratio shows you the average return earned after subtracting out the risk-free rate per unit of volatility (I've defaulted this to 0.02 ).
Volatility is a measure of the price fluctuations of an asset or portfolio. Subtracting the risk-free rate from the mean return allows you to understand what the extra returns are for taking the risk.
If the indicator is flashing red, Bitcoin is temporarily overbought (expensive).
If the indicator is flashing green, Bitcoin is temporarily oversold (cheap).
The goal of this indicator is to signal out local tops & bottoms. It can be adjusted as far as the lookback time but I have found 25-26 days to be ideal.

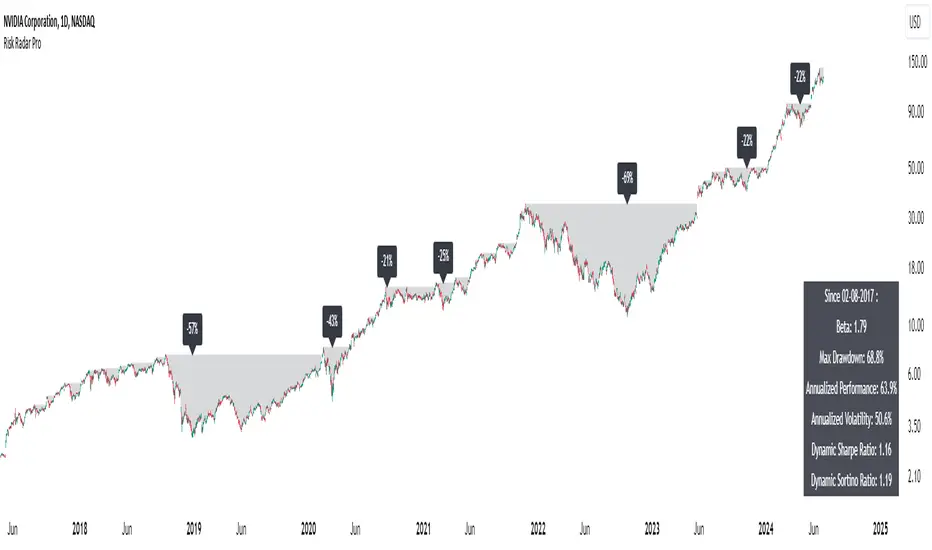
Risk Radar ProThe "Risk Radar Pro" indicator is a sophisticated tool designed to help investors and traders assess the risk and performance of their investments over a specified period. This presentation will explain each component of the indicator, how to interpret the results, and the advantages compared to traditional metrics.
The "Risk Radar Pro" indicator includes several key metrics:
● Beta
● Maximum Drawdown
● Compound Annual Growth Rate (CAGR)
● Annualized Volatility
● Dynamic Sharpe Ratio
● Dynamic Sortino Ratio
Each of these metrics is dynamically calculated using data from the entire selected period, providing a more adaptive and accurate measure of performance and risk.
1. Start Date
● Description: The date from which the calculations begin.
● Interpretation: This allows the user to set a specific period for analysis, ensuring that all metrics reflect the performance from this point onward.
2. Beta
● Description: Beta measures the volatility or systematic risk of the instrument relative to a reference index (e.g., SPY).
● Interpretation: A beta of 1 indicates that the instrument moves with the market. A beta greater than 1 indicates more volatility than the market, while a beta less than 1 indicates less volatility.
● Advantages: Unlike classic beta, which typically uses fixed historical intervals, this dynamic beta adjusts to market changes over the entire selected period, providing a more responsive measure.
3. Maximum Drawdown
● Description: The maximum observed loss from a peak to a trough before a new peak is achieved.
● Interpretation: This shows the largest single drop in value during the specified period. It is a critical measure of downside risk.
● Advantages: By tracking the maximum drawdown dynamically, the indicator can provide timely alerts when significant losses occur, allowing for better risk management.
4. Annualized Performance
● Description: The mean annual growth rate of the investment over the specified period.
● Interpretation: The Annualized Performance represents the smoothed annual rate at which the investment would have grown if it had grown at a steady rate.
● Advantages: This dynamic calculation reflects the actual long-term growth trend of the investment rather than relying on a fixed time frame.
5. Annualized Volatility
● Description: Measures the degree of variation in the instrument's returns over time, expressed as a percentage.
● Interpretation: Higher volatility indicates greater risk, as the investment's returns fluctuate more.
● Advantages: Annualized volatility calculated over the entire selected period provides a more accurate measure of risk, as it includes all market conditions encountered during that time.
6. Dynamic Sharpe Ratio
● Description: Measures the risk-adjusted return of an investment relative to its volatility.
● Choice of Risk-Free Rate Ticker: Users can select a ticker symbol to represent the risk-free rate in Sharpe ratio calculations. The default option is US03M, representing the 3-month US Treasury bill.
● Interpretation: A higher Sharpe ratio indicates better risk-adjusted returns. This ratio accounts for the risk-free rate to provide a comparison with risk-free investments.
● Advantages: By using returns and volatility over the entire period, the dynamic Sharpe ratio adjusts to changes in market conditions, offering a more accurate measure than traditional static calculations.
7. Dynamic Sortino Ratio
● Description: Similar to the Sharpe ratio, but focuses only on downside risk.
Interpretation: A higher Sortino ratio indicates better risk-adjusted returns, focusing solely on negative returns, which are more relevant to risk-averse investors.
● Choice of Risk-Free Rate Ticker: Similarly, users can choose a ticker symbol for the risk-free rate in Sortino ratio calculations. By default, this is also set to US03M.
● Advantages: This ratio's dynamic calculation considering the downside deviation over the entire period provides a more accurate measure of risk-adjusted returns in volatile markets.
Comparison with Basic Metrics
● Static vs. Dynamic Calculations: Traditional metrics often use fixed historical intervals, which may not reflect current market conditions. The dynamic calculations in "Risk Radar Pro" adjust to market changes, providing more relevant and timely information.
● Comprehensive Risk Assessment: By including metrics like maximum drawdown, Sharpe ratio, and Sortino ratio, the indicator provides a holistic view of both upside potential and downside risk.
● User Customization: Users can customize the start date, reference index, risk-free rate, and table position, tailoring the indicator to their specific needs and preferences.
Conclusion
The "Risk Radar Pro" indicator is a powerful tool for investors and traders looking to assess and manage risk more effectively. By providing dynamic, comprehensive metrics, it offers a significant advantage over traditional static calculations, ensuring that users have the most accurate and relevant information to make informed decisions.
The "Risk Radar Pro" indicator provides analytical tools and metrics for informational purposes only. It is not intended as financial advice. Users should conduct their own research and consider their individual risk tolerance and investment objectives before making any investment decisions based on the indicator's outputs. Trading and investing involve risks, including the risk of loss. Past performance is not indicative of future results.
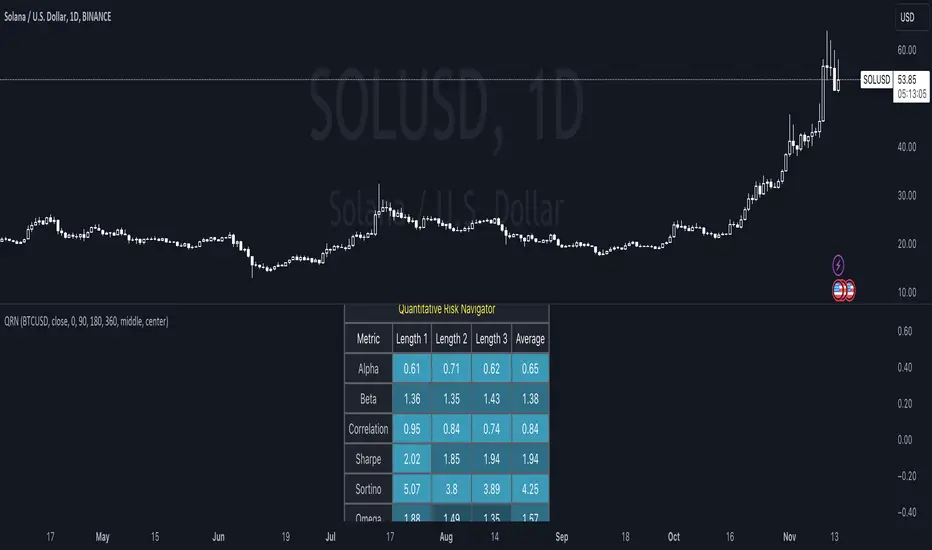
Quantitative Risk Navigator [kikfraben]📊 Quantitative Risk Navigator - Your Financial Performance GPS
Navigate the complexities of financial markets with confidence using the Quantitative Risk Navigator. This indicator provides you with a comprehensive dashboard to assess and understand the risk and performance of your chosen asset.
📈 Key Features:
Alpha and Beta Analysis: Uncover the outperformance (Alpha) and risk exposure (Beta) of your asset compared to a selected benchmark. Know where your investment stands in the market.
Correlation Insights: Understand the relationship between your asset and its benchmark through a clear visualization of correlation trends over different time lengths.
Risk-Return Metrics: Evaluate risk and return simultaneously with Sharpe and Sortino ratios. Make informed decisions by assessing the reward-to-risk ratio of your investment.
Omega Ratio: Gain deeper insights into your asset's performance by analyzing the Omega Ratio, which highlights the distribution of positive and negative returns.
Customizable Visualization: Tailor your chart to focus on specific metrics and time frames. Choose which metrics to display, allowing you to concentrate on the aspects that matter most to you.
Interactive Metrics Table: A user-friendly metrics table provides a quick overview of key values, including average metrics, enabling you to grasp the financial health of your asset at a glance.
Color-Coded Clarity: The indicator employs color-coded visualizations, making it easy to identify bullish and bearish trends, helping you make rapid and informed decisions.
🛠️ How to Use:
Symbol Selection: Choose your base symbol and preferred data source for analysis.
Risk-Free Rate: Input your risk-free rate to fine-tune calculations.
Length Customization: Adjust the lengths for different metrics to align with your analysis preferences.
Whether you're a seasoned trader or just stepping into the financial world, the Quantitative Risk Navigator empowers you to make strategic decisions by providing a comprehensive view of your asset's risk and return profile. Stay in control of your investments with this powerful financial GPS.
🚀 Start Navigating Your Financial Journey Today!
Rolling Risk-Adjusted Performance RatiosThis simple indicator calculates and provides insights into different performance metrics of an asset - Sharpe, Sortino and Omega Ratios in particular. It allows users to customize the lookback period and select their preferred data source for evaluation of an asset.
Sharpe Ratio:
The Sharpe Ratio measures the risk-adjusted return of an asset by considering both the average return and the volatility or riskiness of the investment. A higher Sharpe Ratio indicates better risk-adjusted performance. It allows investors to compare different assets or portfolios and assess whether the returns adequately compensate for the associated risks. A higher Sharpe Ratio implies that the asset generates more return per unit of risk taken.
Sortino Ratio:
The Sortino Ratio is a variation of the Sharpe Ratio that focuses specifically on the downside risk or volatility of an asset. It takes into account only the negative deviations from the average return (downside deviation). By considering downside risk, the Sortino Ratio provides a more refined measure of risk-adjusted performance, particularly for investors who are more concerned with minimizing losses. A higher Sortino Ratio suggests that the asset has superior risk-adjusted returns when considering downside volatility.
Omega Ratio:
The Omega Ratio measures the probability-weighted ratio of gains to losses beyond a certain threshold or target return. It assesses the skewed nature of an asset's returns by differentiating between positive and negative returns and assigning more weight to extreme gains or losses. The Omega Ratio provides insights into the potential asymmetry of returns, highlighting the potential for significant positive or negative outliers. A higher Omega Ratio indicates a higher probability of achieving large positive returns compared to large negative returns.
Utility:
Performance Evaluation: Provides assessment of an asset's performance, considering both returns and risk factors.
Risk Comparison: Allows for comparing the risk-adjusted returns of different assets or portfolios. Helps identify investments with better risk-reward trade-offs.
Risk Management: Assists in managing risk exposure by evaluating downside risks and volatility.

Cobra's CryptoMarket VisualizerCobra's Crypto Market Screener is designed to provide a comprehensive overview of the top 40 marketcap cryptocurrencies in a table\heatmap format. This indicator incorporates essential metrics such as Beta, Alpha, Sharpe Ratio, Sortino Ratio, Omega Ratio, Z-Score, and Average Daily Range (ADR). The table utilizes cell coloring resembling a heatmap, allowing for quick visual analysis and comparison of multiple cryptocurrencies.
The indicator also includes a shortened explanation tooltip of each metric when hovering over it's respected cell. I shall elaborate on each here for anyone interested.
Metric Descriptions:
1. Beta: measures the sensitivity of an asset's returns to the overall market returns. It indicates how much the asset's price is likely to move in relation to a benchmark index. A beta of 1 suggests the asset moves in line with the market, while a beta greater than 1 implies the asset is more volatile, and a beta less than 1 suggests lower volatility.
2. Alpha: is a measure of the excess return generated by an investment compared to its expected return, given its risk (as indicated by its beta). It assesses the performance of an investment after adjusting for market risk. Positive alpha indicates outperformance, while negative alpha suggests underperformance.
3. Sharpe Ratio: measures the risk-adjusted return of an investment or portfolio. It evaluates the excess return earned per unit of risk taken. A higher Sharpe ratio indicates better risk-adjusted performance, as it reflects a higher return for each unit of volatility or risk.
4. Sortino Ratio: is a risk-adjusted measure similar to the Sharpe ratio but focuses only on downside risk. It considers the excess return per unit of downside volatility. The Sortino ratio emphasizes the risk associated with below-target returns and is particularly useful for assessing investments with asymmetric risk profiles.
5. Omega Ratio: measures the ratio of the cumulative average positive returns to the cumulative average negative returns. It assesses the reward-to-risk ratio by considering both upside and downside performance. A higher Omega ratio indicates a higher reward relative to the risk taken.
6. Z-Score: is a statistical measure that represents the number of standard deviations a data point is from the mean of a dataset. In finance, the Z-score is commonly used to assess the financial health or risk of a company. It quantifies the distance of a company's financial ratios from the average and provides insight into its relative position.
7. Average Daily Range: ADR represents the average range of price movement of an asset during a trading day. It measures the average difference between the high and low prices over a specific period. Traders use ADR to gauge the potential price range within which an asset might fluctuate during a typical trading session.
Utility:
Comprehensive Overview: The indicator allows for monitoring up to 40 cryptocurrencies simultaneously, providing a consolidated view of essential metrics in a single table.
Efficient Comparison: The heatmap-like coloring of the cells enables easy visual comparison of different cryptocurrencies, helping identify relative strengths and weaknesses.
Risk Assessment: Metrics such as Beta, Alpha, Sharpe Ratio, Sortino Ratio, and Omega Ratio offer insights into the risk associated with each cryptocurrency, aiding risk assessment and portfolio management decisions.
Performance Evaluation: The Alpha, Sharpe Ratio, and Sortino Ratio provide measures of a cryptocurrency's performance adjusted for risk. This helps assess investment performance over time and across different assets.
Market Analysis: By considering the Z-Score and Average Daily Range (ADR), traders can evaluate the financial health and potential price volatility of cryptocurrencies, aiding in trade selection and risk management.
Features:
Reference period optimization, alpha and ADR in particular
Source calculation
Table sizing and positioning options to fit the user's screen size.
Tooltips
Important Notes -
1. The Sharpe, Sortino and Omega ratios cell coloring threshold might be subjective, I did the best I can to gauge the median value of each to provide more accurate coloring sentiment, it may change in the future.
The median values are : Sharpe -1, Sortino - 1.5, Omega - 20.
2. Limitations - Some cryptos have a Z-Score value of NaN due to their short lifetime, I tried to overcome this issue as with the rest of the metrics as best I can. Moreover, it limits the time horizon for replay mode to somewhere around Q3 of 2021 and that's with using the split option of the top half, to remain with the older cryptos.
3. For the beginner Pine enthusiasts, I recommend scimming through the script as it serves as a prime example of using key features, to name a few : Arrays, User Defined Functions, User Defined Types, For loops, Switches and Tables.
4. Beta and Alpha's benchmark instrument is BTC, due to cryptos volatility I saw no reason to use SPY or any other asset for that matter.

Crypto Portfolio ManagementCrypto Portfolio Management
This is an indicator not like the other ones that you regularly see in tradingview. The main difference is that this indicator does not plot a value for each candle bar like you would see with RSI or MACD. Actually it is table and it just uses tradingview great database of assets to plot some valuebale information that can not be found elsewhere easily. These metrics are some basic one that is used by portfolio managers to decide what they want to hold in their portfolio. The basic idea is that you should hold assets in your basket that are less correlated to the benchmark.
Benchmark in traditional context refers to main market indices like S&P 500 of US market. But they already have a lot of tools available. My effort was for crypto investors who are trying to rebalance their portfolio every month or week to have some good metrics to make decision. Because of this I used Bitcoin as crypto market benchmark. So, everything is compared to bitcoin in this script. I’m gonna explain the terms that is used in the table’s columns below.
MAKE SURE YOU PUT YOUR CHART AT DAILY AND AT THE MAXIMUM AVAILABLE DATA EXCHANGE.
Y-Exp
This is yearly expected return of the asset. It is simply the mean of the yearly returns of the asset. (these calculations are not typical in Tradingview because mainly we calculate on each bar and give value at the same bar but here this value to change once a year). Remember that the higher this value is the better it is because historically the asset have shown good returns but there is a tip: Always check the available historical data in any asset that you are adding if you add an asset that has only 1 year of data available or you use an exchange data that recently added the coin you will get unsignificant results and the results can not be trusted. You should always selects coins and market (coins can be changed in setting) that have the largest data available.
Y-SDev
This is a little bit complicated than the previous. This is the standard deviation of the yearly returns. This is a classic measure of RISK in financial markets. The higher the value, the more risk is involved with the asset that you have added. If you added two assets that have same returns but different Standard deviations, the rational thinker should choose the asset with lower Standard deviation.
The standard deviation is a good place to start but there are some considerations to have -it is getting complicated and average user should not be involved with these terms and can ignore the next phrases- standard deviation and mean of the yearly returns are random variables, these variables have a theoretical probability density function and these functions are not gaussian normal distribution. Because of this in the professional usage these returns should be transformed to a normal distribution and have all these terms calculated there and then transform back to its own normal state and then be used for any serious investment decision. I think these calculations can be done on Tradingview but I need you support to do this in the form of like and share of my scripts and ideas.
M-Exp and M-SDev
These terms are like the previous ones but it is calculated on monthly returns. As it goes for yearly return, the monthly returns change once a monthly candle closes. So be patient to use this indicator.
I highly recommend not to make decisions on monthly data due to a lot of noise involved with this market but in long run it is ok. So go with yearly returns and wait at least for 3 years to see your results.
CorToBTC
Basically you want to buy something that is less correalted with the benchmark. this is the correlation of the asset to bitcoin.
Sharpe Ratio
This is one of the most used metric as a risk adjusted return measurment. you can google it for more information. The higher this value the better. remmeber with any invenstment it is important to understand risks associated with the assets that you are buying.
DownFromATH
This metric that I didn't see anywhere in the tradingview and is familiar in the platforms like coinmarketcap. this is a real calculation of precentage down from ATH (All Time High). it means how much percentage a coin is down from the maximum price that the asset has experienced until now.
***
Remember you can change all the asset except main asset. If you like this script to 500 I will update this continuously.

Linear Regression Relative Strength[image/x/iZvwDWEY/
Relative Strength indicator comparing the current symbol to SPY (or any other benchmark). It may help to pick the right assets to complement the portfolio build around core ETFs such as SPY.
The general idea is to show if the current symbol outperforms or underperforms the benchmark (SPY by default) when bought some certain time ago. Relative performance is displayed as percent and is calculated for three different time ranges - short (1 mo by default), mid (1 quarter), and long (half a year). To smooth the volatility, the script uses linear regression to estimate the trend and takes the start and the end points of the linear regression line to compute the relative strength.
It is important to remember that the script shows the gain relative to SPY (or other selected benchmark), not the asset's gain. Therefore, it may indicate that the asset is profitable, but it still may lose value if SPY is in downtrend.
Therefore, it is crucial to check other indicators before making a decision. In the example above, standard linear regression for one quarter is used to indicate the direction of the trend.

Intra Sharpe RatioThis script calculates sharpe ratio in runtime. Useful for intraday decisions when you need confirmation about the risk/reward of the asset. Enjoy!