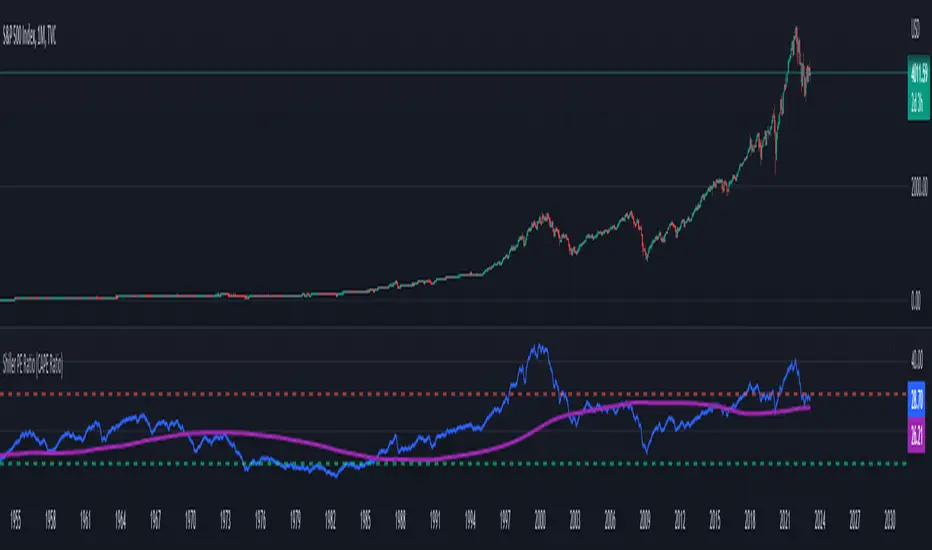
S&P 500 & Normalized CAPE Z-Score AnalyzerThis macro-focused indicator visualizes the historical valuation of the U.S. equity market using the CAPE ratio (Shiller P/E), normalized over its long-term average and standard deviations. It helps traders and investors identify overvaluation and undervaluation zones over time, combining both statistical signals and historical context.
💡 Why It’s Useful
This indicator is ideal for macro traders and long-term investors looking to contextualize equity valuations across decades. It helps identify statistical extremes in valuation by referencing the standard deviation of the CAPE ratio relative to its long-term mean. The overlay of S&P 500 price with valuation zones provides a visual confirmation tool for macro decisions or timing insights.
It includes:
✅ Three display modes:
-S&P 500 (color-coded by CAPE valuation zone)
-Normalized CAPE (vs. long-term mean)
-CAPE Z-Score (standardized measure)
🎯 How to Interpret
Dynamic coloring of the S&P 500 price based on CAPE valuation:
🔴 Z > +2σ → Highly Overvalued
🟠 Z > +1σ → Overvalued
⚪ -1σ < Z < +1σ → Neutral
🟢 Z < -1σ → Undervalued
✅ Z < -2σ → Strong Buy Zone
-Live valuation label showing the current CAPE, Z-score, and zone.
-Macro event shading: major historical events (e.g. Great Depression, Oil Crisis, Dot-com Bubble, COVID Crash) are shaded on the chart for context.
✅ Built-in alerts:
CAPE > +2σ → Potential risk zone
CAPE < -2σ → Potential opportunity zone
📊 Use Cases
This indicator is ideal for:
🧠 Macro traders seeking long-term valuation extremes.
📈 Portfolio managers monitoring systemic valuation risk.
🏛️ Long-term investors timing strategic allocation shifts.
🧪 How It Works
CAPE ratio (Shiller PE) is retrieved from Quandl (MULTPL/SHILLER_PE_RATIO_MONTH).
The script calculates the long-term average and standard deviation of CAPE.
The Z-score is computed as:
(CAPE - Mean) / Standard Deviation
Users can switch between:
S&P 500 chart, color-coded by CAPE valuation zones.
Normalized CAPE, centered around zero (historic mean).
CAPE Z-score, showing statistical positioning directly.
Visual bands represent +1σ, +2σ, -1σ, -2σ thresholds.
You can switch between modes using the “Display” dropdown in the settings panel.
📊 Data Sources
CAPE: MULTPL/SHILLER_PE_RATIO_MONTH via Quandl
S&P 500: Monthly close prices of SPX (TradingView data)
All data updated on monthly resolution
This is not a repackaged built-in or autogenerated script. It’s a custom-built and interactive indicator designed for educational and analytical use in macroeconomic valuation studies.
Shillerpe
CAPE / Shiller PE RatioThe CAPE (Cyclically Adjusted Price-to-Earnings) or Shiller PE ratio is a popular valuation measure used by investors to assess whether a stock or index is over or undervalued relative to its historical earnings. Unlike the traditional P/E ratio, the CAPE ratio smooths earnings over ten years, adjusting for inflation and providing a more stable and long-term view of valuation.
This indicator lets you quickly calculate and visualize the CAPE ratio for any stock on TradingView, helping you make informed decisions about the sustainability of current price levels. With its clear presentation and intuitive setup, you can compare historical CAPE levels and identify potential opportunities for long-term investments or avoid overvalued markets.
Advantages of the CAPE Ratio:
Long-Term Focus : Smooth earnings over ten years, reducing the impact of short-term volatility.
Inflation-Adjusted : Provides a more precise, inflation-adjusted valuation measure over time.
Historical Comparison : Allows for benchmarking against long-term historical averages.
Market Sentiment Indicator : Can highlight overvalued or undervalued markets for long-term investors.
Reduces Noise : Filters out short-term earnings fluctuations, offering a more stable view.
Disadvantages of the CAPE Ratio:
Ignores Recent Earnings : Misses short-term earnings changes, which can affect current valuations.
Outdated Data : Relies on old earnings data that may not reflect recent company performance.
Less Effective for Growth Stocks : May undervalue high-growth stocks focused on future earnings.
Sector Limitations : Works best for broad markets, less so for fast-changing industries.
Debated Predictive Power : It’s unreliable for timing short-term market movements.
In short, the CAPE ratio is excellent for long-term valuation but has limitations for short-term or growth-focused investing.
Disclaimer
Please remember that past performance may not be indicative of future results.
Due to various factors, including changing market conditions, the strategy may no longer perform as well as in historical backtesting.
This post and the script don’t provide any financial advice.
Normalized SP100/SP400 Ratio with Shiller PE Ratio (CAPE Ratio)This indicator is designed to observe market concentration and overall valuation by combining the Shiller CAPE Ratio with the SP100/SP400 ratio.
Blue Line: Represents the Shiller CAPE Ratio, which reflects the overall market valuation.
Yellow Line: Represents the SP100/SP400 ratio, which indicates market concentration.
The combination of these two metrics provides insight into market dynamics. Historically, on the SPX monthly chart, when the yellow line (SP100/SP400 ratio) crosses below the blue line (CAPE Ratio), it has been followed by a period of stock market gains.
Justification for Combination:
The Shiller CAPE Ratio is a widely recognized indicator of market valuation, providing a long-term perspective on whether the market is overvalued or undervalued. The SP100/SP400 ratio, on the other hand, measures the concentration of the market by comparing the largest 100 companies to the next 400 mid-sized companies.
By normalizing both metrics and analyzing their relationship, this script provides a unique perspective on market movements. The crossunder of the SP100/SP400 ratio below the CAPE Ratio may signal a shift in market sentiment or concentration, often leading to potential market rallies. This combination is not just a simple merger of indicators but rather a thoughtful integration that adds value by highlighting periods where market concentration and valuation dynamics align.
Shiller PE Ratio (CAPE Ratio) [WhaleCrew]Our Implementation of the famous Shiller PE Ratio (aka C yclically A djusted P rice-to- E arnings Ratio) a long-term valuation indicator for the S&P 500.
Calculation: Share price divided by 10 - year average, inflation - adjusted earnings
The indicator works on the M and 12M timeframe and has a built-in moving average that supports an upper and lower bollinger band.
SHILLER_PE_RATIO_MONTHDISCRIPTION
Shiller PE ratio for the S&P 500. Price earnings ratio is based on average inflation-adjusted earnings from the previous 10 years, known as the Cyclically Adjusted PE Ratio (CAPE Ratio)
TIME FRAME
1M
HOW TO USE
It provide historic Shiller PE which will provide over-bought or over-sold condition historically from 19th century.
MODIFICATION
When the pe ratio crosses 30 considered as Greed
When the pe ratio fall below 15 considered as Fear