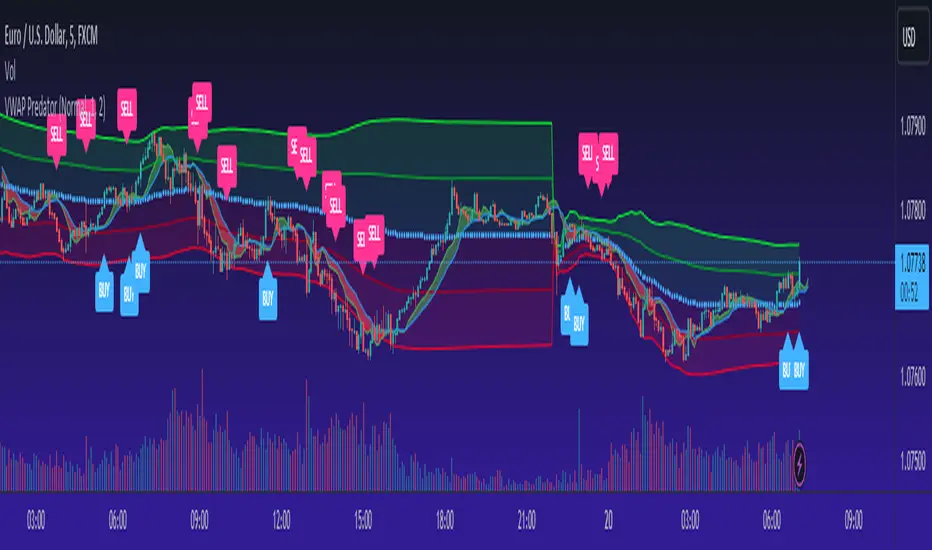
VWAP PredatorUsing VWAP as a start point, the VWAP Predator uses proprietary Fibonacci bands to help determine signal criteria. Most traders use VWAP in a simple way to determine whether an instrument is in a bearish or bullish state, but that doesn't help choosing the correct time to go long or short.
The xBat VWAP Predator uses behavioural analysis with volume, price action with open and close proximities to the Fibonacci bands/zones (Fib Zones). The following describes how the xBrat VWAP Predator is different to any standard use of Volume Weighted Average Price and uses xBrat Proprietary Behavioural logic to determine high probability long and Short signals. All of this heavy lifting and logic is done behind the scenes, keeping traders charts clean.
Long Trading Signals - Candle Coloured in Blue - There are many states with the logic to produce these signals, which are briefly described below:
1. The only standard criteria here - The price action must be above the VWAP Line
2. The Price must open below the boundary of one Fib Zone and close into the next Fib Zone
3. That Same Candle has to be an Accumulation Candle (more volume than the preceding candle and More Buyers) - This is determined with our proprietary logic coding
4. The Same signal candle also has to be higher than average volume. Again, our proprietary xBrat Logic just doesn't look back over a set number of bars, it looks at times of day and day of week, plus more to determine a true valuation of higher, lower or equal to average volume.
5. Only when these states are met, plus two more ema proximity logic, Does the xBrat VWAP predator give a Long Signal.
6. Trade Management is either set targets or indeed a simple ema cross which we provide as a ribbon on the chart to help traders. These ema's are different to entry logic. When the Ribbon turns from green to red, the trader should consider exiting the trade
Short Trading Signals - Candle Coloured in Pink - There are many states with the logic to produce these signals, which are briefly described below:
1. The only standard criteria here - The price action must be below the VWAP Line
2. The Price must open above the boundary of one Fib Zone and close into the next Fib Zone
3. That Same Candle has to be a Distribution Candle (more volume than the preceding candle and More Sellers) - This is determined with our proprietary logic coding
4. The Same signal candle also has to be higher than average volume. Again, our proprietary xBrat Logic just doesn't look back over a set number of bars, it looks at times of day and day of week, plus more to determine a true valuation of higher, lower or equal to average volume.
5. Only when these states are met, plus two more ema proximity logic, Does the xBrat VWAP predator give a Short Signal.
6. Trade Management is either set targets or indeed a simple ema cross which we provide as a ribbon on the chart to help traders. These ema's are different to entry logic. When the Ribbon turns from red to green, the trader should consider exiting the trade.
VWAP Predator is a day trading and scalping signals trading indicator.
Signals
MAGISTR Binary 3 EURUSD 1min The indicator is designed for use in binary options trading.
Designed for TF 1 minute, EURUSD pair (tested on Currency.com exchange instrument).
When the rules of the internal algorithm are triggered, the indicator generates a signal with the probable movement of the instrument on the next bar:
if a green bar appears at the bottom of the bar, it means that the indicator assumes that the next bar should close at a positive price growth value (it will be green) and vice versa, if a red bar appears at the bottom of the bar, then the indicator assumes that the next bar should close at a negative price growth value( will be red), the indicator also generates appropriate alerts about the expected price movement on the next bar.
In addition, the indicator counts the signals issued by it and the success of its processing for the period of time available in TradingView.
This indicator uses a set of values of such basic indicators as:
- Stochastic RSI;
- Bollinger Bands;
- Profile of Volumes;
- CCI;
- ADX;
- momentum;
and others.
I left all the settings "open", so it is quite possible, by slightly changing the parameters, to adjust it to another pair or time frame.
==========================================================================================================================
Индикатор разработан для применения в торговле на бинарных опционах.
Разработан для ТФ 1 минута, пара EURUSD (оттестирован на показателях инструмента биржи Currency.com).
При сработке правил внутреннего алгоритма - индикатор выдает сигнал с вероятным движением инструмента на следующем баре :
если появилась зеленая полоса внизу бара - значит индикатор предполагает, что следующий бар должен закрыться в положительном значении роста цены ( будет зеленым) и наоборот, если появилась красная полоса внизу бара - значит индикатор предполагает, что следующий бар должен закрыться в отрицательном значении роста цены( будет красным) , также индикатор выдает соответствующее оповещения о предполагаемом им движении цены на следующем баре.
Кроме того индикатором ведется подсчета выданных им сигналов и и успеха его отработки за доступный в TradingView период времени.
В данном индикаторе используются комплекс значений таких базовых индикаторов, как:
- Stochastic RSI;
- Bollindgers Bands;
- Profile of Volumes;
- CCI ;
- ADX;
- Momentum ;
и прочие.
Все настройки оставил "открытыми", так что его вполне можно, немного изменив параметры, подстроить под другую пару или тайм-фрейм.

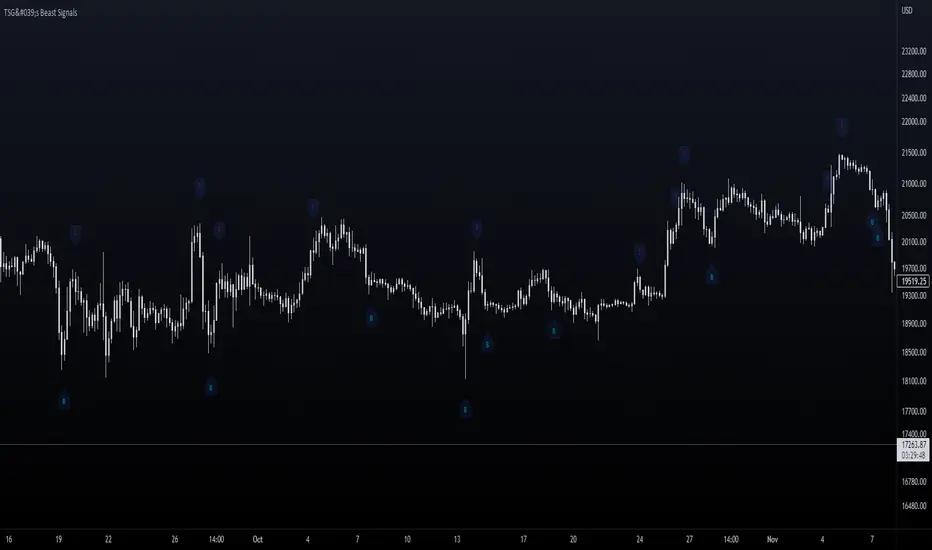
TSG's Beast SignalsThis indicator is built with the purpose of keeping things simple and user-friendly. It is a custom formula I developed lately and it signals pretty accurately changes of direction in the price.
Added an Alert option to it lately - with customizable messages.
_____________________________________________________
_____________________________________________________
HOW IT IS DONE
I make great use of the Average True Range indicator which is the best and simple volatility indicator out there and mix its behavior with several Moving Averages to catch exhaustions of trends and potential reversal points. Moving Averages are treated as bands and the price is kept within it (Something like Bollinger Bands , but custom).
_____________________________________________________
_____________________________________________________
WHAT TIMEFRAMES TO USE IT ON
The bigger the timeframe, the less noise you will have. It is playing out nicely to signal major trend reversal or retracements, but I used it for scalping aswell.
_____________________________________________________
_____________________________________________________
PLANS
Maybe MultiTimeframe table to align signals coming from different timeframes for better accuracy of entry?
Good Luck!
Colorful Channelwhat is "Colorful Channel"?
it is a overbought - oversold indicator.
what it does?
It fills the area between the upper band of the channel and the price line with green, the area between the lower band of the channel and the price line with red color and applies a transparency to these colors according to the distance of the price from the channel lines. thus allowing users to get an idea of ??the current value of the price.
how it does it?
subtracts the percentage of the price from the lower channel from the transparency ratio of the red color, and the percentage of the price from the upper band from the transparency ratio of the green color. thus, a different transparency value is obtained for each percentile. In addition, the transparency rate can be changed with a multiplier determined by the users.
how to use it?
In the "lenght" section, you select the number of bars that the indicator will base backwards on. For example, if length=100, the indicator determines the upper and lower bands according to the distances from the highest and lowest values ??within 100 bar. so the length part works like donchian channels.
You can change the transparency ratio of the colors in the "transp" section.
1 saat transp
yan trend
4 saat

Q-TrendQ-Trend is an multipurpose indicatorm that can be used for swing- and trend-trading equally on any timeframe (non-volatile markets are better for this thing).
Settings:
Trend period - used to calculate trend line in the special moments(will explain below);
ATR Multiplier - changes sensitivity. The higher the multiplier = the more sensitive it is.
Also option to smooth source data (helps get cleaner signals, as always).
How to use?
Signals are given on the chart. Also ou can use trend line as S/R line.
The idea behind:
Terms:
SRС = Source
TL = trend line;
MP = ATR multiplier;
ATR = ATR :)
TL = (highest of source P-bars back + lowest of source P-bars back) / 2
Epsilon = MP * ATR
I was thinking for a week about combining volatility and relation between highest and lowest price point. That why I called indicator Q-Trend = Quantitative Trend , as I was trying to think about price in a mathematical way.
Okay, time to go philosophical:
1) TL is shows good price trend, but as it is slow enough and not enough informative, we need add additional conditions to produce signals.
2) Okay, so what can we add as conditions? We need to take volatility into account, as it is crucial in the moments of market uncertainty. So let's use ATR (Average True Range) somehow. My idea is that if SRC breaks TL + ATR , then it means that there will be upmove and we update our TL . Analogically for SRC breaking TL - ATR (breaks are crosses of TL +- ATR lines) .
Conclusion:
- if SRC breaks TL + ATR , it is a BUY signal and update of trend line;
- if SRC breaks TL - ATR , it is a SELL signal and update of trend line;
I think that such indicator already exisits on TradingView, as I've already saw something similar, but long ago, so please don't report, if such thing already exists.
But if not, then I hope, that you will gain some profits with Q-Trend :)
I will continue my work on this thing, so stay tuned.
Trade with your own risks and have your profits!
Wish you all the best!
- Tarasenko Fyodor

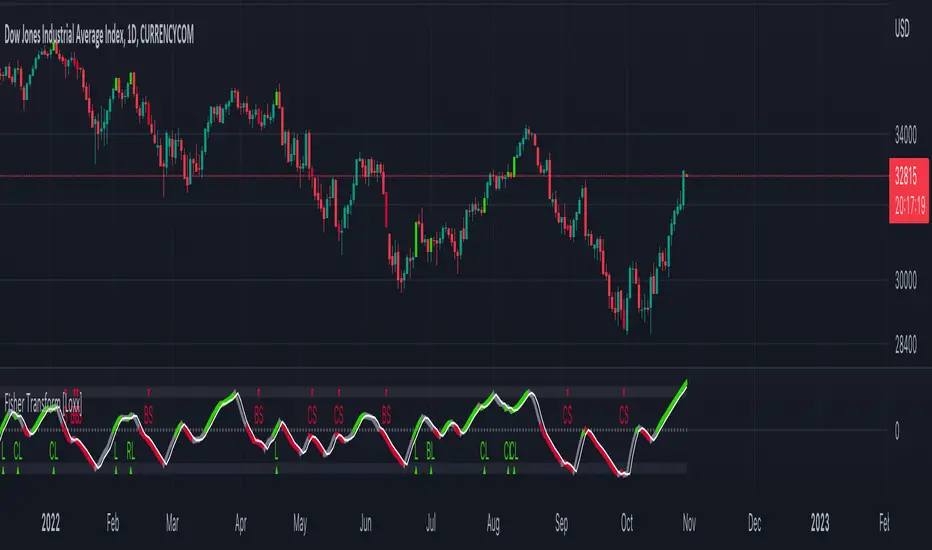
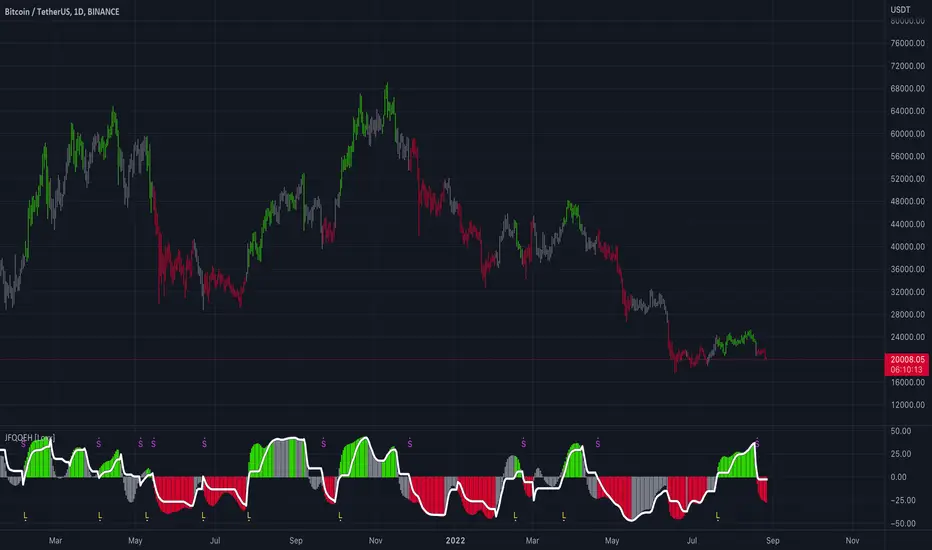
Fisher Transform [Loxx]The Fisher Transform is a technical indicator created by John F. Ehlers that converts prices into a Gaussian normal distribution. The indicator highlights when prices have moved to an extreme, based on recent prices. This may help in spotting turning points in the price of an asset.
What's different between this and regular Fisher Transform?
This version of Fisher Transform morphs the original Fisher Transform concept into a high-powered trading tool that works for all asset classes and all timeframes. There are 1000s of potential combinations of signal output between source selection and filtering preferences. Additional sources, volatility types, and moving averages will be added over time in future releases.
Sources
Loxx's Expanded Source Types enabling ~100 variations of source input including all Heikin Ashi and Better Heikin Ashi types. See here for more information here:
Signals
Initial Long "L": Zero-line or trigger/signal cross-up
Initial Short "L": Zero-line cross-down or trigger/signal cross-down
Continuation Long "CL": When price is in uptrend, cross-up trigger over signal
Continuation Short "CS": When price is in downtrend, cross-down trigger under signal
Post Baseline Cross Long "BL": When trigger and signal cross-up over zero-line but Baseline is still in downtrend, then if Baseline finally turns to uptrend within XX bars, then long
Post Baseline Cross Short "BS": When trigger and signal cross-down under zero-line but Baseline is still in uptrend, then if Baseline finally turns to downtrend within XX bars, then short
Long Exit "LX": When trigger is over XX boundary and trigger crosses down signal
Short Exit "SX": When trigger is under XX boundary and trigger crosses up signal
Filters
Baseline filter
41 Different moving averages to choose from including moving averages including Loxx's Moving Averages. See here for more information on included moving averages:
If the Baseline filter is turned on, the Post Baseline Cross signals are activated. For all Baseline types, the trigger is close, the signal is the moving average. If the trigger is above the signal, price is in an uptrend, if trigger is below the signal, price is in a downtrend. When this selected, the trend of the baseline must match the trend of the Fisher Transform for the signal to be valid.
Volatility filter
Volatility : If price crosses the baseline, we check to see how far it has moved in terms of multiples of volatility denoted in price ( volatility in price x multiple). If price has moved by at least "Qualifier multiplier" and less than "Range Multiplier", then, assuming other factors align in one direction, then a signal is printed
Volatility Types
v1.0 Included Volatility
Average True Range (ATR)
True Range Double (TRD)
Alerts
Includes alerts for all signal types listed above
UI Options
5 color schemes
5 trend coloring schemes
Ability to turn signals on/off
Fisher Transform Backtest
ATR - Average True Range + Dynamic Trend w/ Signals | by Octopu$↕ ATR - Average True Range + Dynamic Trend w/ Signals | by Octopu$
What is ATR?
ATR stands for Average True Range
A Technical Analysis Indicator that measures market volatility by decomposing the range of a Security Price in a specific period.
The ATR can be used as a High Low Spectrum,
As well as a variation of a Moving Average, considering the ranges on a timeframe, generally this being 14 days.
Shorter periods can be used (will generate more signals) or longer periods for steadier trends (for fewer signals)
A ticker on a high volatility has a high ATR.
A ticker on a low volatility has a low ATR.
It is an useful resource for a trading system:
Can be used to enter or exit trades and/or also measure the daily spectrum of a stock.
Does not necessarily points price direction, but takes into account gaps and strong legs.
Can also be used as trading positions confirmation,
Rather be it for stop losses or take profits,
As well as setting trailing stops or limit orders.
This tool offers a great Risk to Reward Ratio, considering the fact you will be aware of the possible moves that an asset can perform.
This indicator should not be used as a standalone tool.
(The combination of factors relies on your own knowledge about Confluence Factors along with your Due Diligence)
This indicator is not an advice to buy or sell securities.
www.tradingview.com
SPY
ANY Ticker. ANY Timeframe.
(Used SPY 5m as Example only)
Features:
• ATR ( Average True Range )
• Range UP and DOWN
• Movement from Price Line
• Dynamic ATR
• Cross/Test Signals
• Live and Last Close
Options:
• Specific Factors Setup
• Length Customization
• Toggle On/Off
• Color PIcker
• Styling Options
Notes:
v1.0
Indicator release.
Changes and updates can come in the future for additional functionalities or per requests. Follow and Stay Tuned!
Did you like it? Please Support and Shoot me a message! I'd appreciate if you dropped by to say thanks! Thank you.
- Octopu$
🐙

Moving Grid Trader - With AlertsThis script used a grid system that is set when a "buy" signal is sent to generate profits inside of a range. This script used macd to weed out bad buys and then sells once the price either reaches the grid - or hits the stoploss. This works best in bullish and ranging markets.

TMO ArrowsTMO - (T)rue (M)omentum (O)scillator) MTF Arrows
Do you want to use TMO but you lack space on the chart? This study is just for you. This is the more user-friendly version of the TMO Oscillator. In terms of the indicator there are no changes except the indicator is converted in to the simple arrows.
There are Four Types of Arrows:
1. TMO Arrow Up - Visualizes the TMO bullish crosses.
2. TMO Arrow Down - Visualizes the TMO bearish crosses.
3. TMO Arrow Up (Oversolds Only) - Visualizes only the bullish crosses that are at or below the oversold zone.
4. TMO Arrow Down (Overboughts Only) - Visualizes only the bearish crosses that are at or above the overbought zone.
In case you only want the arrows for extremes, turn off the Arrow Up / Arrow Down first. Arrows for extremes only are turned off by default.
Hope it helps.

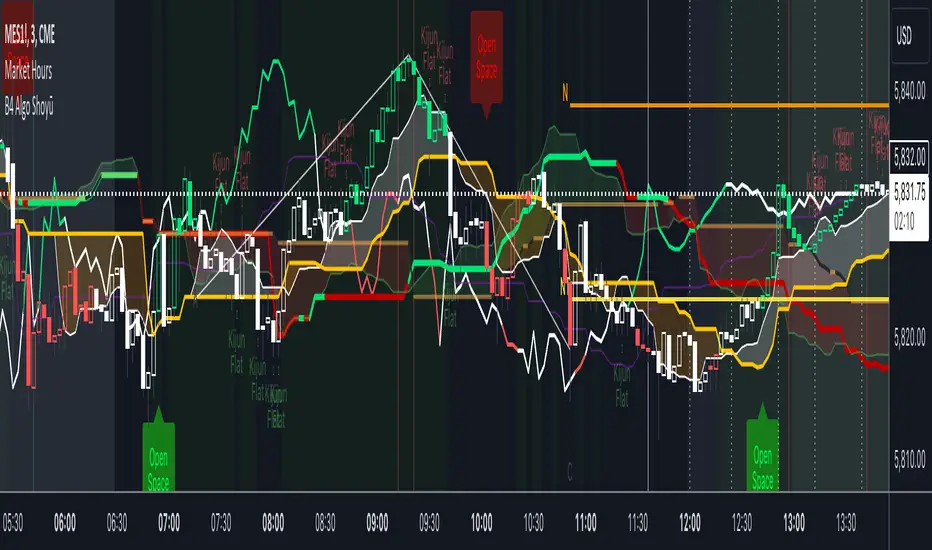
B4Signals Ichimoku Premium Addon ShoyūThis indicator is based on "Ichimoku" with additional and useful features. It is designed to complement B4Signals Ichimoku as an add-on.
FEATURES
The indicator is mainly divided into 5 parts:
* Future Tenkan-sen, Kijun-sen & Kumo Lines: Tenkan-sen next 5 days projection, Kijun-sen next 10 days, Senko Span A next 5 days and Senko Span B next 14 days will be displayed to increase depth of your analysis and help forecast price movements.
* QualityLine + DirectionLine for determining beginning and end of trend as well as a visual to spot Kijun bounces and crosses.
* 9 /26 Tenke-sen/Kijun-sen pullback detection lines, “KISS Lines”, for better entries on pullbacks.
* Flat Kijun-sen signal to determine trend exhaustion and possible reversals.
* Open Space Chikou coloring and confirmation signal for Identifying momentum breakouts and spotting areas of projected consolidation.
* Ichimoku Hosoda Target Price Targets. Simply choose point A,B and C and have 4 Hosoda price targets appear on your chart.
The addition of these features provides traders with a collection of technical metrics capable of outlining directional trend momentum, proposed pullbacks and possible continuations in any financial market. Using multiple plots, this indicator plots a forecast where the Han-ne lines might travel in the future. The Direction line gives you a clear perspective of price in relation to the Kijun. While the Quality Line gauges the health or quality of the Kumo, helping determine entries and exits, while confirming pullbacks and areas of consolidation. The “KISS Lines” help identify Tenken-sen / Kijun-sen 9/26 pullbacks and the Kijun Flat alert signals you when trend exhaustion is identified by a flat Kijun-sen.
Another significant aspect of this indicator is that it identifies the Chikou Span reaching ‘Open Space' by coloring the Chikou Span's line giving you a signal as well. This can help traders identify the market’s dominant trend (bullish or bearish) and determine an appropriate time to enter/exit active positions.
Disclaimer
Copyright by B4Signals.
The information contained in our scripts/indicators/ideas does not constitute financial advice or a solicitation to buy or sell any securities of any type. We will not accept liability for any loss or damage, including without limitation any loss of profit, which may arise directly or indirectly from the use of or reliance on such information.
All investments involve risk, and the past performance of a security, industry, sector, market, financial product, trading strategy, or individual’s trading does not guarantee future results or returns. Investors are fully responsible for any investment decisions they make. Such decisions should be based solely on an evaluation of their financial circumstances, investment objectives, risk tolerance, and liquidity needs.
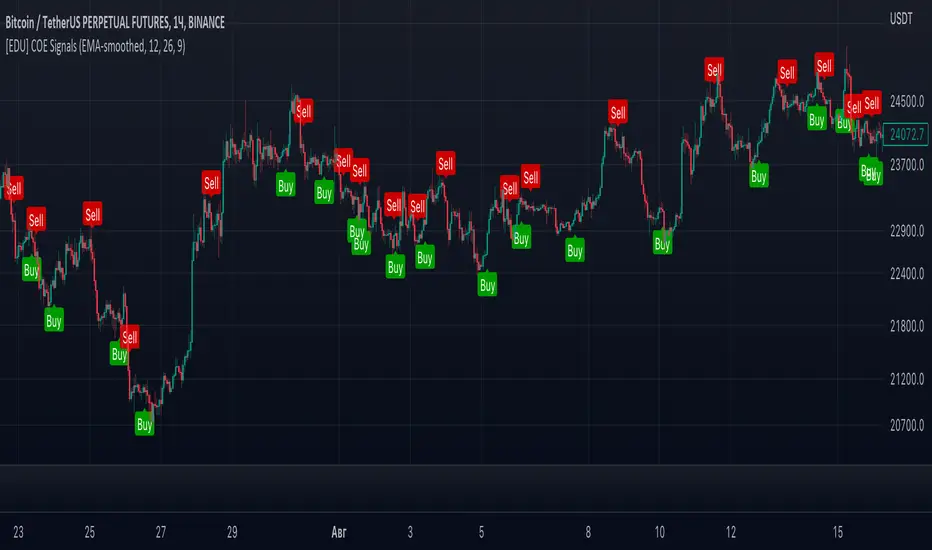
[EDU] Close Open Estimation Signals (COE Signals)EN:
Close Open Estimation ( aka COE ) is a very simple swing-trading indicator based on even simpler idea. This indicator is from my educational series, which means that I just want to share with another way to look at the market in order to broaden your knowledge .
Idea :
Let's take n previous bars and make a sum a of close - open -values of each bar. Knowledgeable of you may already see the similarity to RSI calculation idea . Now let's plot this sum and see what we have now.
We can see, that whenever COE crosses over 0-level, uptrend begins, and if COE crosses under 0-level, downtrend begins. The speed of such signals can be adjusted by changing lookback period: the lower the lookback, the faster signals you get, but high-quality ones can be obtained only via not-so-fast lookback as when the market is consolidating or volatility is to high, there can be many garbage signals, like 95+% of other indicators have.
Let's explore more and calculate volatility of COE(v_coe in the code): current COE - previous CEO .
Now it appears that when v_coe crosses over 0-level, it's a signal, that this is a new low and soon the uptrend will follow. Analogically for crossing under 0-level .
I guess now you understood what these all are about: COE crossings show global trend signals , while Volatility COE ( v_coe or VCOE ) crossings show reversal points .
For signals I further calculated volatility of VCOE(VVCOE) and then volatility of VVCOE(VVVCOE). Why? Because for me they seem to be more accurate, but you are welcome to experiment and figure best setups for yourself and by yourself, I just share my opinion and experience .
COE can be helpful only in high liquidity markets with good trend or wide sideways .
If you want to experiment with COE, just copy the code and play with it. Curious of you will probably find it helpful eventhough the idea is way too simple.
By it's perfomance COE can probably beat QQE at open price settings.
(use open of the price at indicator to get zero repaint! )
Examples :
If you any questions, feel free to DM me or leave comments.
Good luck and take your profits!
- Fyodor Tarasenko
RU:
Close Open Estimation ( aka COE ) — это очень простой индикатор свинг-трейдинга, основанный на еще более простой идее. Этот индикатор из моей образовательной серии, а это значит, что я просто хочу поделиться с другим взглядом на рынок , чтобы расширить ваши знания .
Идея :
Возьмем n предыдущих баров и составим сумму a из close - open -значений каждого бара. Знающие люди могут уже заметить сходство с идеей расчета RSI . Теперь давайте построим эту сумму и посмотрим, что у нас сейчас есть.
Мы видим, что всякий раз, когда COE пересекает выше 0-уровня, начинается восходящий тренд , а если COE пересекает ниже 0-уровня, начинается нисходящий тренд. Скорость таких сигналов можно регулировать изменением ретроспективы: чем меньше ретроспектива, тем быстрее вы получаете сигналы, но качественные можно получить только через не- такой быстрый взгляд назад, как когда рынок консолидируется или волатильность слишком высока, может быть много мусорных сигналов, как у 95+% других индикаторов.
Давайте рассмотрим больше и рассчитаем волатильность COE(v_coe в коде): текущий COE - предыдущий CEO .
Теперь кажется, что когда v_coe пересекает уровень 0, это сигнал о том, что это новый минимум и вскоре последует восходящий тренд . Аналогично для пересечения под 0-уровнем .
Думаю, теперь вы поняли, о чем все это: COE пересечения показывают глобальные сигналы тренда , а пересечения Volatility COE ( v_coe или VCOE ) показывают точки разворота .
Для сигналов я дополнительно рассчитал волатильность VCOE(VVCOE), а затем волатильность VVCOE(VVVCOE). Почему? Потому что для меня они кажутся более точными, но вы можете поэкспериментировать и подобрать оптимальные настройки для себя и для себя, я просто делюсь своим мнением и опытом .
COE может быть полезен только на рынках с высокой ликвидностью и хорошим трендом или широким боковиком .
Если вы хотите поэкспериментировать с COE, просто скопируйте код и поэкспериментируйте с ним. Любознательные из вас, вероятно, сочтут это полезным, хотя идея слишком проста.
По своей результативности СОЕ может составить конкуренцию широко известному QQE, используя open цены.
(используйте open цены на индикаторе, чтобы получить нулевую перерисовку! )
Примеры :
Если у вас есть вопросы, пишите мне в личные сообщения или оставляйте комментарии.
Удачи и профита всем!
- Федор Тарасенко
MTFT Actionable Signal Targets, TheStrat Suite (4of5)Multi Time Frame Tools
Multi Time Frame Tools (MTFT) is a suite of scripts aimed to establish a standard timeframe-based color scheme. This can be utilized to overlay different timeframes calculations/values over a single timeframe. As one example, this would allow to observe the 5-month moving average, 5-week moving average, and 5-day moving average overlaid over each other. This would allow to study a chart, get accustomed to the color scheme and study all these at the same time much easier.
All indicators calculated using the below specific timeframes as input, will always use the color scheme outlined below. This is to get you in habit of recognizing the different timeframes overlaid in top of each other. These can be personalized.
Longer TF analysis.
Yearly - Black
Semi-Annual - Yellow
Quarterly - White
Monthly - Maroon
Weekly - Royal Blue
Daily - Lime
Shorter TF analysis.
4 hour - Fuchsia
1 hour - Orange
30 min - Red
15 min - Brown
10 min - Purple
5 min - Lilac
All color coordination is able to be modified in either the “Inputs” or “Style” section. If you need to make changes, make sure to select “Save as Default” on the bottom right of the settings menu.
Recommended Chart Color Layout
I played around with color coordination a lot. The final product was what worked best for me. I personally use the following chart settings to accent all available TF colors.
-> Click on the settings wheel on your chart. -> Click on “Appearance”.
Background - Solid -> On the top row pick the 6th color from the left.
Vert Grid Lines and Horz Grid Lines -> On the top row pick the 7th color from the left.
You may of course change these and the indicator line colors as you like.
Adding indicator to Chart
-> Open the TradingView “Indicators & Strategies” library, the icon has “ƒx”. -> All premium scripts will be located under “Invite-Only Scripts” -> Click indicator to add to your chart.
MTFT TheStrat Suite (5 Scripts)
Rob Smith is the creator of ‘TheStrat’ trading strategy. For ‘TheStrat’ I have put together a suite of 5 premium scripts that combined will offer people interested in learning ‘TheStrat’ a cleaner learning process. For 2 of the 5 scripts specifically, the MTFT approach of overlaying multiple longer timeframes(TF) over a shorter TF selected as a display cannot be utilized. The other 2 scripts will have full MTFT functionality and they are my personal favorite. I will be providing very basic info to utilize this script; it is up to you to dive deep into learning this strategy. I am not an expert with the tool or a financial advisor. As with all aspects of life, I recommend you research, learn, discern and practice extensively in order to become a master.
1. MTFT Patterns Pro/Noob
2. MTFT Full Time Frame Continuity Table
3. MTFT Last HML wOpen
*4. MTFT Actionable Signal Targets
5. MTFT Reversal Lines
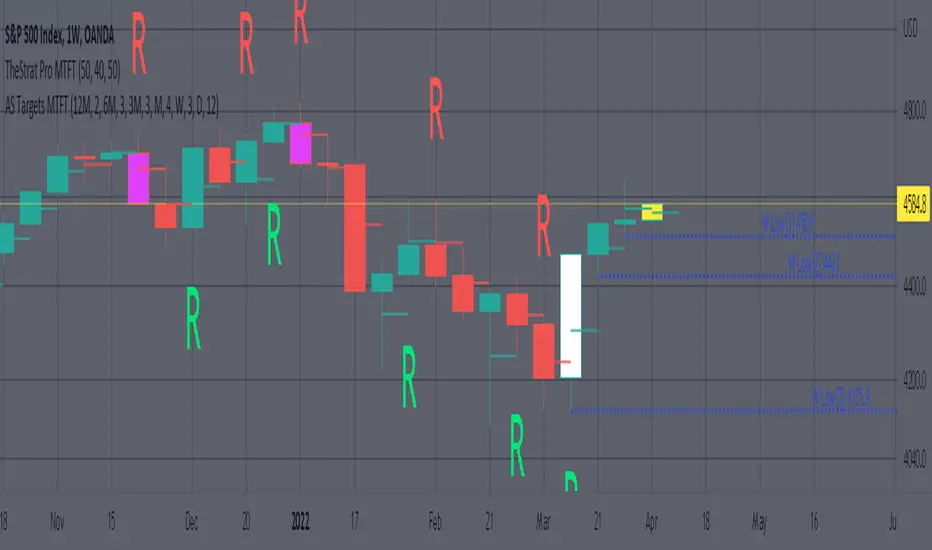
MTFT Actionable Signal Targets, TheStrat Suite (4of5)
Plots the previous highs/lows for the selected timeframe. Will not plot the high/low for a candlestick that is still active/open. You will have to manually Enable/Disable the high/low depending on the type of actionable signal that you are observing. Previous high/low lines will start from the near exact time that it opened so you can see exactly from what previous candlestick you are tracking each target.
Features includes:
1. Six Different Timeframes per script instance. Example below shows a weekly timeframe selected with a Shooting Star as the actionable signal that is being considered along with the past 3 lows for the Week timeframe being enabled. These would be your targets if you were to enter this SHORT trade. Keep in mind that every new week that opens the script will update to the newest 3 lows so if you are still inside a trade you might have to increase the number of past lines in order to keep an eye on the original targets. Which is why I selected 3 in this example, even if there is only 2 targets in mind.
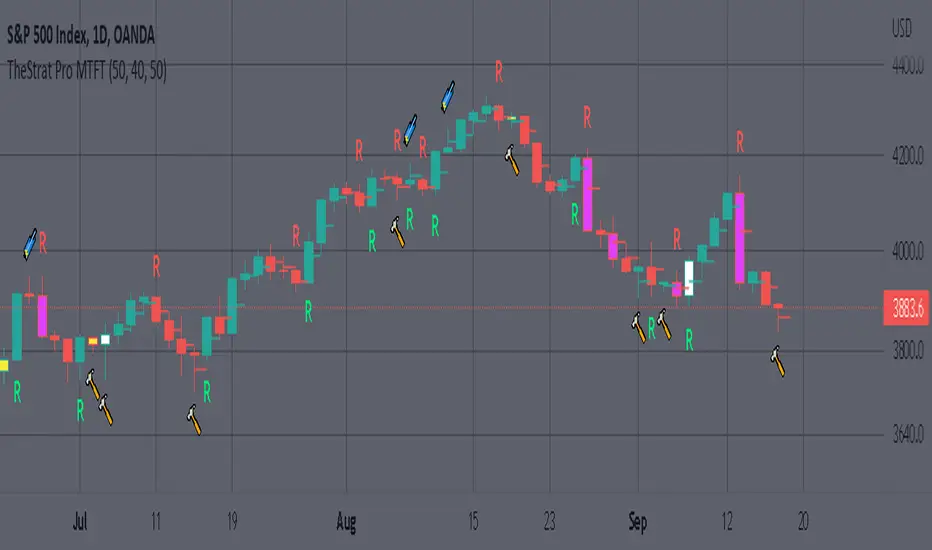
The script will allow you to observe how price moves after an actionable signal is triggered and as it approaches the targets on smaller timeframes. Here is the setup from above on a daily timeframe selected showing how priced moved to the targets. This is all based on Robs teachings, but broken down to better grasp how price moves between pivots.
2. 20 different TF to pick from per slot. Timeframes(TF) include: Yearly(Y), Semi-annually(S), Quarterly(Q), Monthly(M), 2-Week(2W), Weekly(W), 3-Day(3D), Daily(D), 12 hour, 8 hour, 6 hour, 4 hour, 3 hour, 2 hour, 1 hour, 30 min, 15 min, 10 min, 5 min. NOTICE: 2W, 3D, 2D, 12h, 8h, 6h, 3h, and 2h don’t have a supported color scheme as I do not personally use them. They are available to pick from in the timeframe selection and you can set a color for these timeframes under the “Unsupported Color Scheme” section in the settings menu for the script if you would like to use them.
3. Show exact price at the pivots. Since drawing lines vs plots doesn’t show the value in the price bar on the right side this setting will show the value of the targets. Image below shows an example of how this looks.
4. Auto-hide timeframes based on specific timeframes selected. For this script, I look for timeframes smaller than the selected timeframe and auto hide these. This applies to all timeframes. For example, in the above Weekly Shooting Star example. If I were to select the monthly timeframe it would hide this timeframe selected so would not show the weekly targets. In the higher timeframes these targets are irrelevant.
IMPORTANT NOTE: One of the lessons I would consider most important in attaining clarity regarding trading, is “TheStrat” by Rob Smith. His lesson on “actionable signals” is something that can be applied to any strategy. For this reason, I am including “MTFT TheStrat Patterns Pro” script in all images that will depict confluence for a better trade selection.
Example using TheStrat Pro MTFT with this indicator.
Look for a “TheStrat actionable signal” or a “TheStrat Reversal signal” on a smaller timeframe that has an instance of this indicator on a larger timeframe calculation that is in range of the candlestick that formed your actionable signal. This means that the indicators plot you are observing must be above the low and below the high of the candlestick that is the actionable signal/reversal signal. Image below shows what this would look like with this indicator.
The Image below shows what this would look like with this indicator. The selected timeframe is the Weekly, it shows an ‘S’ char above which is an indication of a Shooting Star Actionable signal and the low from 4 months ago in range showing some potential resistance. This actionable signal is meant to be played for SHORTS. If the low is breached than you would enter a short. For targets you would look at the previous pivots, for this example all targets were hit. This wont always play out so nice and clean, but given that there is so many stocks and so many signals this is just a thought to improve the quality of the signal as it has extra confluence.
MTFT Full Time Frame Continuity Table TheStrat Suite(2of5)Multi Time Frame Tools
Multi Time Frame Tools (MTFT) is a suite of scripts aimed to establish a standard timeframe-based color scheme. This can be utilized to overlay different timeframes calculations/values over a single timeframe. As one example, this would allow to observe the 5-month moving average, 5-week moving average, and 5-day moving average overlaid over each other. This would allow to study a chart, get accustomed to the color scheme and study all these at the same time much easier.
All indicators calculated using the below specific timeframes as input, will always use the color scheme outlined below. This is to get you in habit of recognizing the different timeframes overlaid in top of each other. These can be personalized.
Longer TF analysis.
Yearly - Black
Semi-Annual - Yellow
Quarterly - White
Monthly - Maroon
Weekly - Royal Blue
Daily - Lime
Shorter TF analysis.
4 hour - Fuchsia
1 hour - Orange
30 min - Red
15 min - Brown
10 min - Purple
5 min - Lilac
All color coordination is able to be modified in either the “Inputs” or “Style” section. If you need to make changes, make sure to select “Save as Default” on the bottom right of the settings menu.
Recommended Chart Color Layout
I played around with color coordination a lot. The final product was what worked best for me. I personally use the following chart settings to accent all available TF colors.
-> Click on the settings wheel on your chart. -> Click on “Appearance”.
Background - Solid -> On the top row pick the 6th color from the left.
Vert Grid Lines and Horz Grid Lines -> On the top row pick the 7th color from the left.
You may of course change these and the indicator line colors as you like.
Adding indicator to Chart
-> Open the TradingView “Indicators & Strategies” library, the icon has “ƒx”. -> All premium scripts will be located under “Invite-Only Scripts” -> Click indicator to add to your chart.
MTFT TheStrat Suite (5 Scripts)
Rob Smith is the creator of ‘TheStrat’ trading strategy. For ‘TheStrat’ I have put together a suite of 5 premium scripts that combined will offer people interested in learning ‘TheStrat’ a cleaner learning process. For 2 of the 5 scripts specifically, the MTFT approach of overlaying multiple longer timeframes(TF) over a shorter TF selected as a display cannot be utilized. The other 2 scripts will have full MTFT functionality and they are my personal favorite. I will be providing very basic info to utilize this script; it is up to you to dive deep into learning this strategy. I am not an expert with the tool or a financial advisor. As with all aspects of life, I recommend you research, learn, discern and practice extensively in order to become a master.
1. MTFT Patterns Pro/Noob
*2. MTFT Full Time Frame Continuity Table
3. MTFT Last HML wOpen
4. MTFT Actionable Signal Targets
5. MTFT Reversal Lines
MTFT Full Time Frame Continuity Table, TheStrat Suite (2of5)
Full timeframe continuity observes what direction different timeframes are pointed at, red or green. This gives you a bias when evaluating a trade. Image below shows 3 instances of the script to outline the max capacity of the script.
Features includes:
1. Four user selected TFs, with 20 different TF to pick from per script instance. Timeframes(TF) include: Yearly(Y), Semi-annually(S), Quarterly(Q), Monthly(M), 2-Week(2W), Weekly(W), 3-Day(3D), Daily(D), 12 hour, 8 hour, 6 hour, 4 hour, 3 hour, 2 hour, 1 hour, 30 min, 15 min, 10 min, 5 min. The first row on the table cell will show the text for the selected timeframe.
2. Color text Green/Red timeframe based on candlestick status for the selected timeframe. Entire Table Cell text will be colored in this color. These can be customized to user preference.
3. Absolute Truth for most recently closed candlestick, plus the active candlestick. This will be displayed in the second row of the table cell. The value inside the brackets ‘ ’ is used for the previous closed candlestick. The value outside the brackets is for the active candlestick.
4. Label pattern if it’s “in force” or not. This only applies for the active candlestick absolute truth value. Note, ‘i’ means the absolute truth is in force. ‘x’ means the absolute truth is not in force.
5. Actionable Signal indication at bottom. If there is an inside candlestick, a hammer or a shooter, the script will display , , and respectively at the bottom on the third row.
6. Auto-hide Lower Timeframes. When the table cell value is smaller than the selected timeframe this timeframe will be hidden. This is done because their will be errors in calculations.
7. Customizable Table Cell Width for use in the different platforms, desktop/mobile. For desktop I use the setting.
IMPORTANT NOTE for TradingView admin: One of the lessons I would consider most important in attaining clarity regarding trading, is “TheStrat” by Rob Smith. His lesson on “actionable signals” is something that can be applied to any strategy. For this reason, I am including “MTFT TheStrat Patterns Pro” script in all images that will depict confluence for a better trade selection.
Example using TheStrat Pro MTFT with this indicator.
Look for a “TheStrat actionable signal” or a “TheStrat Reversal signal” along with this indicator showing several other larger timeframes Red/Green depending on the direction of the actionable signal.
The Image below shows what this would look like with this indicator. The selected candlestick is the Week, it shows a confirmed closed Shooting Star Actionable signal and below the table shows that the Current Week(W), Month(M), Quarter(Q), and Year(Y) are all Red. This actionable signal would be played for SHORTS. If the low is breached than you would enter a short. For targets you would look at the previous pivots, for this example all targets were hit. This wont always play out so nice and clean, but given that there is so many stocks and so many signals this is just a thought to improve the quality of the signal as it has extra confluence.

MTFT Patterns Noob, TheStrat Suite (1of5)Multi Time Frame Tools
Multi Time Frame Tools (MTFT) is a suite of scripts aimed to establish a standard timeframe-based color scheme. This can be utilized to overlay different timeframes calculations/values over a single timeframe. As one example, this would allow to observe the 5-month moving average, 5-week moving average, and 5-day moving average overlaid over each other. This would allow to study a chart, get accustomed to the color scheme and study all these at the same time much easier.
All indicators calculated using the below specific timeframes as input, will always use the color scheme outlined below. This is to get you in habit of recognizing the different timeframes overlaid in top of each other. These can be personalized.
Longer TF analysis.
Yearly - Black
Semi-Annual - Yellow
Quarterly - White
Monthly - Maroon
Weekly - Royal Blue
Daily - Lime
Shorter TF analysis.
4 hour - Fuchsia
1 hour - Orange
30 min - Red
15 min - Brown
10 min - Purple
5 min - Lilac
All color coordination is able to be modified in either the “Inputs” or “Style” section. If you need to make changes, make sure to select “Save as Default” on the bottom right of the settings menu.
Recommended Chart Color Layout
I played around with color coordination a lot. The final product was what worked best for me. I personally use the following chart settings to accent all available TF colors.
-> Click on the settings wheel on your chart. -> Click on “Appearance”.
Background - Solid -> On the top row pick the 6th color from the left.
Vert Grid Lines and Horz Grid Lines -> On the top row pick the 7th color from the left.
You may of course change these and the indicator line colors as you like.
Adding indicator to Chart
-> Open the TradingView “Indicators & Strategies” library, the icon has “ƒx”. -> All premium scripts will be located under “Invite-Only Scripts” -> Click indicator to add to your chart.
MTFT TheStrat Suite (5 Scripts)
Rob Smith is the creator of ‘TheStrat’ trading strategy. For ‘TheStrat’ I have put together a suite of 5 premium scripts that combined will offer people interested in learning ‘TheStrat’ a cleaner learning process. For 2 of the 5 scripts specifically, the MTFT approach of overlaying multiple longer timeframes(TF) over a shorter TF selected as a display cannot be utilized. The other 2 scripts will have full MTFT functionality and they are my personal favorite. I will be providing very basic info to utilize this script; it is up to you to dive deep into learning this strategy. I am not an expert with the tool or a financial advisor. As with all aspects of life, I recommend you research, learn, discern and practice extensively in order to become a master.
*1. MTFT Patterns Pro/Noob
2. MTFT Full Time Frame Continuity Table
3. MTFT Last HML wOpen
4. MTFT Actionable Signal Targets
5. MTFT Reversal Lines
MTFT Patterns Pro/Noob, TheStrat Suite (1of5)
Features includes:
1.) Absolute Truth #. This setting will provide the candlesticks absolute truth # below the CS.
2.) Color bars based on Absolute Truth. This setting will color all inside candlesticks yellow, all Green Outside Candlesticks White and all Red Outside Candlesticks Fuchsia. Scenario 2 candlesticks are left as is and will color based on the color of the original candlestick. This setting is default enabled and needs to be disabled in the “Style” tab under the indicator settings wheel. I found this more practical in getting used to the 3 absolute truth scenarios.
3.) Reversals. This setting will mark when reversal patterns as discussed by Rob are posted. Noob version will also include the description of the reversal pattern, while the Pro version will only plot an ‘R’ without the text description. Note: There should never be back-to-back green Rs or red Rs. I found this issue a lot on many of the other ‘TheStrat’ scripts out there. TradingView development team note: The plotchar function does not allow dynamic text so this is the only reason on why there needs to be two separate versions of the script. ‘Pro’ is important for experienced users that already identify the patterns without the text and ‘Noob’ is important for beginner users that still need the text description of the pattern.
4. Continuations. This setting will mark when continuation patterns as discussed by Rob are posted. Noob version will also include the description of the continuation pattern, while the Pro version will only plot a ‘C’ without the text description.
TradingView Admin note: The plotchar function does not allow dynamic text so this is the only reason why there needs to be two separate versions of the script. ‘Pro’ is important for experienced users that already identify the patterns without the text and ‘Noob’ is important for beginner users that still need the text description of the pattern.
5. Actionable Signals and Complex Actionable Signals (CAS). This has several objective parameters as defined by Rob’s course. ‘Complex Actionable Signals’ is a name I used when speaking of actionable signals that require a combination of 2 or more candlesticks.
Actionable Signals.
• All inside candlesticks(Absolute Truth #1)
• Hammers
• Shooting Stars
Complex Actionable Signals.
• (Absolute Truth Combo 1-3-1 )Inside Outside Inside
• Outside -> Hammer
• Outside -> Shooting Star
• Inside -> Hammer
• Inside -> Shooting Star
• Momentum Inside
• Momentum Hammer
• Momentum Shooting Star
• Hammer -> Shooting Star
• Shooting Star -> Hammer
5a. Example CAS 1-3G-1. I am including only one example of several of the CAS that are included in this script. The star is utilized for all CAS, the color and location designate the direction that the CAS would have you act on. Note the “Entry” and “Target” line were added manually and are not part of the script. This is one successful setup; don’t get excited thinking this is how it always works. I will let you discover and learn for yourself that there is many failed setups and many setups that never trigger the actionable signal. This is where setting alerts is very handy.
6. Alerts. Press on the “Create Alert” Icon for TradingView. When the prompt opens select the preferred script either “TheStrat Pro” or “TheStrat Noob” under “Condition” and then under the sub-menu select any of the following scenarios.
• C ▲/ ▼ = If the active CS shows a continuation up/down pattern, remember this CS is active and can still change direction and trigger a reversal in the other direction.
• R ▲/▼ = If the active CS shows a reversal up/down pattern, remember this CS is active and can still change direction and trigger a continuation in the previous trend direction.
• HM Trigger(Last High Cross) = Alert when the active CS breaks the high of the previous CS. As a new CS opens, it re-adjusts its values and is just constantly waiting for the active CS break through the previous CS high.
• SS Trigger(Last Low Cross) = Alert when the active CS breaks the low of the previous CS. As a new CS opens, it re-adjusts its values and is just constantly waiting for the active CS break through the previous CS low.
• Inside Trigger (Last High/Low Cross) = Alert when the active CS breaks the low or the high of the previous CS. As a new CS opens, it re-adjusts its values and is just constantly waiting for the active CS break through either the previous CS low or the high.
• Last CS Inside
• Last CS H
• Last CS S
• Last CS Actionable Signal (inside, H or S)
• Last CS Complex Actionable Signal
• Last CS Any Actionable Signal

MTFT Patterns Pro, TheStrat Suite (1of5)Multi Time Frame Tools
Multi Time Frame Tools (MTFT) is a suite of scripts aimed to establish a standard timeframe-based color scheme. This can be utilized to overlay different timeframes calculations/values over a single timeframe. As one example, this would allow to observe the 5-month moving average, 5-week moving average, and 5-day moving average overlaid over each other. This would allow to study a chart, get accustomed to the color scheme and study all these at the same time much easier.
All indicators calculated using the below specific timeframes as input, will always use the color scheme outlined below. This is to get you in habit of recognizing the different timeframes overlaid in top of each other. These can be personalized.
Longer TF analysis.
Yearly - Black
Semi-Annual - Yellow
Quarterly - White
Monthly - Maroon
Weekly - Royal Blue
Daily - Lime
Shorter TF analysis.
4 hour - Fuchsia
1 hour - Orange
30 min - Red
15 min - Brown
10 min - Purple
5 min - Lilac
All color coordination is able to be modified in either the “Inputs” or “Style” section. If you need to make changes, make sure to select “Save as Default” on the bottom right of the settings menu.
Recommended Chart Color Layout
I played around with color coordination a lot. The final product was what worked best for me. I personally use the following chart settings to accent all available TF colors.
-> Click on the settings wheel on your chart. -> Click on “Appearance”.
Background - Solid -> On the top row pick the 6th color from the left.
Vert Grid Lines and Horz Grid Lines -> On the top row pick the 7th color from the left.
You may of course change these and the indicator line colors as you like.
Adding indicator to Chart
-> Open the TradingView “Indicators & Strategies” library, the icon has “ƒx”. -> All premium scripts will be located under “Invite-Only Scripts” -> Click indicator to add to your chart.
MTFT TheStrat Suite (5 Scripts)
Rob Smith is the creator of ‘TheStrat’ trading strategy. For ‘TheStrat’ I have put together a suite of 5 premium scripts that combined will offer people interested in learning ‘TheStrat’ a cleaner learning process. For 2 of the 5 scripts specifically, the MTFT approach of overlaying multiple longer timeframes(TF) over a shorter TF selected as a display cannot be utilized. The other 2 scripts will have full MTFT functionality and they are my personal favorite. I will be providing very basic info to utilize this script; it is up to you to dive deep into learning this strategy. I am not an expert with the tool or a financial advisor. As with all aspects of life, I recommend you research, learn, discern and practice extensively in order to become a master.
*1. MTFT Patterns Pro/Noob
2. MTFT Full Time Frame Continuity Table
3. MTFT Last HML wOpen
4. MTFT Actionable Signal Targets
5. MTFT Reversal Lines
MTFT Patterns Pro/Noob, TheStrat Suite (1of5)
Features includes:
1.) Absolute Truth #. This setting will provide the candlesticks absolute truth # below the CS.
2.) Color bars based on Absolute Truth. This setting will color all inside candlesticks yellow, all Green Outside Candlesticks White and all Red Outside Candlesticks Fuchsia. Scenario 2 candlesticks are left as is and will color based on the color of the original candlestick. This setting is default enabled and needs to be disabled in the “Style” tab under the indicator settings wheel. I found this more practical in getting used to the 3 absolute truth scenarios.
3.) Reversals. This setting will mark when reversal patterns as discussed by Rob are posted. Noob version will also include the description of the reversal pattern, while the Pro version will only plot an ‘R’ without the text description. Note: There should never be back-to-back green Rs or red Rs. I found this issue a lot on many of the other ‘TheStrat’ scripts out there. TradingView development team note: The plotchar function does not allow dynamic text so this is the only reason on why there needs to be two separate versions of the script. ‘Pro’ is important for experienced users that already identify the patterns without the text and ‘Noob’ is important for beginner users that still need the text description of the pattern.
4. Continuations. This setting will mark when continuation patterns as discussed by Rob are posted. Noob version will also include the description of the continuation pattern, while the Pro version will only plot a ‘C’ without the text description.
TradingView Admin note: The plotchar function does not allow dynamic text so this is the only reason why there needs to be two separate versions of the script. ‘Pro’ is important for experienced users that already identify the patterns without the text and ‘Noob’ is important for beginner users that still need the text description of the pattern.
5. Actionable Signals and Complex Actionable Signals (CAS). This has several objective parameters as defined by Rob’s course. ‘Complex Actionable Signals’ is a name I used when speaking of actionable signals that require a combination of 2 or more candlesticks.
Actionable Signals.
• All inside candlesticks(Absolute Truth #1)
• Hammers
• Shooting Stars
Complex Actionable Signals.
• (Absolute Truth Combo 1-3-1 )Inside Outside Inside
• Outside -> Hammer
• Outside -> Shooting Star
• Inside -> Hammer
• Inside -> Shooting Star
• Momentum Inside
• Momentum Hammer
• Momentum Shooting Star
• Hammer -> Shooting Star
• Shooting Star -> Hammer
5a. Example CAS 1-3G-1. I am including only one example of several of the CAS that are included in this script. The star is utilized for all CAS, the color and location designate the direction that the CAS would have you act on. Note the “Entry” and “Target” line were added manually and are not part of the script. This is one successful setup; don’t get excited thinking this is how it always works. I will let you discover and learn for yourself that there is many failed setups and many setups that never trigger the actionable signal. This is where setting alerts is very handy.
6. Alerts. Press on the “Create Alert” Icon for TradingView. When the prompt opens select the preferred script either “TheStrat Pro” or “TheStrat Noob” under “Condition” and then under the sub-menu select any of the following scenarios.
• C ▲/ ▼ = If the active CS shows a continuation up/down pattern, remember this CS is active and can still change direction and trigger a reversal in the other direction.
• R ▲/▼ = If the active CS shows a reversal up/down pattern, remember this CS is active and can still change direction and trigger a continuation in the previous trend direction.
• HM Trigger(Last High Cross) = Alert when the active CS breaks the high of the previous CS. As a new CS opens, it re-adjusts its values and is just constantly waiting for the active CS break through the previous CS high.
• SS Trigger(Last Low Cross) = Alert when the active CS breaks the low of the previous CS. As a new CS opens, it re-adjusts its values and is just constantly waiting for the active CS break through the previous CS low.
• Inside Trigger (Last High/Low Cross) = Alert when the active CS breaks the low or the high of the previous CS. As a new CS opens, it re-adjusts its values and is just constantly waiting for the active CS break through either the previous CS low or the high.
• Last CS Inside
• Last CS H
• Last CS S
• Last CS Actionable Signal (inside, H or S)
• Last CS Complex Actionable Signal
• Last CS Any Actionable Signal
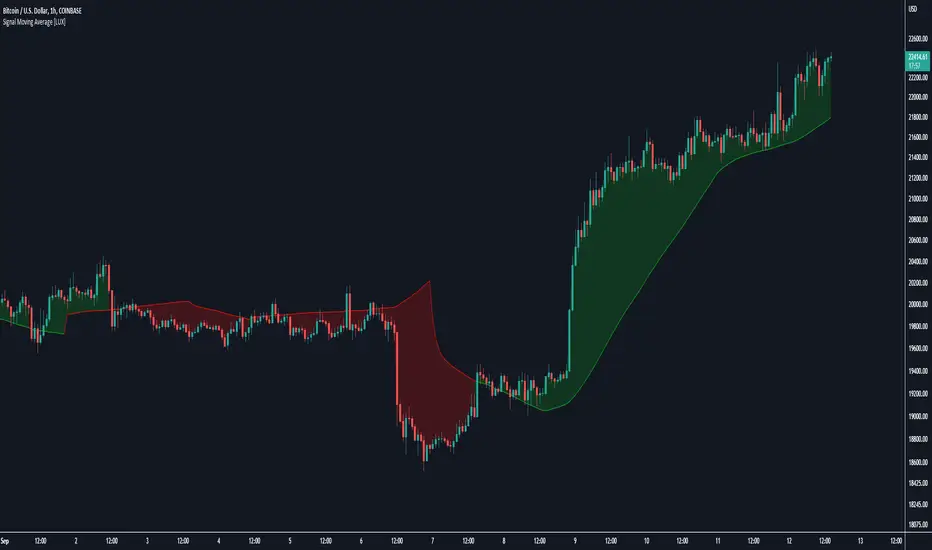
Signal Moving Average [LuxAlgo]The following script returns a moving average designed to be used as a signal line in a moving average crossover system. The moving average will diverge from the price during ranging markets and reach the value of a regular moving average during trending markets.
Settings
Length: Moving average period
Src: Source input of the indicator
Usage
Moving average crossover strategies often rely on a "signal" line, a slower moving average used to determine a general trend. This signal line is paired with a faster moving average to filter out potential whipsaw trades that would have been given from crosses between the regular price and the signal line.
The proposed indicator will avoid crossing the price by diverging from it during more ranging periods, thus effectively reducing the number of crosses produced between the price and the signal line.
The color of the area between the price and the signal line is determined by the position of the price relative to the signal line, with a green color indicator a price superior to the signal line.
The color of the signal line, however, is taking into account whether market is trending or ranging, only changing once the market is trending.
The chart above shows the cumulated number of crosses between the price and the signal line (green) and a regular simple moving average of the same period (red) on AMD 15m, a lowered number of crosses can effectively reduce the impact of frictional costs introduced by whipsaw trades.
Juirk-Filtered QQE Histogram [Loxx]Juirk-Filtered QQE Histogram is a QQE indicator with 7 different RSI types, Jurik-Filtering with the option of double filtering. 2 types of signals, and Loxx's Expanded Source types. These additions are useful to filter out noise.
What is Qualitative Quantitative Estimation (QQE)?
The Qualitative Quantitative Estimation (QQE) indicator works like a smoother version of the popular Relative Strength Index ( RSI ) indicator. QQE expands on RSI by adding two volatility based trailing stop lines. These trailing stop lines are composed of a fast and a slow moving Average True Range (ATR).
There are many indicators for many purposes. Some of them are complex and some are comparatively easy to handle. The QQE indicator is a really useful analytical tool and one of the most accurate indicators. It offers numerous strategies for using the buy and sell signals. Essentially, it can help detect trend reversal and enter the trade at the most optimal positions.
What is Jurik Volty used in the Juirk Filter?
One of the lesser known qualities of Juirk smoothing is that the Jurik smoothing process is adaptive. "Jurik Volty" (a sort of market volatility ) is what makes Jurik smoothing adaptive. The Jurik Volty calculation can be used as both a standalone indicator and to smooth other indicators that you wish to make adaptive.
What is the Jurik Moving Average?
Have you noticed how moving averages add some lag (delay) to your signals? ... especially when price gaps up or down in a big move, and you are waiting for your moving average to catch up? Wait no more! JMA eliminates this problem forever and gives you the best of both worlds: low lag and smooth lines.
Ideally, you would like a filtered signal to be both smooth and lag-free. Lag causes delays in your trades, and increasing lag in your indicators typically result in lower profits. In other words, late comers get what's left on the table after the feast has already begun.
Included:
Loxx's Expanded Source Types
Alerts
Signals
Bar coloring
Included Libraries
Loxx's Variety RSI
Loxx's Jurik Tools
Loxx's Expanded Source Types
Related indicators:
Natural Market Mirror (NMM) and NMAs w/ Dynamic Zones
RSI/RSX QQE Histogram w/ Discontinued Signal Line
Jurik CFB Adaptive QQE
Adaptive Qualitative Quantitative Estimation (QQE)
BBSS - Bollinger Bands Scalping SignalsModified Bollinger Bands Indicator
Added:
- color change divergence (green) and narrowing (red) of the upper and lower bands
- color change of the moving average - upward trend (green) and downward trend (red)
- the appearance of a potential signal for long and short positions when the candle closes behind the upper or lower bands.
How to use the indicator:
Long conditions:
- the price breaks through the upper band
- Bollinger bands are expanding and should be green
- the mid-line is green
- the trigger candle should be green
Short conditions:
- the price breaks through the lower band
- Bollinger bands are expanding and should be red
- the mid-line is red
- the trigger candle should be red

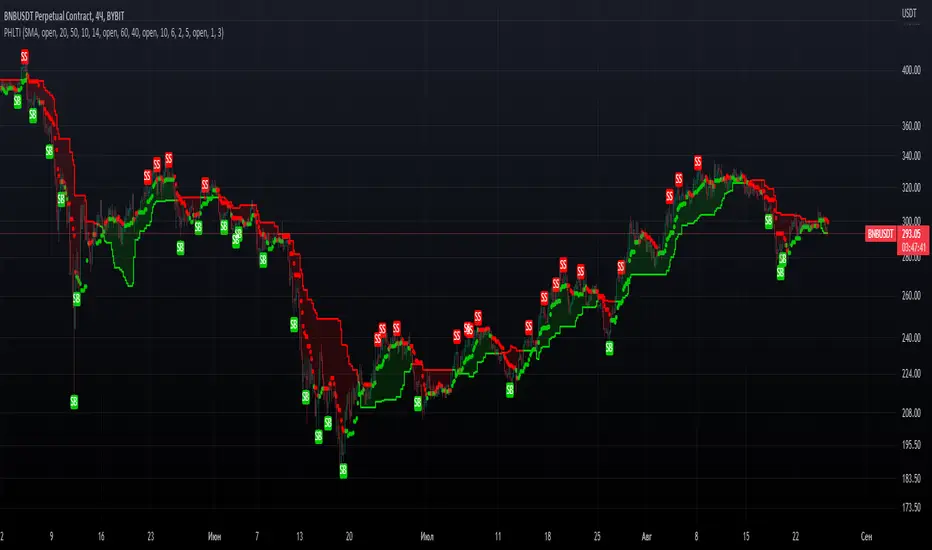
PrevHighLow Trend IndicatorPrevHighLow Trend Indicator which is calculated by using prev lowest and highest of p1 -period and p2 -period for two MAs.
First MA is made of prev highest of p1-period / prev lowest of p1-period.
Second MA is faster, made up of p2(<p1)- period(same formula).
Can be used in the next way: slower MA(straight line) shows main trend, faster shows temporary trend.
BUY, when first MA and second MA are green; Exit: second MA changes from green to red.
SELL, when first MA and second MA are red; Exit: second MA changes from red to green.
RSI Assistant basically filtres signals in the way, when signals from RSI and Faster MA are similar? it signals about it with labels: BUY for long, SELL for short. You can either enable or disable it. Also customizable so you can find your setup. RSI Assistant, depending on you customize it, can help you either follow trend or show reversals. Just find your own setup and watch things happen!
Feel free to leave valuable feedback and your setups which you consider to be good.
Hope you PHLTI usefull. Good luck!
TheATR: Fisher Oscillator.Fisher Oscillator(FO).
The Fisher Oscillator is inspired by John Ehlers "Fisher Transform".
The oscillator highlights when prices have moved to an extreme, based on recent prices.
The FO may help in spotting turning points, in the short-medium trends of an asset, also, it helps in recognizing the asset's trends themselves, giving a picture of mkt conditions affected by less noise.
Fisher Oscillator Components.
Fisher V1 -> Main FO.
Fisher V2 -> Past Candle FO.
0-line threshold -> Directional Component.
How to read the Fisher Oscillator.
The FO is super easy to read by itself.. also, I coded some features which make it even easier to read.
It's suggestions, which we can call "Signals", come from 2 different sources, accessible thanks to the variable "Signals Type".
- 0-Line Crosses:
When the "Fisher V1" upcrosses the oscillator 0-line, the oscillator suggests a Long scenario.
When the "Fisher V1" downcrosses the oscillator 0-line, the oscillator suggests a Short scenario.
- Classic Lines Crosses:
When the "Fisher V1" upcrosses the "Fisher V2", the oscillator suggests a Long scenario.
When the "Fisher V1" downcrosses the "Fisher V2", the oscillator suggests a Short scenario.
Users will be able to recognise these Signals visually, thanks to some color customisation to the "Fisher V1" line, and thanks to the ability of the oscillator of plotting Signals.
TheATR Documentation regarding TheATR: Fisher Oscillator.
Researching and backtesting the FO, I noticed it's skill of being able to dynamically identify trend reversals with a nice degree of reliability.
Also, the FO's able to keep up with trends up to their tops/bottoms, as it's very responsive.
This makes the FO a trend-following oscillator in my personal view, because its nature of being very fast in detecting reversals will lead to many false reversals as well.
On the other face of this coin, if we look at the FO as a source for confirmations for a trend-following strategy, may be very useful.
To conclude, I would use the FO as a confirmation oscillator, in a trend-following strategy that needs to have other components.
Thanks for reading,
TheATR.

Multi Type RSI [Misu]█ This Indicator is based on RSI ( Relative Strength Index ) & multiple type of MA (Moving Average) to show different variations of RSI.
The relative strength index (RSI) is a momentum indicator used in technical analysis to evaluate overvalued or undervalued conditions in the price of that security.
█ Usages:
The purpose of this indicator is to obtain the RSI calculated with different MAs modes instead of the classic RMA.
The red and green zones indicate the oversold and overbought zones.
Buy or sell signals are marked by the green and red circles
We have 2 different signal modes : when the different size RSIs cross and when the fast RSI crosses the extreme bands.
Alerts are setup.
█ Parameters:
Lenght RSI: The lenght of the RSI. (14 by default)
RSI MA Type: The type of MA with which the rsi will be calculated. ("SMA", "EMA", "SMMA (RMA)", "WMA", "VWMA")
Fast Lenght MA: The fast lenght smoothing MA.
Slow Lenght MA: The Slow lenght smoothing MA.
Lower Band: The lenght of the lower band. (25 by default)
Upper Band: The lenght of the upper band. (75 by default)
Signal Type: The mode with which buy and sell signals are triggered. ("Cross 2 Mas", "Cross Ma/Bands")

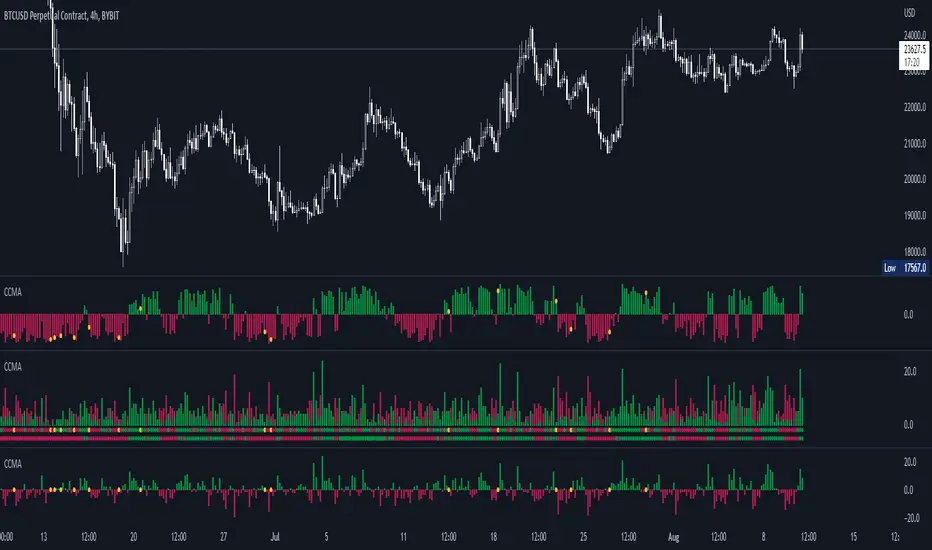
CCMA - Count Condition MA (560 Indicators In One) Do you like using moving averages?
Why do you think a pair of moving averages on a chart will help you?
What is the probability that once two moving averages have crossed, you will successfully enter the trade?
So why not use 100+ moving averages at once to increase the probability of a successful trade?
And all this can be seen in a single oscillator as a histogram!
I want to introduce you to a system that takes into account 560 moving averages movements. And that's just for a second, 560 potential indicators.
Specifically:
- 22 types of MA (EMA, SMA, RMA and others).
- 176 moving averages.
- 310 crossover checks.
- 252 checks of trend following.
The indicator makes the most of the opportunities provided by television. Therefore, it can take a long time to load it.
How does it work ?
In general, the indicator counts the number of fulfilled conditions.
It checks if MA #1 and MA #2 have crossed. If so, it adds +1 to the statistics. It also checks if price is above or below the moving average. There are a total of 560 such checks. (This is about the maximum the TV allowed me).
The default is 8 lengths of moving averages, I took the Fibonacci numbers thinking they were the optimal solution. You can take any of your favorites.
If the "Ratio MOD" feature is on. Then you can see how many MAs are showing signals to enter a long or short position.
You can also see the indication at the bottom as dots. They show which signals are longer/shorter. If the number of signals is the same, the dot will be yellow. The first line of dots counts the number of crossings. The second line counts the number of crossovers + checks whether the price is above or below the average slippage.
If the "Differ MOD" function is enabled. Then you can see the difference between long and short signals. With the same indication as in RATIO MOD.
If "Show all" is on, then the bar graph shows all 560 accounting options. If it is off, only the number of crossovers is displayed. (This does not apply to the display as points)
If the script shows an error, try to change the timeframe and go back. Or add it again.
You can also disable the histogram in the stats settings and leave only the points that help in determining the trend.
Ultimate IndicatorThis is a combination of all the price chart indicators I frequently switch between. It contains my day time highlighter (for day trading), multi-timeframe long-term trend indicator for current commodity in the bottom right, customizable trend EMA which also has multi-timeframe drawing capabilities, VWAP, customizable indicators with separate settings from the trend indicator including: EMA, HL2 over time, Donchian Channels, Keltner Channels, Bollinger Bands, and Super Trend. The settings for these are right below the trend settings and can have their length and multiplier adjusted. All of those also have multi-timeframe capabilities separate from the trend multi-time settings.
The Day Trade Highlight option will draw faint yellow between 9:15-9:25, red between 9:25-9:45, yellow between 9:45-10:05. There will be one white background at 9:30am to show the opening of the market. while the market is open there will be a very faint blue background. For the end of the day there will be yellow between 15:45-15:50, red between 15:50-16:00, and yellow between 16:00-16:05. During the night hours, there is no coloring. The purpose of this highlight is to show the opening / closing times of the market and the hot times for large moves.
The indicators can also be colored in the following ways:
1. Simple = Makes all colors for the indicator Gray
2. Trend = Will use the Donchian Channels to get the short-trend direction and by default will color the short-term direction as Blue or Red. Unless using Super Trend, the Donchian Channel is used to find short-term trend direction.
3. Trend Adv = Will use the Donchian Channels to get the short-trend direction and by default will color the short-term direction as Blue or Red. Unless using Super Trend, the Donchian Channel is used to find short-term trend direction. If there is a short-term up-trend during a long-term down-trend, the Blue will become Navy. If short-term down-trend during long-term up-trend, the Red will be Brown.
4. Squeeze = Compares the Bollinger Bands width to the Keltner Channels width and will color based on relative squeeze of the market: Teal = no squeeze. Yellow = little squeeze. Red = decent squeeze. White = huge squeeze. if you do not understand this one, try drawing the Bollinger Bands while using the Squeeze color option and it should become more apparent how this works. I also recommend leaving the length and multiplier to the default 20 and 2 if using this setting and only changing the timeframe to get longer/shorter lengths as I've seen that changing the length or multiplier can more or less make it not work at all.
Along with the indicator settings are options to draw lines/labels/fills for the indicator. I enjoy having only fills for a cleaner look.
The Labels option will show Buy/Sell signals when the short-term trend flips to agree with the long-term trend.
The Trend Bars option will do the same as the Labels option but instead will color the bars white when a Buy/Sell option is given.
The Range Bars option shows will color a bar white when the Close of a candle is outside of a respective ranging indicator option (Bollinger or Keltner).
The Trend Bars will draw white candles no matter which indicator selection you make (even "Off"). However, Range Bars will only draw white when either Bollinger or Keltner are selected.
The Donchian Channels and Super Trend are trending indicators and should be used during trending markets. I like to use the MACD in conjunction with these indicators for possibly earlier entries.
The Bollinger Bands and Keltner Channel are ranging indicators and should be used during ranging markets. I like to use the RSI in conjunction with these indicators and will use 60/40 for overbought and oversold areas rather than 70/30. During a range, I wait for an overbought or oversold indication and will buy/sell when it crosses back into the middle area and close my position when it touches the opposite band.
I have a MACD/RSI combination indicator if you'd like that as well :D
As always, trade at your own risk. This is not some secret indicator that will 100% win. As always, the trades you see in the picture use a 1:1.5 or 1:2 risk to reward ratio, for today (August 8, 2022) it won 5/6 times with one trade still open at the end of the day. Manage your account correctly and you'll win in the long term. Hit me up with any questions or suggestions. Happy Trading!
