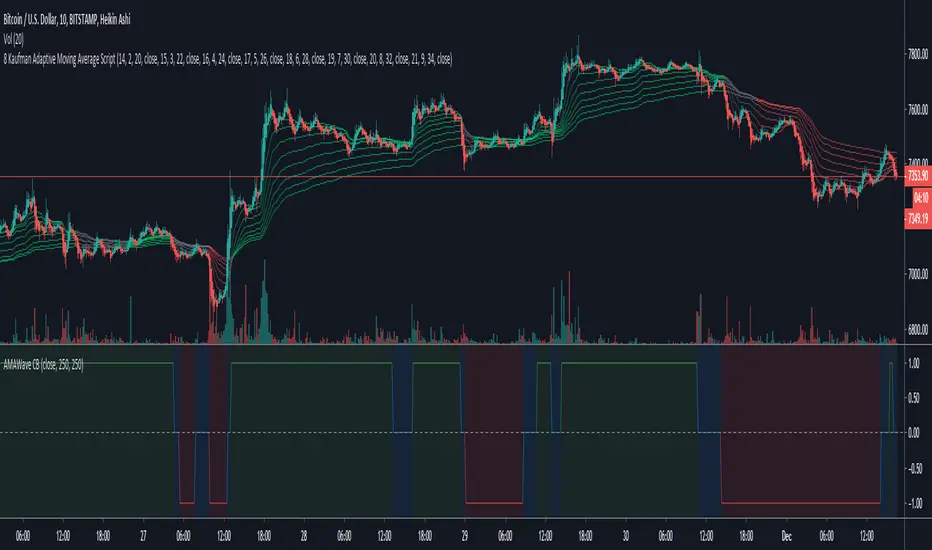
Kaufman AMA Binary Wave [ChuckBanger]This is Kaufman AMA Binary Wave with buy and sell zones. It’s pretty simple: when the line is over zero = buy zone, below zero = sell, at zero = neutral. You can experiment with the filter and length settings to suit your environment.
Signals
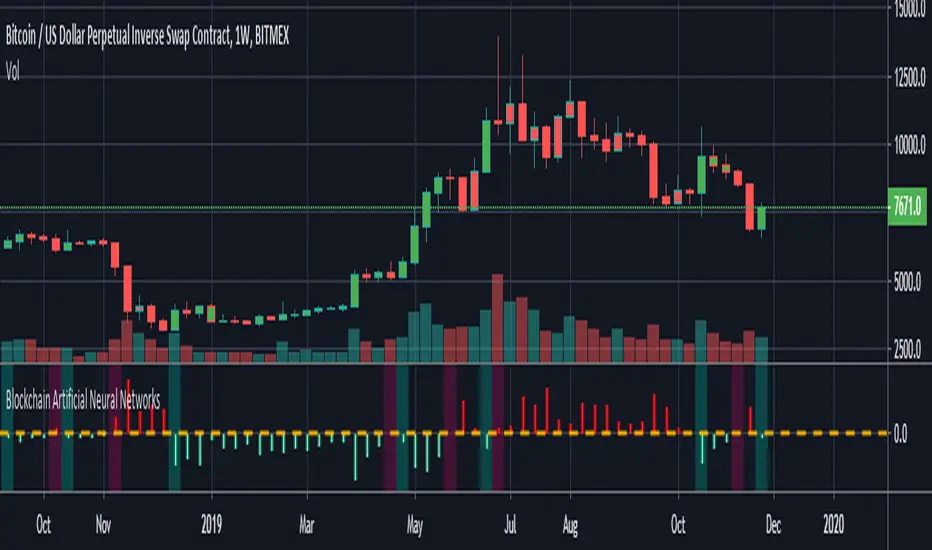
Blockchain Artificial Neural NetworksI found a very high correlation in a research-based Artificial Neural Networks.(ANN)
Trained only on daily bars with blockchain data and Bitcoin closing price.
NOTE: It does not repaint strictly during the weekly time frame. (TF = 1W)
Use only for Bitcoin .
Blockchain data can be repainted in the daily time zone according to the description time.
Alarms are available.
And you can also paint bar colors from the menu by region.
After making reminders, let's share the details of this interesting research:
INPUTS :
1. Average Block Size
2. Api Blockchain Size
3. Miners Revenue
4. Hash Rate
5. Bitcoin Cost Per Transaction
6. Bitcoin USD Exchange Trade Volume
7. Bitcoin Total Number of Transactions
OUTPUTS :
1. One day next price close (Historical)
TRAINING DETAILS :
Learning cycles: 1096436
AutoSave cycles: 100
Grid :
Input columns: 7
Output columns: 1
Excluded columns: 0
Training example rows: 446
Validating example rows: 0
Querying example rows: 0
Excluded example rows: 0
Duplicated example rows: 0
Network :
Input nodes connected: 7
Hidden layer 1 nodes: 5
Hidden layer 2 nodes: 0
Hidden layer 3 nodes: 0
Output nodes: 1
Controls :
Learning rate: 0.1000
Momentum: 0.8000
Target error: 0.0100
Training error: 0.010571
The average training error is really low, almost worth the target.
Without using technical analysis data, we established Artificial Neural Networks with blockchain data.
Interesting!
Alerts on OnePunch Algo StudyIn this study you will be able to get alerts based on the OnePunch Algo Strategy Version 1 and 2.
How To Use:
Open Alerts and Pick Alerts on OnePunch Algo Study option.
For buy alerts, pick Buy Signal option
For sell alerts, pick Sell Signal option
Simple as that. This script will provide buying and selling alerts to your email and mobile app notifications.

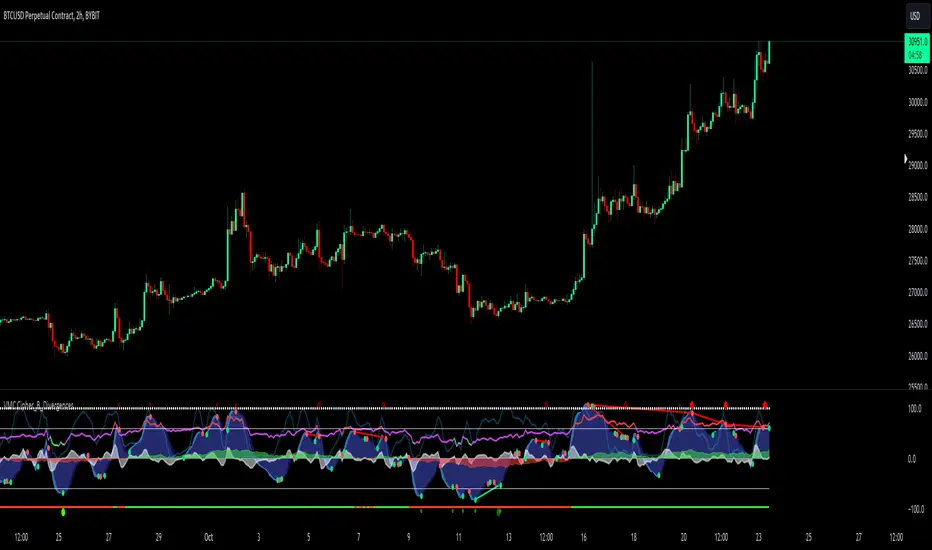
RealTime Wave Divergence SignalsThis indicator comes from the same algo family as our CryptoWave Pro and SmartWave, but focuses on real time divergence detection.
Unlike the divergence detection in CryptoWave Pro (and pretty much all divergence scripts here on TradingView), this one does not have a 2 bar delay.
The pros of this is that you can catch moves much earlier, but also the main con being that at times you will get faked out.
Using proper risk and trade management this can work out to be a great strategy to use for either manual or automated trading.
Signals produced are entries for Longs and Shorts, but can also be used as exits if you wish.

Market Thrust IndicatorThe Market Thrust indicator is a powerful measure of the stock market's internal strength or weakness. There are four components to this indicator:
1-Advancing Issues on the New York Stock Exchange (NYSE) – $ADV
2-Advancing Volume on the NYSE – $UVOL
3-Declining Issues on the NYSE – $DECL
4-Declining Volume on the NYSE – $DVOL
The formula for Market Thrust is given below:
($ADV x $UVOL)-($DECL x $DVOL)
When used for day-trading, the trend of the Market Thrust indicator is what is most important.
Rising Market Thrust Indicator: Considered a bullish sign; can act as a confirmation signal when combined with a rising stock, index ETF, or stock index future's price.
Falling Market Thrust Indicator: Considered a bearish sign; can act as a confirmation signal of a decreasing market price.
The Market Thrust indicator could be used for detecting divergences in trends. Divergences occur when:
- Price is trending higher, but the Market Thrust indicator is not moving higher or is even going down.
- Price is trending lower, however, the Market Thrust technical analysis tool is not trending lower, it is either not trending or is trending higher.
Add a fully configurable trend line over MTI.
Read more at: commodity.com

Leledc Exhaustion Bar V4 PLUSLeledc Exhaustion Bar indicator created by glaz converted to Pine 4, plotshape was added.

ANN Forecast MACD [Noldo] In this script, I tried to convert ANN MACD to MACD Forecast.
It took me quite a while, but it was fun.
After selecting the ticker, select the instrument from the menu and the system will automatically turn on the appropriate Forecast MACD system.
The system is trained with ANN values of ANN MACD 25 in 1.
But because the system is overloaded, only the most popular instruments are left.
The others were unfortunately eliminated.
The only difference is that it was built on the forecast algorithm of my own creation.
The Forecast algorithm is not open-source.
The codes are a nice framework for some of my most valuable systems about ANN . (Working on them. )
But I'm never remove this script.
You can use it forever for free.
As you can see in the presentation, although it is in the same period, it is more accurate and agile than normal MACD.
I think even a bar is important in trade.
For those who don't see that command,listed instruments with alternative tickers and error rates:
WTI : West Texas Intermediate (WTICOUSD , USOIL , CL1! ) Average error : 0.007593
BRENT : Brent Crude Oil ( BCOUSD , UKOIL , BB1! ) Average error : 0.006591
GOLD : XAUUSD , GOLD , GC1! Average error : 0.012767
SP500 : S&P 500 Index ( SPX500USD , SP1! ) Average error : 0.011650
EURUSD : Eurodollar ( EURUSD , 6E1! , FCEU1!) Average error : 0.005500
ETHUSD : Ethereum ( ETHUSD , ETHUSDT ) Average error : 0.009378
BTCUSD : Bitcoin ( BTCUSD , BTCUSDT , XBTUSD , BTC1! ) Average error : 0.01050
GBPUSD : British Pound ( GBPUSD , 6B1! , GBP1!) Average error : 0.009999
USDJPY : US Dollar / Japanese Yen ( USDJPY , FCUY1!) Average error : 0.009198
USDCHF : US Dollar / Swiss Franc ( USDCHF , FCUF1! ) Average error : 0.009999
USDCAD : Us Dollar / Canadian Dollar ( USDCAD ) Average error : 0.012162
SOYBNUSD : Soybean ( SOYBNUSD , ZS1! ) Average error : 0.010000
CORNUSD : Corn ( ZC1! ) Average error : 0.007574
NATGASUSD : Natural Gas ( NATGASUSD , NG1! ) Average error : 0.010000
SUGARUSD : Sugar ( SUGARUSD , SB1! ) Average error : 0.011081
WHEATUSD : Wheat ( WHEATUSD , ZW1! ) Average error : 0.009980
XPTUSD : Platinum ( XPTUSD , PL1! ) Average error : 0.009964
XU030 : Borsa Istanbul 30 Futures ( XU030 , XU030D1! ) Average error : 0.010727
VIX : S & P 500 Volatility Index (VX1! , VIX ) Average error : 0.009999
ES : S&P 500 E-Mini Futures ( ES1! ) Average error : 0.010709
SSE : Shangai Stock Exchange Composite (Index ) ( 000001 ) Average error : 0.011287
XRPUSD : Ripple (XRPUSD , XRPUSDT ) Average error : 0.009803
Extras :
- Crossover and crossunder alerts
- Switchable barcolor
NOTE :
Australian Dollar / US Dollar (AUDUSD ) removed due to high average error. (Average error > 0.013 )
Timeframe advice :
I suggest you to use that system TF >= 1D
My favorite is 1 week bars. (1W)
Info about forecast series :
www.sciencedirect.com
Special thanks :
Special thanks to dear wroclai for his great effort .

Experimental Entry Interface (Buy Arrows with TP & SL)This script provides high probability entry points and includes Take Profit and Stop Loss targets.
It attempts to predict when the market conditions are set to move up, and prints long positions.
In addition to Long Entry Arrows, it will print Take Profit / Stop Loss targets.
This indicator is highly adjustable. Hence the name 'Experimental' in the title. Experiment with it to find the results you want.
Designed for use on the 1H timeframe in Forex, but could possibly be useful elsewhere. Do your own testing.
This indicator can repaint. It is best used with alerts set for once per bar close, so that your alerts do not repaint and your trades are solid.
Not ever signal is a winner. Backtest thoroughly. Adjust accordingly.
Arrows
Four sets of colored arrows are included.
💵 💶 Green and Blue Entry Arrows are formed when the market is in an uptrend, and has a momentary pullback.
💴 💷 Yellow and Purple Entry Arrows are formed when the market is just starting to recover from being severely oversold.
Backtest Mode
Turn on Backtest Mode to easily see if an entry ended up as a winner or loser. A Take Profit and Stop Loss line will be drawn to show results.
Take Profit & Stop Loss Targets
You have two options for this.
Price will show you where your TP/SL exits should be placed. These values will show up under the arrow, based on your Risk/Reward ratio.
Pips are much more simple, and will only show you the market entry point and how many pips up/down to place your SL/TP. Warning: This is fixed at a 1:1 RRR .
Risk/Reward Adjustment
Each entry arrow color allows custom risk/reward ratio adjustment.
Dollar Amounts Displayed
Change your account value and leverage to see how much you would have won on each trade.
How to trade with it?
(Forex, 1H) Open the settings, and turn on all the arrow entries. Turn on Backtest mode to see how past trades would have played out. Turn on TakeProfit/StopLoss Targets to see where to set your targets, for each arrow. Set an alert to notify you once per candle close when there is an Entry. Trade happy!
Bill Williams Alligators are also included, if you want. Not necessary though. Some of the calculations depend on them for trend direction analysis.

RSI with Moving Averages[UO]This RSI indicator is one of my favorite indicators. This powerful indicator is implemented by Phi-Deltalytics. I modified the drawing so that it is easier (at least for me) to see the signals and trends (it would not matter if you're doing algorithmic trading).
Trends and signals. For detailed instructions and tutorial see Phi-Deltalytics page

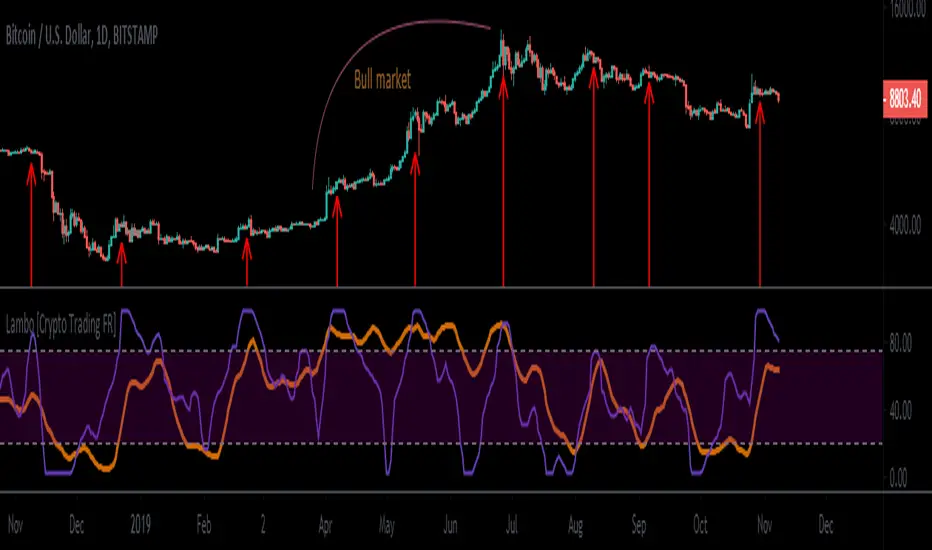
Lambo indicator [Crypto Trading FR]Lambo indicator is probably one of the best indicator you can use to spot the trend and make money.
It is a momentum oscillator contains two signals line :
- The lambo moving average (orange line) for momentum
- The huracan (purple line) perfect in showing market bottoms and tops
The combination of both line give you the perfect timing to buy or sell any assets.
If you look after a way where you can identify market regime shift from low volatility zone to high volatility zone and vice versa, it is certainly the indicator you need!
Lambo indicator works on all timeframe but better use it with higher ones 4H, 8H, 1D, 1W etc.
Let me know if you like it.
Enjoy and make money guys!!!
6Hours swingalgo by BiO-618Hey, I want to share you this algo I remade for a bullish market.
*It uses about 11 indicators, 3 of them made by me to avoid BUYs on the start of a big dump.
*It was added ghost pivots for weekly and monthly values, really useful!
Let me know any suggestion, I will keep working to improve it
Relative Volume RVOL AlertsRelative Volume or RVOL is an indicator used to help determine the amount of volume change over a given period of time.
It is often used to help traders determine how in-play a ticker is.
General rule of thumb is the higher the RVOL, the more in play a stock is.
I myself like to use it as a substitute of the volume indicator itself.
Basic Calculation:
Relative Volume = Current Volume / Average Volume
Crossover Signals:
Any time there is a volume spike which causes a crossover of the user set 'Smoothed Moving Average' or 'Threshold' a green/red dot will appear at the top. The color of the dot is dependent on closing of the candle. Therefore it does not necessarily mean price will continue in that direction since volume spikes often happen in peaks or valleys.
Threshold:
The level at which custom alerts and signal can be set. The higher the value, the more volume required to trigger.
Built in Alerts:
You can set custom alerts for the crossovers of the adjustable threshold, or the average RVOL band.

Stochastic RSI 3in1 & Volatility peaks + ADX by AGUDescription:
3 Lines are Stochastic RSI's, strongest move is when all crosses and moves to one direction (from top or bottom).
Orange is original Stochastic of the timeline. (Live movement of price).
Green is original Stoch x 6. (Short term movement).
Red is original Stoch x27 (Long term price movement).
Transparent columns are ADX signal.
Higher the mountain, stronger the signal. When the mountain tops, trend usually change.
And finally the volatility peaks. Green peak HIGHEST volatility , RED peak LOWEST volatility .
I use it on 1 min BTC chart. But it works on all.
TIPS >> 3HCQ41cRpxcq2MJdRUSYoq9N1RnEy98xD2

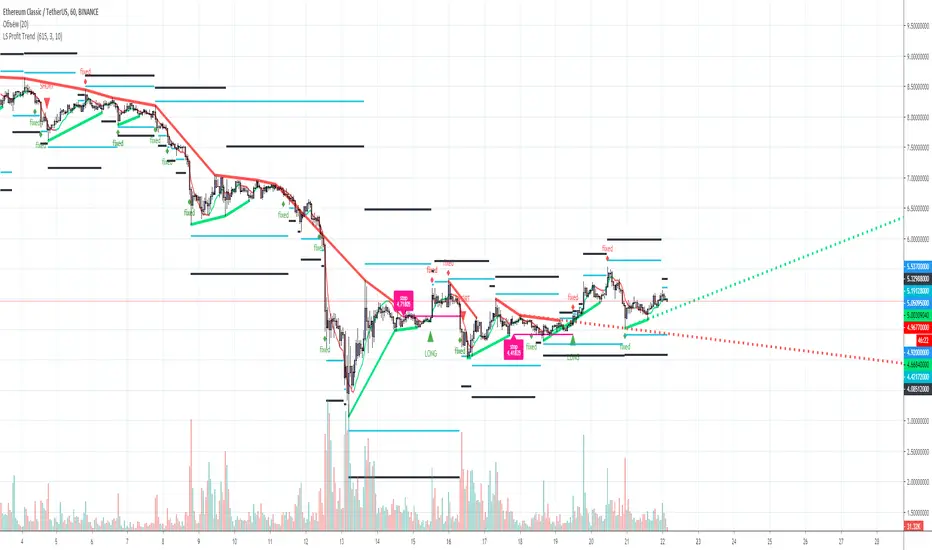
L&S PROFIT SCALP Indicator for scalp trades for TF 1-15 minutes. 1-4 signals per day depending on the currency pair. Suitable for all crypto exchanges, Forex, binary options. Signals+ take profit Levels.

L&S PROFIT TREND Trend indicator for TF from 1 hour and above, for any trading pair, any exchange, binary options. Signals+ Take profit levels. 90% good signal and take profit 1.
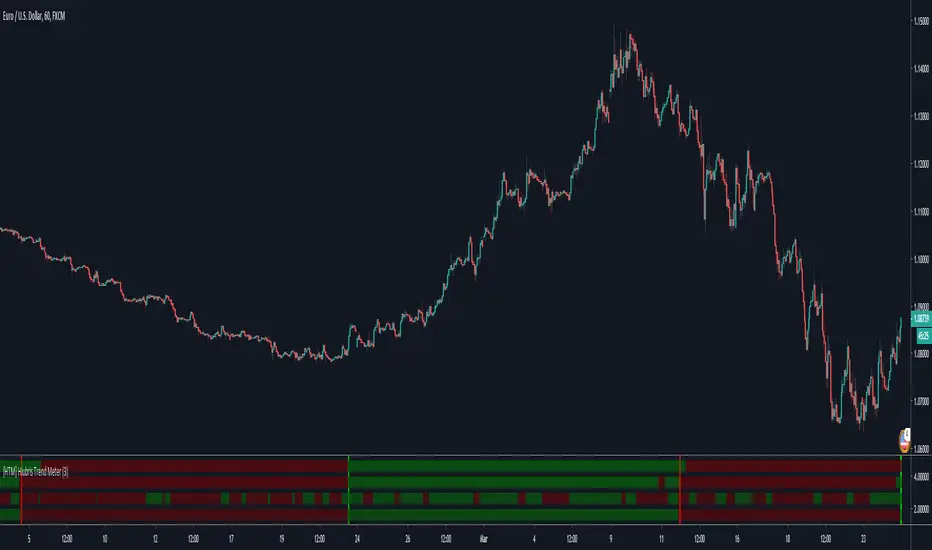
[HTM] Hiubris Trend MeterHOW IT WORKS
This indicator consists of 4 Different Trend Indicators: Gann HILO Activator , Trend Wave Oscillator and 2 Parabolic SAR’s
HOW TO USE
1. When the majority of the meters turn green, it is a sign the market is heading up.
2. When the majority of the meters turn red, it is a sign the market is going down.
- The user has the option to select how many meters must allign for a signal to show
- The indicator also has the ability to setup Alerts when the selected number of meters turn green or red. This feature is also signaled by the red or green vertical lines.
NOTES
This is script is meant to be used as an auxiliary Indicator to confirm your entries, but it is as good on it's own, as you can see in the Backtesting Results
We used the best combination of indicators so you can be sure that, no matter what ticker you're trading (Forex, Stocks or Crypto) - when you get a full green, or full red meter, the price is 100% trending in that direction!
* This indicator does NOT Repaint! None of our published indicators repaint!
ButterflyPattern_ULTRA V1 - auto lines drawing inclusive alerts
HI BIG PLAYERS AROUND THE WORLD,
this script allow to draw automatically lines of Butterfly pattern. The Butterfly pattern is part of Harmonic Pattern.
Parallel to the automatic drawing, the indicator can give signals as soon as the typically Fibonacci extension immediately reached or has been reached. This allows the indicator ButterflyPattern_ULTRA V1 to give early signals. In the default settings, the signals are displayed with a blue background on the chart.
ButterflyPattern_ULTRA V1 is offered for sale. More information can be found below in the signature.
However, anyone can test this indicator for once without any registration in a 3 day trial. You can request access with a simple message to me.
Another trial of 7 days is included in the offer on my website - before the first payment will done.
In the settings it is possible to change the degree of details. This is sometimes necessary because TradingView limited only 55 lines per indicator in Pinescript Version 4.
In extreme cases it is therefore possible to change the settings that the Butterfly pattern represent waves only with 5 lines. This allows the indicator to detect far more Butterfly pattern on the same chart.
For more great indicators everyone is invited to follow me on TradingView.
Kind regards
NXT2017

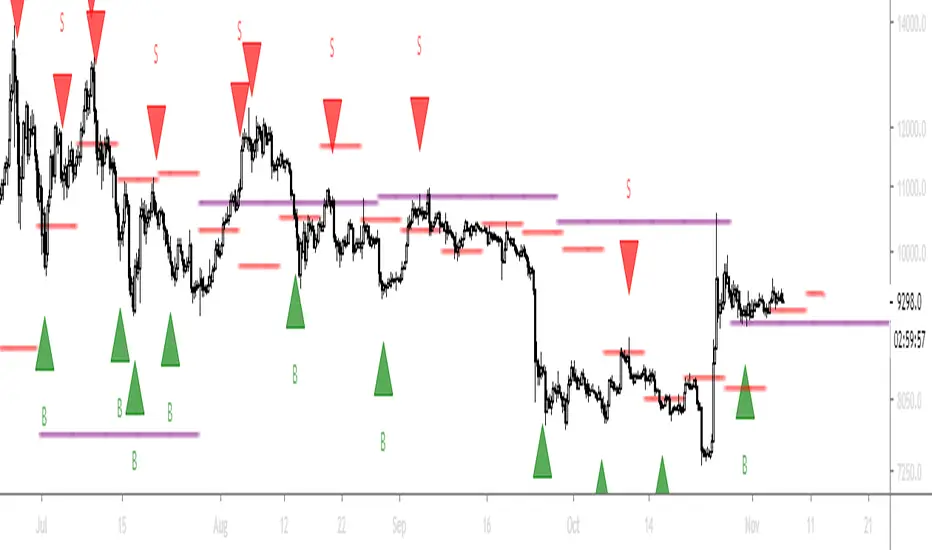
10X Trading System10X Trading System (Non Repaint)
TradingView Account Needed: Free
Not satisfied with your trading results so far? This may help:
The 10X Trading System helps you identify tops, bottoms and market direction — quickly and accurately.
The strategy behind its accuracy is the fact that it combines price action and multiple market timing algorithms to determine these significant turning points in the markets.
That way, you can be sure you have the best chance to get the best entry and exit points with perfect timing, and hopefully extract more profits from the markets than anybody else.
Once the 10X Trading system has spotted a possible top or bottom, it clearly displays these Buy or Sell alerts on your charts… showing you exactly where this may occur.
You can activate alerts to never miss a signal.
How to use the signals and alerts:
10X Trading System automatically analyze price action and multiple market timing algorithms to give you a signal when there's a good trade.
Works on all markets on all time frames so it's suitable for binary, scalping, day and swing trading.
10X Trading System allow you to get the best entry and exit points with perfect timing.
If you want more details, the link is in the signature.
Disclaimer:
Past performance is not indicative of future performance. No representation is being made that any results discussed within the service and its related media content will be achieved. All opinions, news, research, analyses, prices or other information is provided as general market commentary and not as investment advice. TradingWalk, their members, shareholders, employees, agents, representatives and resellers do not warrant the completeness, accuracy or timeliness of the information supplied, and they shall not be liable for any loss or damages, consequential or otherwise, which may arise from the use or reliance of the TradingWalk service and its content. © 2019 TradingWalk.
TradingWalk indicators are built for TradingView. TradingWalk is on no way a part of TradingView.
RSI with an Opinion (UO)This RSI has a very clear idea about when to buy and sell. It plots buy and sell signals. It is an expert system. Yes, of course, it can make some errors. You should have used stop-loss

Trend Pulse Pro V2Trend Pulse Pro V2 (Non Repaint)
TradingView Account Needed: Free
You don't need to be an expert to use Trend Pulse Pro.
Just follow the signals and that's all and use simple Fibonacci levels to find stop loss and take profit!
You can increase the win rate even more by following some simple technical analysis, for example, when trend breaks (price break signal level) you can use that as support become resistance level (sell) or resistance becomes support (buy):
No complex things. No waste of time.
And although you won't win 100% of the trades (no signals can guarantee that), your trading will surely improve a lot!
Even someone with almost no trading experience can read the simple trading rules given in the included user guide, watch the how-to videos and follow Trend Pulse Pro’s signals to consistently make smarter trades.
With Trend Pulse Pro you will get accurate buy and sell signals every time there is a new trading opportunity so that you never miss any big price movements and makes your trading both easier and more profitable.
How to use the signals and alerts:
Trend Pulse Pro automatically analyze trend and price action to give you a signal when there's a good trade.
These trend signals and alerts are derived from live data but the stability of our code allows it to not repaint.
Trend Pulse Pro allow you to easily determine the trend and will give you buy and sell entry levels.
Works on all markets on all time frames so it's suitable for scalpers, day and swing traders.
If you want more details, the link is in the signature.
Disclaimer:
Past performance is not indicative of future performance. No representation is being made that any results discussed within the service and its related media content will be achieved. All opinions, news, research, analyses, prices or other information is provided as general market commentary and not as investment advice. TradingWalk, their members, shareholders, employees, agents, representatives and resellers do not warrant the completeness, accuracy or timeliness of the information supplied, and they shall not be liable for any loss or damages, consequential or otherwise, which may arise from the use or reliance of the TradingWalk service and its content. © 2019 TradingWalk.
TradingWalk indicators are built for TradingView. TradingWalk is on no way a part of TradingView.

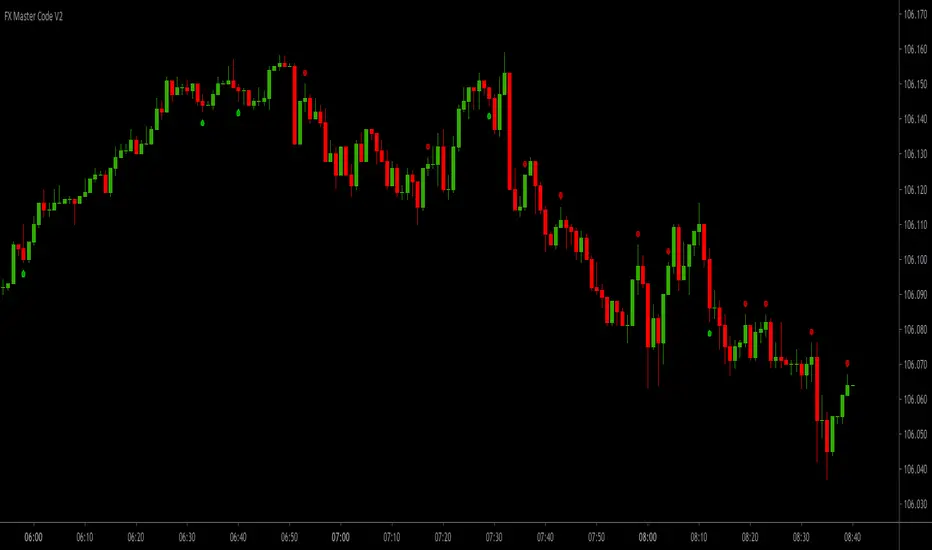
FX Master Code V2FX Master Code V2 (Non Repaint)
TradingView Account Needed: Free
Are you making the making the kind of results you want from trading right now?
Well, if the answer's no, then read this!
Even if you're a complete beginner in trading or an experienced trader, you can use these signals and alerts to start making great results.
The main goal of trading the 1-minute time frame is to make a profit through buying or selling currency pairs by holding a position for a very short period of time, and closing it for a profit.
FX Master Code will give you signals based on my proven and profitable 1-minute trading strategy.
You should be aware that this strategy will demand a certain amount of time and concentration. If you are not able to dedicate at least one hour a day to trade this strategy, then trading the 1-minute chart might not be the best strategy for you.
This is a day trading strategy suitable scalpers and binary options traders, as it involves opening a buy or sell position, gaining a few pips, and then closing the position 3 candlesticks after the signal (3 minute expiration time for binary options).
The exiting aspect of this is quantity. It is not unusual for traders to place more than +10 trades a day (and the more trades you place, the higher returns you can make).
Why not try FX Master Code and see if this system works for you?
The essence of the system will not allow for high losses. We will help you with risk management, use the best-practice risk and trade management for successful trading we give you with FX Master Code.
FX Master Code can be an extremely effective and profitable strategy – even for those who are beginners or use it purely as a supplementary strategy.
What is even better, using this strategy you are rewarded for quantitative work – the more trading you perform, the higher returns you can make.
If you want more details, the link is in the signature.
Disclaimer:
Past performance is not indicative of future performance. No representation is being made that any results discussed within the service and its related media content will be achieved. All opinions, news, research, analyses, prices or other information is provided as general market commentary and not as investment advice. TradingWalk, their members, shareholders, employees, agents, representatives and resellers do not warrant the completeness, accuracy or timeliness of the information supplied, and they shall not be liable for any loss or damages, consequential or otherwise, which may arise from the use or reliance of the TradingWalk service and its content. © 2019 TradingWalk.
TradingWalk indicators are built for TradingView. TradingWalk is on no way a part of TradingView.
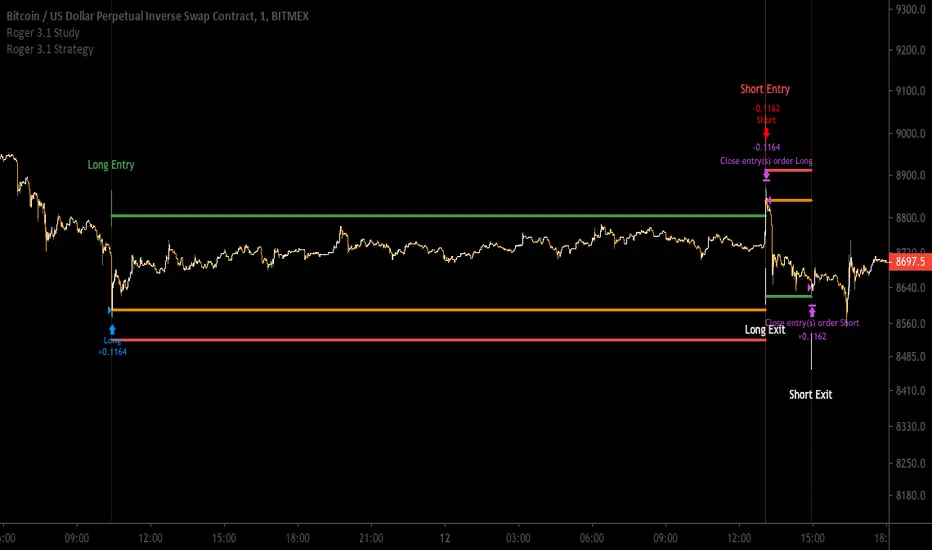
[Aill3urs V.1.1.P] Study RogerThis INVIT-ONLY study is based on Noise / Fixe TP & SL / EMA and you can optimize it with trends and work on low timeframe < 5min
Please use comment section for any feedback.
For any question DM me for any request.
## DISCLAIMER
1. I am not licensed financial advisors or broker dealers. I do not tell you when or what to buy or sell. I developed this software which enables you execute manual or automated trades multiple trades using TradingView. The software allows you to set the criteria you want for entering and exiting trades.
2. Do not trade with money you cannot afford to lose.
3. I do not guarantee consistent profits or that anyone can make money with no effort. And I am not selling the holy grail.
4. Every system can have winning and losing streaks.
5. Money management plays a large role in the results of your trading. For example: lot size, account size, broker leverage, and broker margin call rules all have an effect on results. Also, your Take Profit and Stop Loss settings for individual pair trades and for overall account equity have a major impact on results. If you are new to trading and do not understand these items, then I recommend you seek education materials to further your knowledge.
**YOU NEED TO FIND AND USE THE TRADING SYSTEM THAT WORKS BEST FOR YOU AND YOUR TRADING TOLERANCE.**
**I HAVE PROVIDED NOTHING MORE THAN A TOOL WITH OPTIONS FOR YOU TO TRADE WITH THIS PROGRAM ON TRADINGVIEW.**