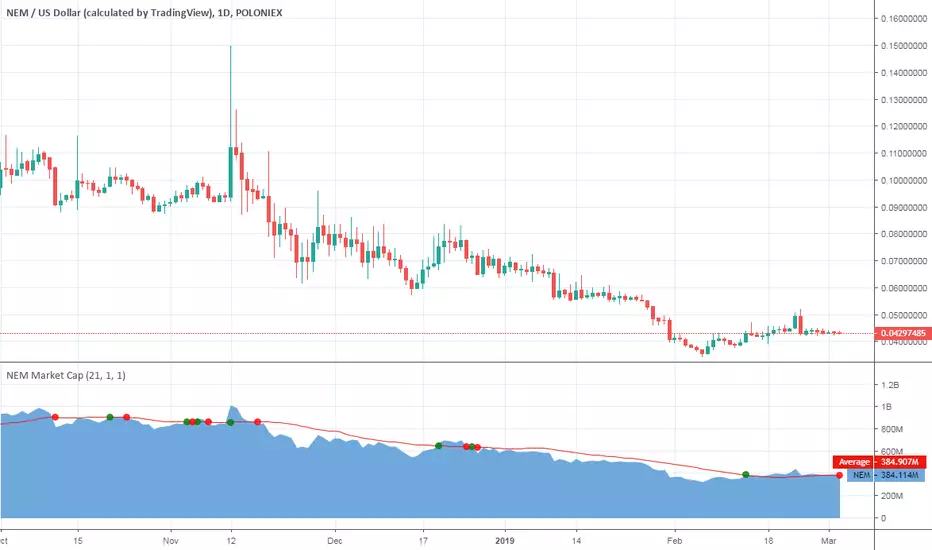
NEM Market CapHello traders!
This is Market Cap chart of NEM cryptocurrency with some features.
What is included
Dynamic market capitalization chart
Customizable SMA of the market capitalization
Crossovers highlighting
Alerts for crossovers
Alert for the specified positive % change
Alert for the specified negative % change
How to get access
Buy for only 20$ to get lifetime access to this indicator
Like and follow for more cool indicators!
Happy Trading!
Signals
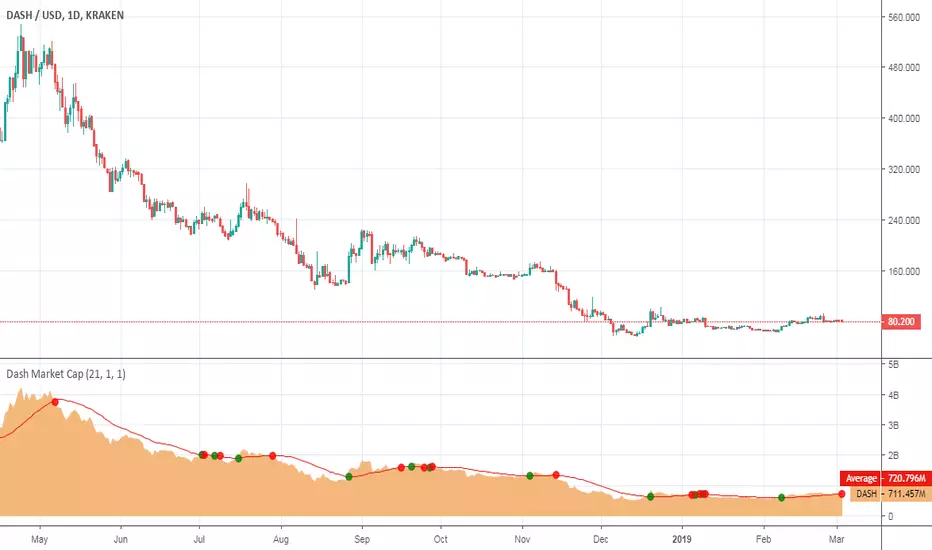
Dash Market CapHello traders!
This is Market Cap chart of Dash cryptocurrency with some features.
What is included
Dynamic market capitalization chart
Customizable SMA of the market capitalization
Crossovers highlighting
Alerts for crossovers
Alert for the specified positive % change
Alert for the specified negative % change
How to get access
Buy for only 20$ to get lifetime access to this indicator
Like and follow for more cool indicators!
Happy Trading!
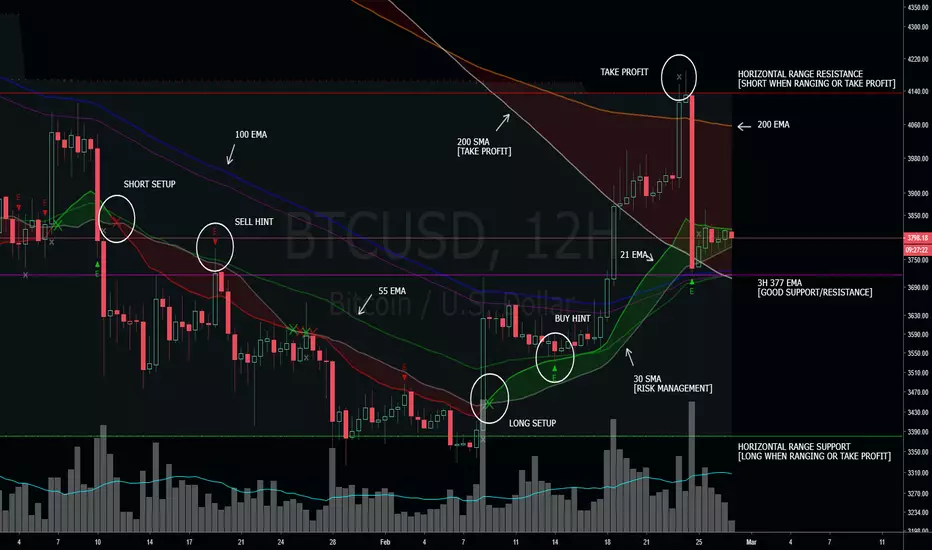
DYNAMIC SUP/RES 3.0Dynamic Support/Resistance 3.0
Features:
4x EMA
2x SMA
Horizontal support/resistance plot
Moving average support/resistance plot
Long/short signals + alerts
Close signals + alerts
Take profit signals + alerts
Ninja EMA Cross 5/8/13This is a short term EMA cross which is used primarily used for the 1HR chart and below perfect for highly volatile markets . Color coded for clear signals and easy to read crossovers strategy. I recommended for crypto currency trading or high volatility markets.
Green over Red= Buy Signal
Red over Green= Sell Signal
Green over White= Uptrend
Red under White= Downtrend

Actionable SignalsBased on Rob Smith from T3Live's "The Strat" system.
Places symbols on inside bars, "Rev Strats", 3-1 "Chicago" setups, "Red Dog Reversals"
Allows creation of alerts for any actionable signal and reversal scenario.
Not recommended for those who have not completed Rob's course.
Dionysus Indicator by ZekisDionysus is a good swing indicator with nice results in any timeframe
Easy to use, you need to adjust the lenght for your needs
Percentlines added for Take Profits and Stop Loss for best results (you can change them as you wish)
Yellow line is the transition from long to shot or entries and exits points
Alerts are enabled
Enjoy!
@ Zekis

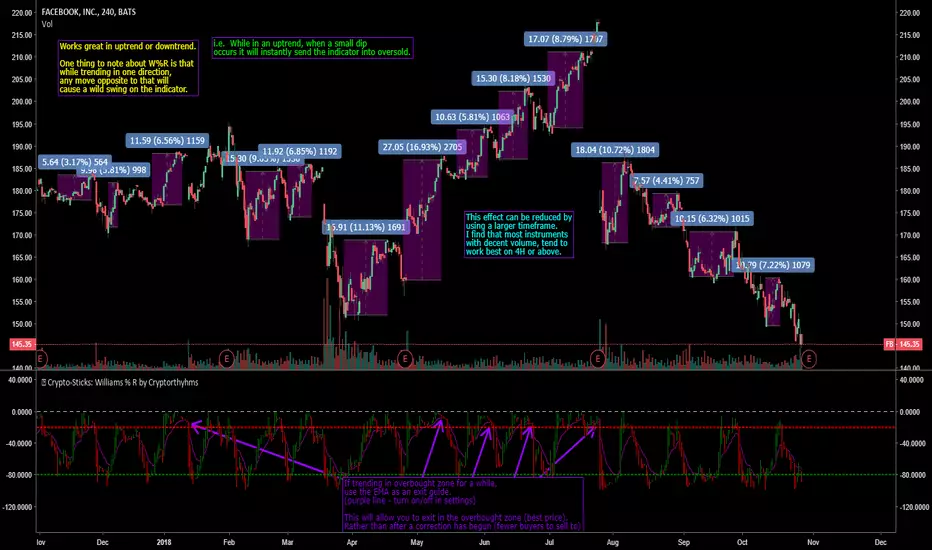
🥢Crypto-Sticks: Williams % R by Cryptorthyhms🥢 Crypto-Sticks™ Williams %R
A new series of indicators brought to you by Cryptorthyhms...giving you an alternate look at your trusted favorites! Follow me, there are still 2 dozen Crypto-Sticks indicators planned - all will be released in public library.
🚀 Indicator Specific Info
New in this indicator is an EMA of the average signal line output. Eventually I will go back and update the previous indicators with this feature as well!
⛔Please remember that you may have to adjust the overbought and oversold levels to suit the volatility of the instrument you are working with. In the future I will implement a feature that does this automatically, but for now its manual.
Heiken Ashi candles (default) adds some more clear trend changing points which can be executed at the second candle going in either direction. Other coins/charts will require their own strategy - you could potentially have to tweak that parameter. In this example you would enter on 2nd green, exit on 2nd red.
Volume weighting the HA candles adds a different dimension to the indicator which I have to explore more fully. With W%R I find it to be an interesting transformation of the output. The indicator tends to stay in overbought ranges longer, and only dips quickly to oversold. The opposite is also true in a downtrend. In this example I would personally increase the overbought zone and decrease the oversold zone to match up better with the historical results. An example of VW+HA:
Enjoying this indicator or find it useful? Please give me a like and follow! There are many more indicators to be released in this series, not to mention I post crypto analysis and other free indicators regularly.
Questions? Comments? Want to get access to an entire suite of proven trading indicators? Come visit us on telegram and chat, or just soak up some knowledge. We make timely posts about the market, news, and strategy everyday. Our community isn't open only to subscribers - everyone is welcome to join.
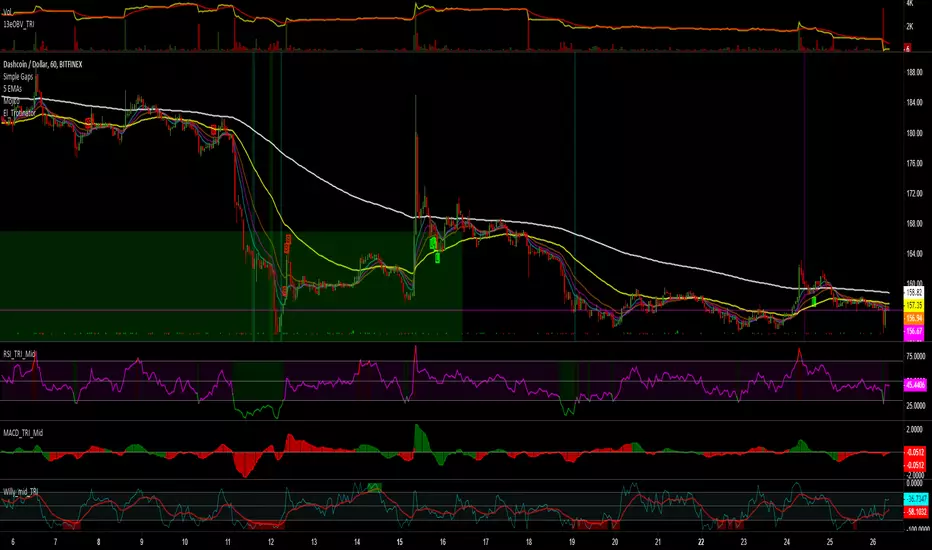
El TrotinatorScript to detect potential reversal zones.
Once you get a signal, hunt for candlestick formations in the direction of the signal.
🥢Crypto-Sticks: Momentum 1.0 by Cryptorthyhms🥢 Crypto-Sticks™ Momentum
A new series of indicators brought to you by Cryptorthyhms...giving you an alternate look at your trusted favorites!
🚀 Indicator Specific Info
Momentum can be a tricky indicator sometimes. Since it doesnt go into predictable overbought or oversold zones, it rather just oscillates around zero - making it harder to create a signals strategy. On the default view I tend to look for 2 candle "flat tops" and "flat bottoms" with one or both containing a decent wick.
Heiken Ashi candles adds some more clear entry exit points which can be executed at the second candle going in either direction (applicable only to this chart on 4H - other coins/charts will require their own strategy). For instance, enter on 2nd green, exit on 2nd red.
Volume weighting the HA candles adds a different dimension to the indicator which I have to explore more fully. Please leave me any ideas or feedback you have!
🚫If using HA or VW+HA, the strategy about "flat candles" doesnt apply anymore.
🚀 Crypto-Sticks General Info
💭This series isnt polished 100%, and I have some more options I will add in the future. But for now, I want to just release them, as I am not sure when I will have the time to put more work into them (many other big projects I am working on).
📊Its basically reinterpretations of all your favorite indicators. I calculate the values a little bit differently than normal, but the end result is creating a candlestick chart (for the indicator!). Then I added the option to plot them as Heiken Ashi candles to smooth out noise and make signaling easier. Here's how it looks as Heiken Ashi:
🔊Lastly I implemented a Volume Weighting system for them all which simply integrates volume into the formulas for these indicators. For the most part this feature is experimental and doesn't provide huge utility (yet - I have other ways I want to try it as well - just no time). Though on some of the indicators it already shows great promise. Here is Volume Weighted + Heiken Ashi:
👍Enjoying this indicator or find it useful? Please give me a like and follow! There are many more indicators to be released in this series, not to mention I post crypto analysis and other free indicators regularly.
💬Questions? Comments? Want to get access to an entire suite of proven trading indicators? Come visit us on telegram and chat, or just soak up some knowledge. We make timely posts about the market, news, and strategy everyday. Our community isnt open only to subscribers - everyone is welcome to join.

Buy and sell signalsThis script identifies when it's a trend and gives you a signal to enter on a pullback
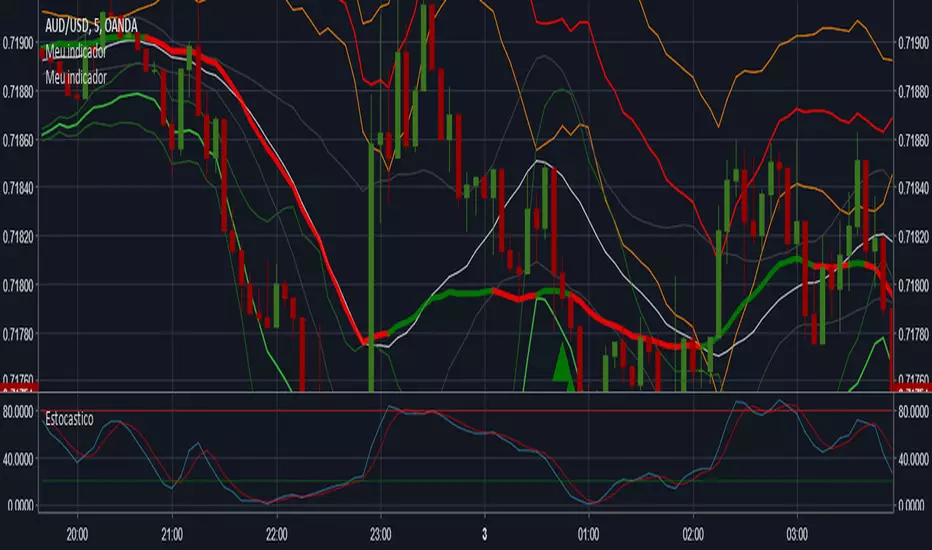
Signals for call and putSorry for the Google Translate English
Indicator for signals of call and put, using Bollinger bands (period 20, standard deviation 2.5), market trend of (sma, períod 100) and stochastic (period 20, %D 3).
I was overthrown but in pine scrip, the function "stoch()" no way to smooth (3). If anyone knows how to smooth inside the script, help me! Please.
With smoothed stochastic the hit rate grows a lot.
Português (Pt-Br)
Indicador de sinais de compra e venda, usando bandas de Bollinger (período de 20, desvio de 2,5), tendencia de mercado com (sma período 100) e estocástico (período 20, %D de 3).
Eu travei porque no pine script, a função "stoch()" não tem como aplicar a suavização (3). Se alguem souber como suavizar dentro do script, me ajude! Por favor.
CCI Highlighted [ankit4349]>> This script is purely based on Commodity Channel Index (CCI) with multiple CCI instances being used within one oscillator.
>> User can use as much as 5 CCI instances/plot within one oscillator.
> How to use :
1. When Bullish :
Whenever CCI length 14 crosses above -100(negative 100) that means bullish momentum is supported.
Best bullish/long entry would be when CCI length 14 crosses above -100(negative 100) as mentioned above and at the same time CCI length
200 is bouncing on top of +100(positive 100).
2. When Bearish :
Whenever CCI length 14 crosses below +100(positive 100) that means bearish momentum is supported .
Best bearish/short entry would be when CCI length 14 crosses below +100(positive 100) as mentioned above and at the same time CCI length
200 is bouncing at bottom of -100(negative 100) .
> Color Clarity :
a. Bullish support is highlighted GREEN and bearish support is highlighted RED within the oscillator background with respect to
Length 1 (i.e 14 by default) .
b. PURPLE is highhighted when Length 5(i.e 200 by default) is bouncing either on top of +100(for bullish) or at bottom of -100(for bearish).
c. AQUA is highlighted when Length 3(i.e 50 by default) is bouncing on top or at bottom of 0 from either side respectively.
d. Best entry in both cases i.e bullish or bearish as mentioned above('How to use') is highlighted WHITE by default.
> Tip:
Just observe the color outputs on any timeframe in a chart as it works fractally on every timeframe , it will help you understand better with
clarity.
> You are always free to experiment with the CCI lengths, change highlighted color and hide/unhide the Lengths as per your requirements in
setting/format .

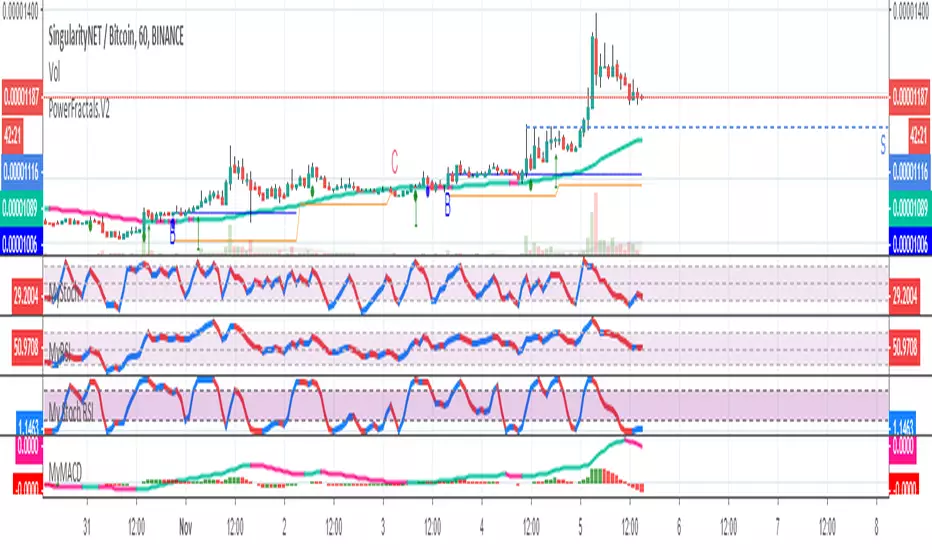
Power FractalsThis script is using fractals and other indicators/formulas to find long entries and exits.
It works best for volatile markets but I found it can work sometimes in ranging markets as well.
Don't take signals against the major trend as it also prints buy entries in bear markets (that are invalidated afterwards)
Librehash Heikin ScalpsThe ZN Heikin Candle Signals is a special indicator that is designed to do two things:
1. Provide all 'new' candles for you.
2. Provide entries and exits.
The purpose of this indicator is to provide a different set of candles that will allow you to see trends in the price data easier by smoothing it over and providing a slightly modified Heikin Ashi candle formula (no, it is not equivalent to the Heikin Ashi formula; i.e., the OHLC/4 for the opening that it commonly uses)
The indicator is fairly straightforward in its design as well, so this description will remain brief for the time being.
Essentially, what we did is create our own candle system. Then we installed buy and sell signals on those candles in order to give users super tight entries and exits.
Simple put, this is a must-have in any trading suite. These candles are not exact replicas of the Heikin Ashi, but rather a clever modification that allows for easier trend reading whilst still allowing you to exit at the tippy top or enter at the very bottom of a trend per the actual prices on the chart.
Here’s one major example:
Here we can see the indicator calling a sell before a major fall and not re-calling it until the precipitous negative price action completely exhausts itself.
Additional Notes
For some charts and time frames, you may need to tinker with the metrics in the control panel slightly (i.e., change the period and also the 'fastener' settings ever so slightly). Make sure to backtest after any and all changes that you make in the control panel and understand that different settings work better in different situations for different coins if you're looking to absolutely optimize this indicator for it to perform its best.
This is not necessary, but something that you all may find helpful as you're trading.
If you have purchased this indicator and you have any additional questions/concerns, please do not hesitate to reach out to me through here or via my other channels I have specified (TradingView does not allow me to post links; you know how to reach me).
Also, if you are interested in purchasing and have not done so yet, please reach out at your earliest convenience.
Thank you.

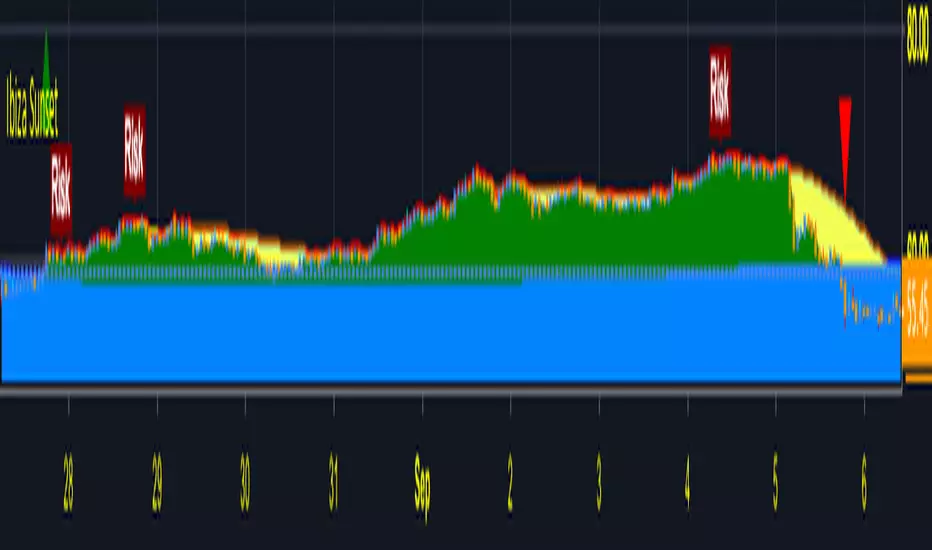
Ibiza SunsetIbiza Island as giving me so much on Holliday With my Ibiza Sunset Strategy. So i decide to share my Ibiza Island Sunset Script !!!
Over the year in ibiza i develop a strategy that has giving me much joy
Ibiza Sunset its a indicator that tells you when a coin its about to emerge from deep underwater .
1 - Ones u see a buy signal ( Green Triangle UP ) coming out from water Then u setup your Long Trade .
2 - Keep climbing the island until u start to see Risk signal (Middle Risk ) or Vertigo signal (Mayor Risk)
º This mean Sunset its about to come so u better be aware of the current situation.
4 - Ones u see the Sunset u can Sell or Short your Position .
º If after Sunset finish you are not underwater then u can buy back and keep uptrend with more coins .
Sit back and relax watching the Sunset making money in some nice part of this Beautiful World xD !
If u like to try the indicator please comment or send me pm !!
Tip: This is a very advanced, yet simple indicator. Take time to tweak the water level, flagpoles, and sunset settings to maximize profit. Watch the video for a tutorial.
Thank for your time and support
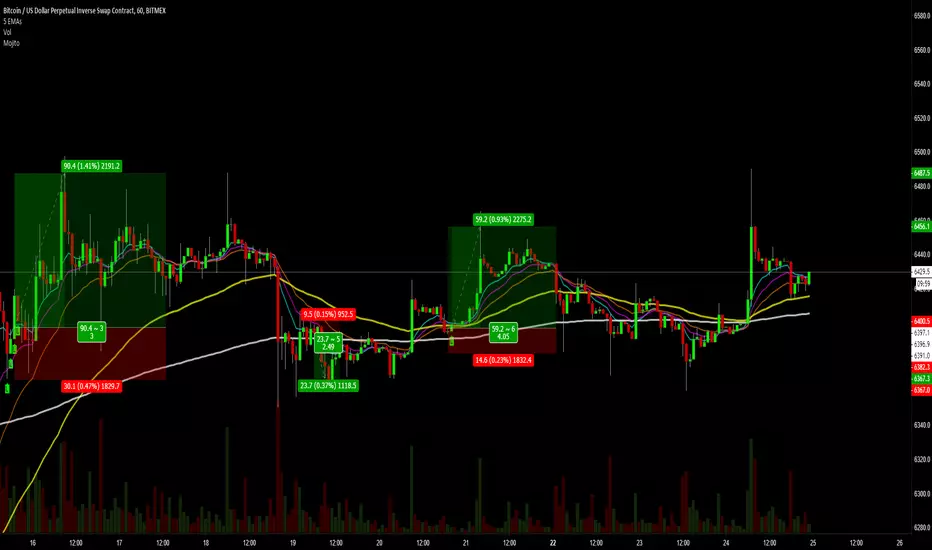
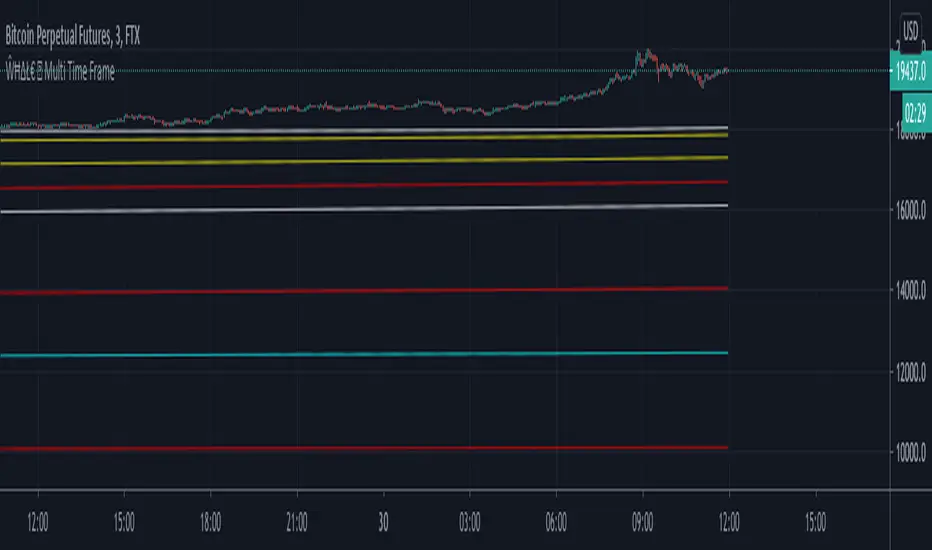
AnunakyAnunaky its our own Bitmex Strategy set to a indicator
Works only on XBTUSD with this settings but who need shit coins if u can leverage BTC 10X
Backtest its from 1 dic 2017 to 1 oct 2018 initial capital 1000$ 10x leverage
indicator will provide Perfect Short Setup and Perfect Long Setup ones you see a signal of short or long just setup your leverage and
sit back and enjoy !!!
Of course u need to have little knowledge about trading and what the indicator does
If u need to start learning or joing out trading group send me PM ! !
Wont give you much signals but the ones that shows you better take them !!
I have Release this indicator just for our Team of Traders
If u are interest in it and want to learn about trading and join out group send me msg
PEace ! !
Trend Trading SystemFeatures:
Buy & Sell signals marked by an arrow on specific candles.
Uptrend & Downtrend market by triangles around screen edges.
Overbought & Oversold areas alert marked by background color & candles color.
Stop loss & Take profit positions reference.

Israr21 [B/S Colors]Israr21(B/S Colors) with Alarms .
Use different tickers of same currency, to know the accurate one giving right time signals. Also use 15 min Charts. You can also change time frame from settings.
Contact me for more info...

Zentrading Trend FollowerOur Trend following indicator is designed to get you in every trend safely, but perhaps most importantly, keeps you out of bad trades.
It performs well on all assets as it captures trending moves.
It does not only provide you with buy or sell signals you have to react on quickly, rather, it shows you when a trade setup is active. In this way you can anticipate the break of the breakout level to enter the trade. A trailing stop loss is used to exit.
It will work on all timeframes, but as lower timeframes add more noise to the market there will naturally be more losing trades than on higher timeframes. We recommend using it on anywhere from the weekly down to 1 or 2 HR -0.44% timeframes.
It is very simple to use:
The shaded areas on the chart indicate that a trade setup has been detected: Green for bullish setups, red for bearish setups.
The blue dots are plotted as the breakout level, if the price breaks this level the trade is entered. (as you can see on the chart, they can sometimes move towards the price!)
Red crosses are plotted as your trailing stop loss, if price breaks the stop loss the trade is closed.
This is a subscription indicator, please pm for information on how to access.
Happy trading!

BitcoinNinjas 'Ninja Signals' Buy/Sell Alert Trading Script v3.0Bitcoin Ninjas 'Ninja Signals' Buy/Sell Alerts & Backtesting TradingView Script v3.0
(for Cryptocurrencies, Forex, GunBot, ProfitTrailer, automatic trading software, and more)
This is version 3 of our popular Ninja Signals trading script, which is similar to version 2, but with a new hard-coded calibration (resolution) setting that automatically matches candle size (period) to ensure that no repainting occurs regardless of the number or type of indicators and filters traders apply when configuring the script.
'Ninja Signals' v3.0 (SCRIPT)
'Ninja Signals' v3.0 (STRATEGY)
'Ninja Signals' v2.0 (SCRIPT)
'Ninja Signals' v2.0 (STRATEGY)
'Ninja Signals' v1.0 (SCRIPT)
'Ninja Signals' v1.0 (STRATEGY)
-Allows users to easily set automated buy and sell alerts on TradingView for use with automatic and manual trading of cryptocurrencies, Forex securities, and more (alerts are compatible with automatic trading software such as GunBot, ProfitTrailer, and more).
-Synthesizes many powerful indicators [e.g. Relative Strength Index (RSI), stochastic RSI, Money Flow Index (MFI), Moving Average Convergence Divergence (MACD), etc.) into one super script to generate very precise buy and sell signals in almost any market condition.
-Buy arrows (blue) and sell arrows (red) can be changed or hidden for ease of viewing.
-No lag EMA trendline featuring trend-reversal color-coding (white uptrend, black downtrend).
-Adjustable ‘calibration’ setting allows users to customize the script to work for any currency or security available through TradingView, on any exchange, simply by adjusting a number.
-Complete with backtesting strategy version of script which allows users to test various buy and sell strategies based on the alerts the script generates (see info and screenshots below).
-Backtesting strategy incorporates a user-defined adjustable date range, so users can estimate the script’s performance over specific periods of time, such as the last day, week, or month.
-Backtesting strategy utilizes a minimum protective gain setting to help you never sell for a loss. Simply adjust your minimum profit (%) per trade, and the test results will update.
-Backtesting strategy allows for pyramid buying to test various average down / double up buying strategies. Simply adjust the number of pyramid buys and the quantity of each buy.
- Free 7-day trial available for TradingView users who join our free BitcoinNinjas community.
-Free 24/7 support via BitcoinNinjas Telegram GunBot support group with script purchase.
-Fully compatible with GunBot automatic trading software (TradingView plugin is required).
-Special discount available for traders who purchase GunBot automatic trading software and the GunBot TradingView plugin from BitcoinNinjas, allowing for fully automatic trading.
-Contact us via Email or Telegram for more information, to request additional / custom screenshots, or to start your free trial.
DISCLAIMER: By using our BitcoinNinjas ‘Ninja Signals’ planning script, you agree to the BitcoinNinjas 'Terms of Use', as presented on our website (www.BitcoinNinjas.org) and as stated here. No sharing, copying, reselling, modifying, or any other forms of use are authorized for our documents, script / strategy, and the information published with them. This informational planning script / strategy is strictly for individual use and educational purposes only. This is not financial or investment advice. Investments are always made at your own risk and are based on your personal judgement. Bitcoin Ninjas is not responsible for any losses you may incur. Please invest wisely.

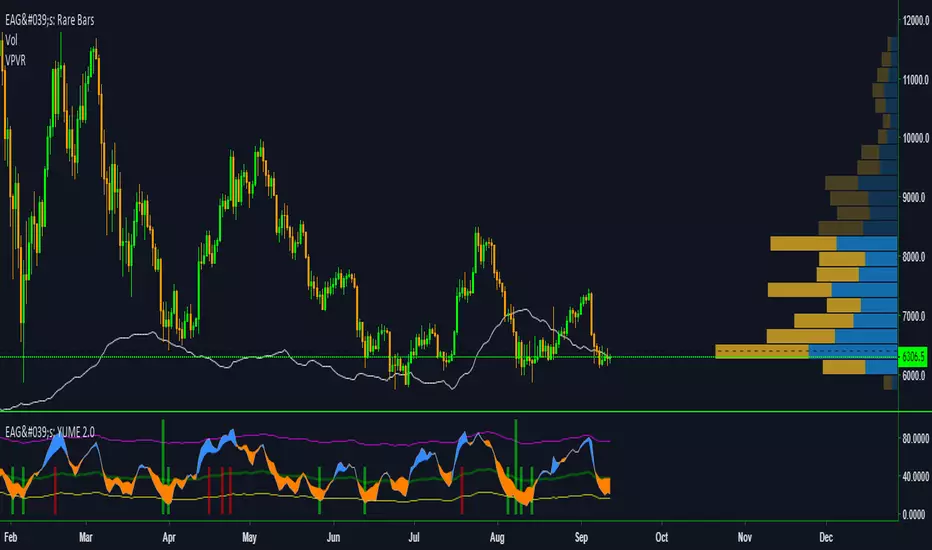
EdgeAnalysisGroup: Yume Wave 2.0This is a upgraded version of the wave with modified parameters for a higher success rate. 3 New Lengths and 75 more lines of code added to the overall algorithm. Also included are 2 sublevel signals based on the Fib MA and pattern trading.
The Wave:
+ The Yume is the Fast length
+ The Akume is the Slow length
+ The Miaku is a median weighted length
+ The Upper Limit is an overbought asset indication
+ The Lower Limit is an oversold asset indication
+ The Wave is the spread between Yume and Miaku
Bullish Indications:
+ The Yume is above the Akume
+ The Yume is above the Miaku
+ The Yume is below the Lower Limit
Bearish Indications:
+ The Yume is below the Akume
+ The Yume is below the Miaku
+ The Yume is above the Upper Limit
Signal Strength Weights:
+ 50 = Yume Wave crossed a Limit Line
+ 100 = Yume Wave crossed a Limit Line + Close to a Fib Moving Average
+ 100 = Edge's Market Bottom/Top Algorithm is marked 'True'
Setting up Signals (Based on a 100 Signal Height):
+ Set the "Bull Signal" to be at 50 or 100
+ Set the "Bear Signal" to be at 50 or 100
+ 50 is Agressive, 100 is Conservative.
+ Bull/Bear are separate so you can play conservative bull with aggressive bear.
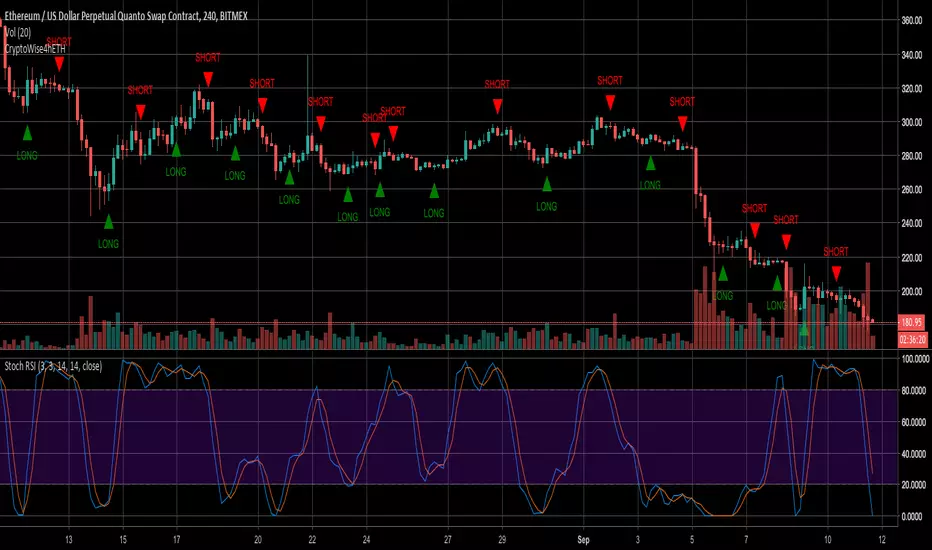
CryptoWise4hETHCrypto Wise 4h ETH Trading Script with Alerts
ETH is very volatile, and that's what makes this script great: Being able to catch the next Move Up or Down.
No repainting.
Better to be used on a 4hr Chart.
No indicator is perfect, but when it gets integrated into a great strategy, and used together with other indicators like the Stoch RSI , you can easily make great trades.
You can get access to the script for $20 / month. Payments accepted in BTC, ETH, LTC, BCH.
72hr Trial given upon request.
LB_MP - Trade AlertsYou must use this indicator on a LineBreak chart.
Alerts
A red bar means go short.
A green bar means go long.
Any yellow bar is a good exit, most likely the first yellow after a trade should be used.
Setting Alerts
You can set alerts by selecting the indicator when you add a new alert.
It will alert a new long position.
It will alert a new short position.
It will alert closing signals.
Honestly, you can probably find better exits on a different chart. But it's still profitable on any time frame of anything you want to trade. Enjoy!!