Indicatore Pine Script®
Simple
Indicatore Pine Script®

Indicatore Pine Script®

Indicatore Pine Script®
Rogers & Satchell Volatility EstimationFirst off, a huge thank you to the following people:
theheirophant: www.tradingview.com
alexgrover: www.tradingview.com
NGBaltic: www.tradingview.com
The Rogers & Satchell function is a volatility estimator that outperforms other estimators when the underlying follows a geometric Brownian motion with a drift (historical data mean returns different from zero). As a result, it provides a better volatility estimation when the underlying is trending. However, the Rogers & Satchell estimator does not account for jumps in price (gaps). It assumes no opening jump. The function uses the open, close, high, and low price series in its calculation and it has only one parameter, which is the period to use to estimate the volatility.
This script allows you to transform the volatility reading. The intention of this is to be able to compare volatility across different assets and timeframes. Having a relative reading of volatility also allows you to better gauge volatility within the context of current market conditions.
For the signal lie I chose a repulsion moving average to remove choppy crossovers of the estimator and the signal. This may have been a mistake, so in the near-future I might update so that the MA can be selected. Let me know if you have any opinions either way.
Want to Learn?
If you'd like the opportunity to learn Pine but you have difficulty finding resources to guide you, take a look at this rudimentary list: docs.google.com
The list will be updated in the future as more people share the resources that have helped, or continue to help, them. Follow me on Twitter to keep up-to-date with the growing list of resources.
Suggestions or Questions?
Don't even kinda hesitate to forward them to me. My (metaphorical) door is always open.
Indicatore Pine Script®
Indicatore Pine Script®
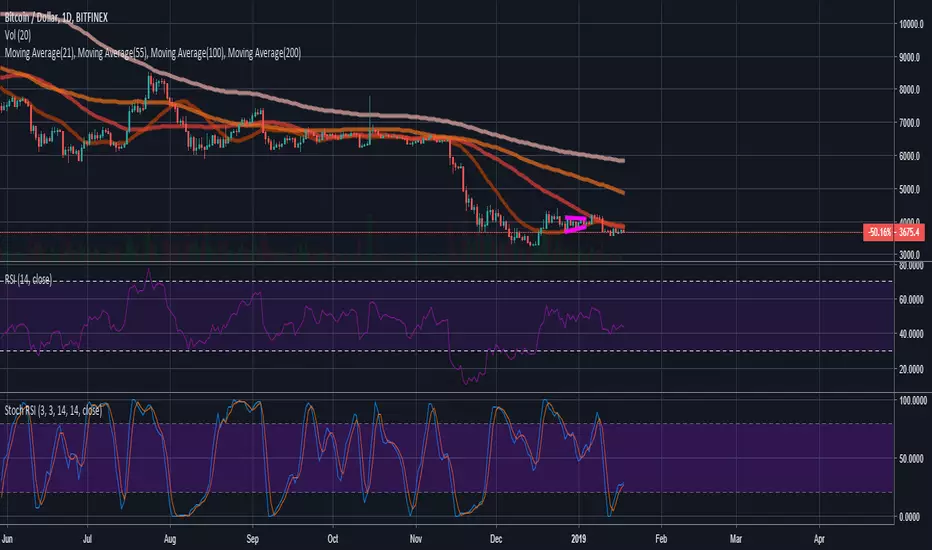
Arkads VisionArkad's Vision is a visual tool used to accurately identify what trend the coin / stock is in. Using Moving average and RSI, it can accurately identify Bullish trends, Bearish Trends, and consolidation.
Bullish Trend = Buy the lows
Bearish Trend = Sell the Highs
Consolidation = Stay out / Be Patient.
The paid version of this script, Arkad's Foresight includes Top and Bottom indicators to trade / swing trade with ease. The paid version is .1BTC or 2ETH. Check it out on my twitter
@CryptoArkad
/// BTC --- 1PSWjCpPXQ3uHjdVUJWR5y2Q6aCa3X8Jog
/// XRP --- rEb8TK3gBgk5auZkwc6sHnwrGVJH8DuaLh TAG 107248818
/// TRX --- TEjoZ3qnGxqZBLAfn7z9iAkhjV79MV3F5h
/// ETH --- 0xf5fb4c8e9ff6bf3f0df1648ab4a355b199611c91
Indicatore Pine Script®

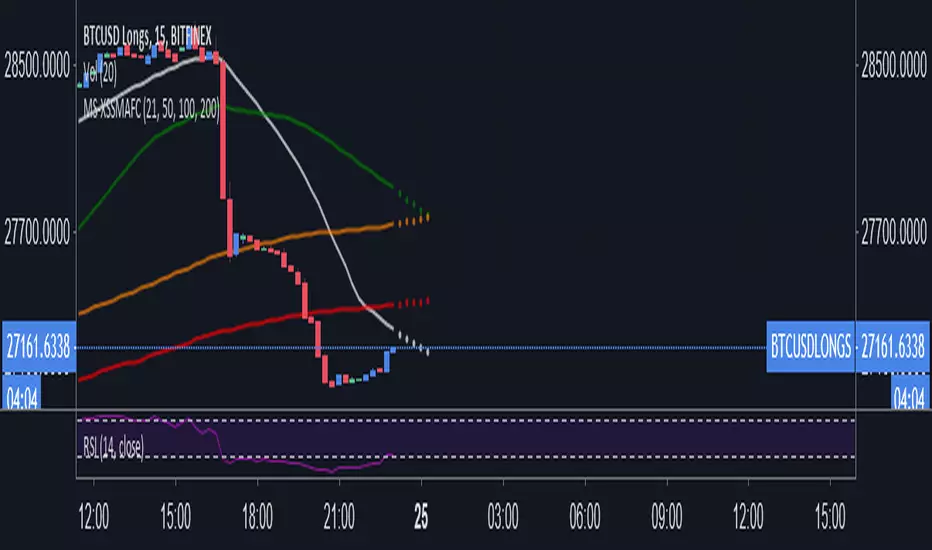
Meister Shredder - Simple Moving Averages x4 ForecastIncludes the 21, 50, 100 and 200 SMA and 6 bar forecast
Indicatore Pine Script®
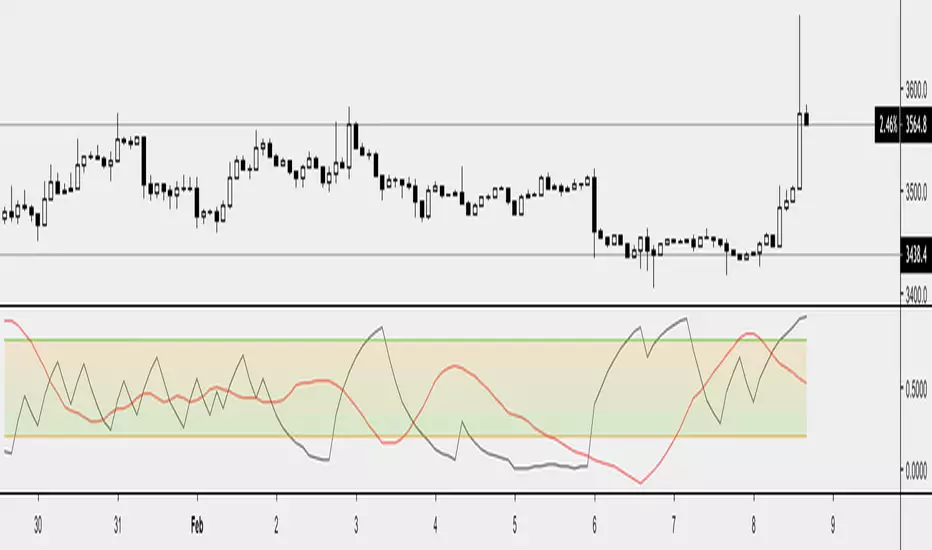
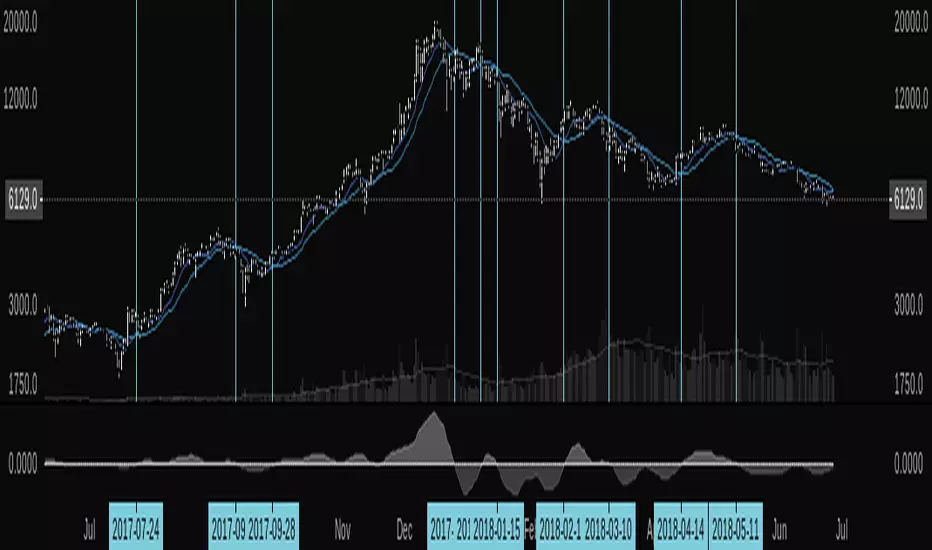
MTF Deviation - Mtrl_ScientistHi everyone,
There are a lot of possible ways to look at markets and find valid patterns.
This time, I've looked at how shorter time frames deviate from the overall price consensus.
What you're seeing here is a range-bound difference of the lowest time frame from the overall price consensus (baseline), represented as blue line.
When lower time frames agree with the baseline, the difference becomes 0.
Logically, this difference cannot deviate too much from the baseline, and to quantify that, I've added fib-levels based on a deviation percentage that depends on price volatility and can be adjusted in the settings.
How it works:
First of all, you need to switch to the 1min time frame to get access to the lowest time frame data.
Look at how the blue line follows the support/resistance fib levels.
Oversold conditions are usually given by entering the lowest red band, whereas overbought conditions are given by entering the upper red band.
However, there are also extreme cases, where the blue line exceeds the set fib levels. In that case, price will reverse with very high likelihood.
Alternatively you can also ping-pong between two fib levels for frequent small trades.
Note that this indicator doesn't use any security functions to access time frame data. Instead, I found a different way to avoid repainting.
At the moment I'm just playing around with this to see how I can improve it. Feedback is very welcome!
Indicatore Pine Script®

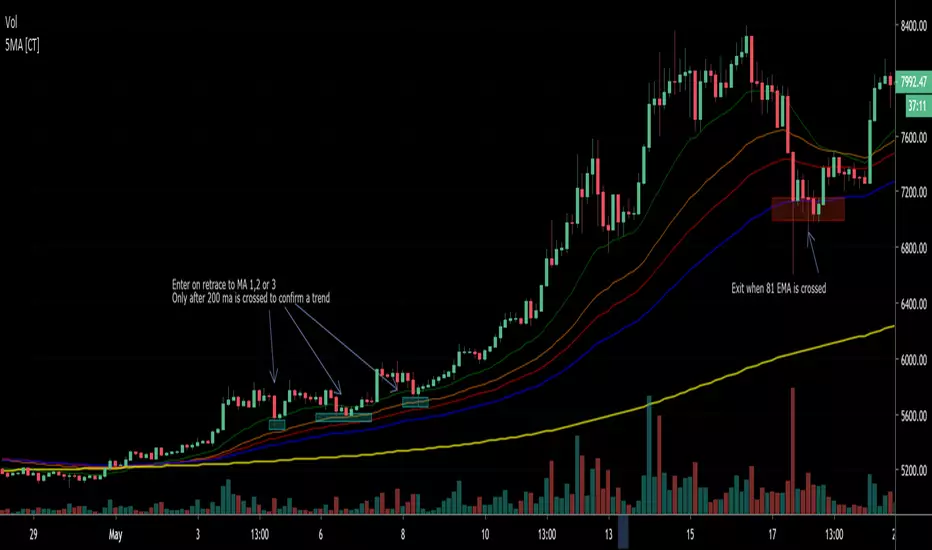
5 Moving Average (Simple / Exponential)Defaults to 1 SMA with 4 EMA bands. 200 SMA is intended to show the trend; 20,40 and 55 EMA show entries; 81 EMA is used as stop/take profit. Defaults are inspired by 'Eric Choe' but you can switch between EMA and SMA as per your own preference. Philakone uses all 5 as EMA 8, 13, 21, 55, 200
Indicatore Pine Script®
15minMAThis script lets you plot a simple or exponential moving average from a specific time frame that you can select. For example, if you always want the Daily 50MA on your chart, regardless of what resolution your chart is on, this will do it. It's also color coded to show if it's rising or falling.
Indicatore Pine Script®

Octal EMA + SMAThis script gives the most required moving averages in one indicator.
Designed in a better way to make traders experience easier in tradingview.
Gives the traders to find the support and resistance.
Offers better flexibility to the traders to choose their preferred moving averages.
Traders can choose EMA or SMA for every moving average separately.
Hope you like my indicator. Keep trading. Gain profits.
Kindly support me with your likes.
Indicatore Pine Script®

Multiple Moving Averages [clean]Very simple indicator script to display multiple simple moving averages. I know others have made this but they often are too feature-rich and can get cluttered.
Can optionally show a cross when MA 1 crosses MA 3. These are colors such that when MA 1 crosses BELOW MA 3 a red cross is shown, and green when crossing above.
Indicatore Pine Script®

Leeloo Triple Simple Moving AverageAllows you to have three simple moving averages in one indicator.
Indicatore Pine Script®

Indicatore Pine Script®

BitSinais - Simple version of our indicatorSimple indicator with arrows pointing long or short entries.
Works on low time frames for scalping as well as on bigger time frames for position.
It's part of our trading bot. (in development)
Private use. To get access, send me a private message and we can talk about.
//
Versão simples do nosso inicador, com setas indicando entradas long ou short.
Funciona em tempos mais curtos para scalp e em tempos mais longos para position.
É parte do nosso bot, que ainda está em desenvolvimento.
Uso privado. Para ter acesso, me envie uma mensagem no chat privado.
Indicatore Pine Script®

KISS (Free version)This is a very simple (but powerful) script for measuring trend strength. This is the free version that anyone can use. I'll publish soon another version including signals, alarms and variable inputs for a small subscription.
Indicatore Pine Script®

crashm111 3-200 Moving Average RibbonAll the moving averages bewteen 3 and 200 in increments of 5.
with the ability to change colours
and change between simple and exponential.
It provides an easy and fast way to determine the trend direction and possible reversals.
Indicatore Pine Script®

Moving Averages DifferenceSimple indicator for crossing moving averages to identify trend and adjust bias
Indicatore Pine Script®
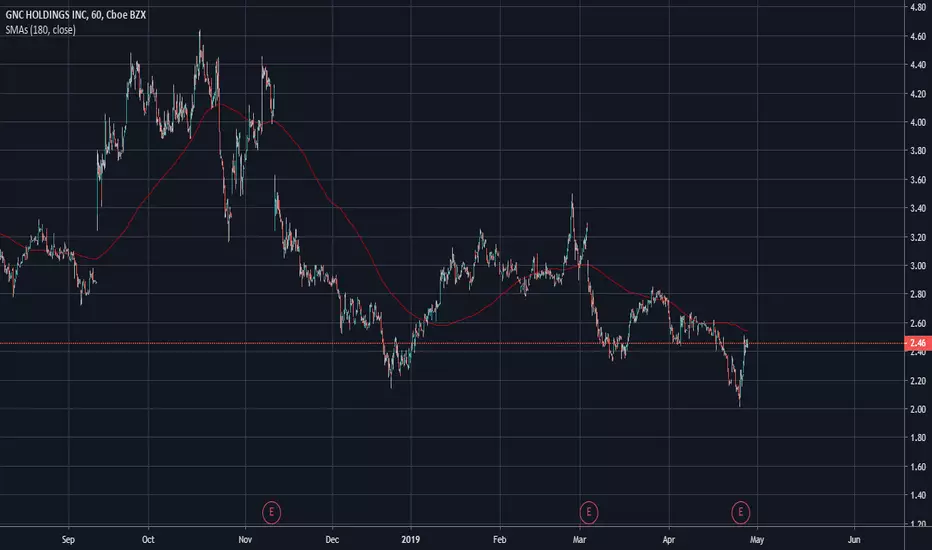
Simple Moving Averages (7, 30, 50, 100, 200)7, 30, 50, 100, 200 simple moving averages, bundled in one indicator (for users who are using the free TradingView service and can only load limited number of indicators at any given time).
You can turn each moving average on or off at will and change the colors.
Indicatore Pine Script®

Binque's Multi-Moving Average Binque's Multi-Moving Average - One indicator with four simple moving average and four exponential moving averages, plus as a bonus a Day High moving average and a Day Low Moving Average.
Simple Moving Average or MA(14), MA(50), MA(100) and MA(200) all in one indicator
Exponential Moving Average or EMA(8), EMA(14), EMA(20) and EMA(33) all in one indicator
Day High Moving Average - Tracks the Daily High versus most moving averages track the daily close.
Day Low Moving Average - Tracks the Daily Low versus most moving average track the daily close.
To Disable moving averages, Set the color to the chart background and then set the length to 1 and uncheck.
I Use the Daily High Moving Average to track upward resistance in a stock movement for Swing Trading.
I Use the Daily Low Moving Average to track my trailing stop in a stock movement for Swing Trading.
Indicatore Pine Script®

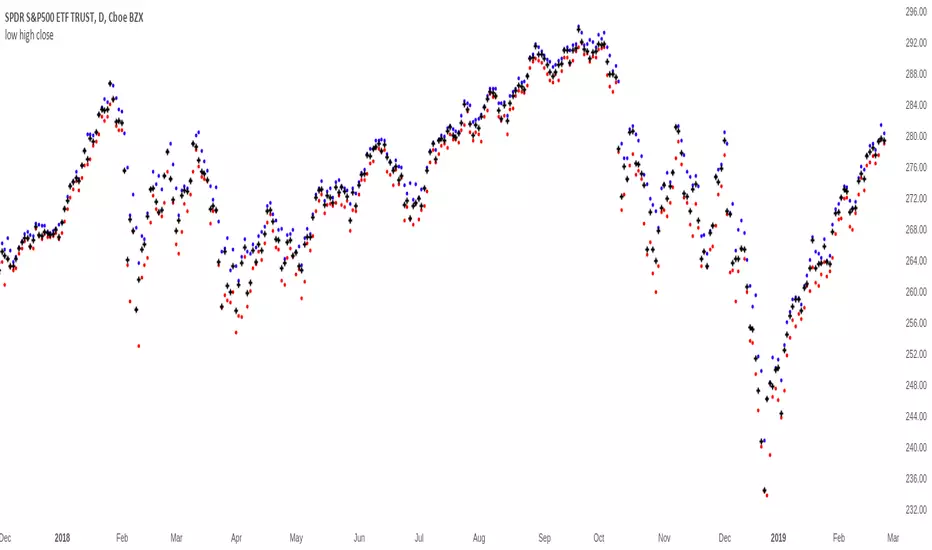
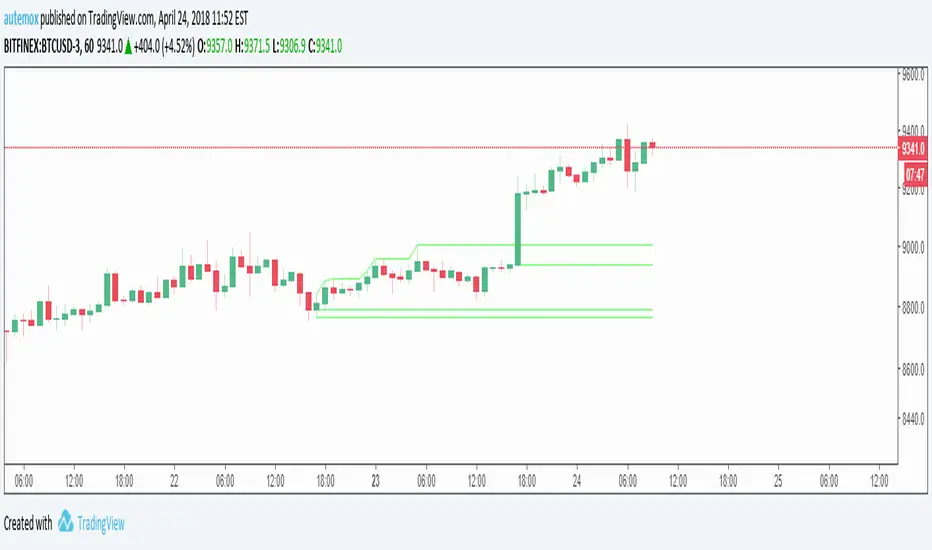
Yesterday Line: Lines at Yesterday's Open, Close, High, and Lowcreated by AutemOx
twitter: @joyrider5
reddit: /u/joyrider5
This creates lines at yesterdays open, close, high, and low. It is pretty amazing use of the timenow and dayofweek variables if I say so myself 8)
Indicatore Pine Script®
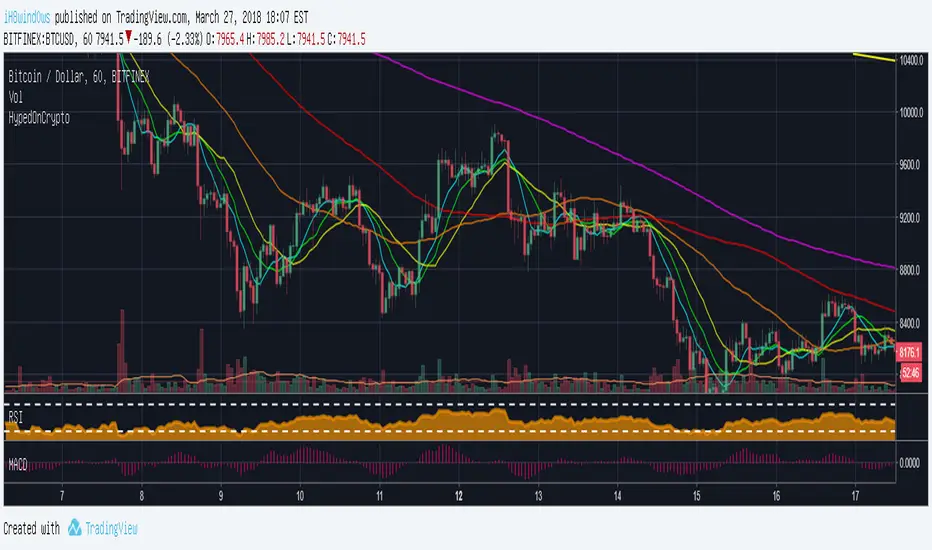
Six Simple Moving Averages by HypedOnCrypto For those who use the free version and want to use more than 3 moving averages.
I wish you all a good Trade.
Indicatore Pine Script®