Crypto momentum strategyThis strategy is based on LazyBear's Squeeze Momentum indicator. It analyzes when the trend in the momentum is shifting, locating the peaks and the valleys, and takes those as sell and buy signals respectively. This is a long strategy, so it also takes into consideration the 50 period Exponential Moving Average to identify upward trends. If the closing price of the candle is above the 50EMA, and the slope of the 50EMA is trending upwards, then the buy signal is executed. If these conditions are not met, the buy signal is ignored.
This strategy works well with crypto trading on the day/week charts.
It has a profit ratio of 4:1 on average, and roughly half of the trades are profitable.
Slope

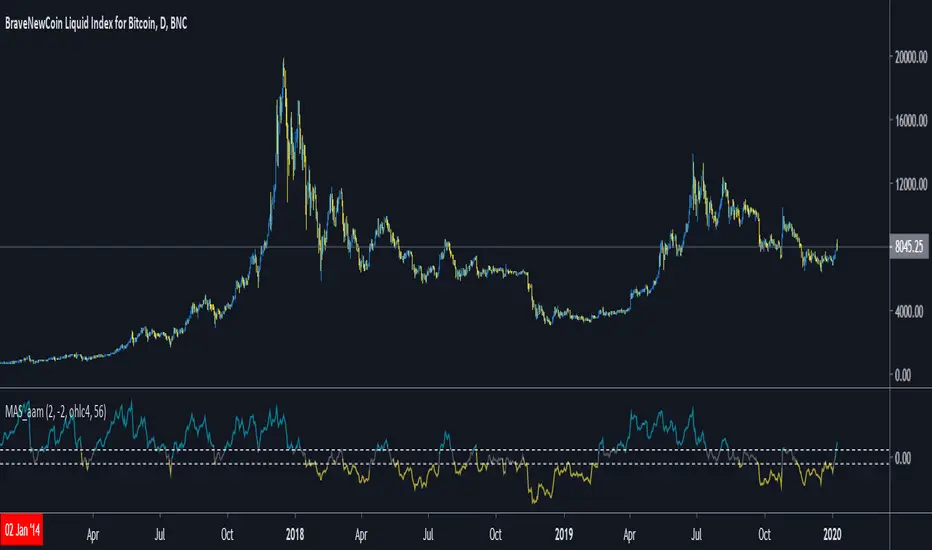
DRSI DMA Scalping Strategy No RepaintThis strategy compares the slope of a Moving Average (of your choosing) to the slope of a Momentum Indicator (of your choosing). Zero is the center line because 0 slope means sideways movement. When both lines cross your buy threshold, it buys. When both lines cross your Sell threshold, it sells. The lines may look choppy, but that is probably because it is referencing a different timeframe than what the chart is set to. I left as many settings adjustable by the user as possible so you can tune this strategy to the relative behavior of whatever you are trading.
This also includes a No Repaint function so the backtest should be as close to live trading as possible.

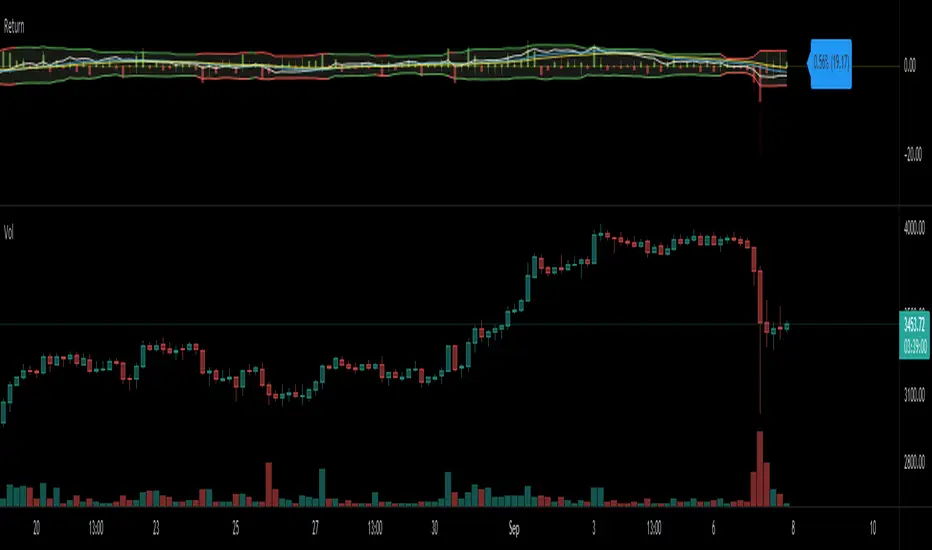
Return (Percent Change)This Script displays Regular or Log Returns as either a line or histogram and labels the current bar.
If something other than price is selected as the source, the result is percent change with a positive or negative slope.
If a moving average of price is used as the source, the result is analogous to a strength index
Other options include a look-back period adjustment (the default is 1),
smoothing results by converting to an EMA, and
Bollinger Bands with Length and Standard Deviation inputs.
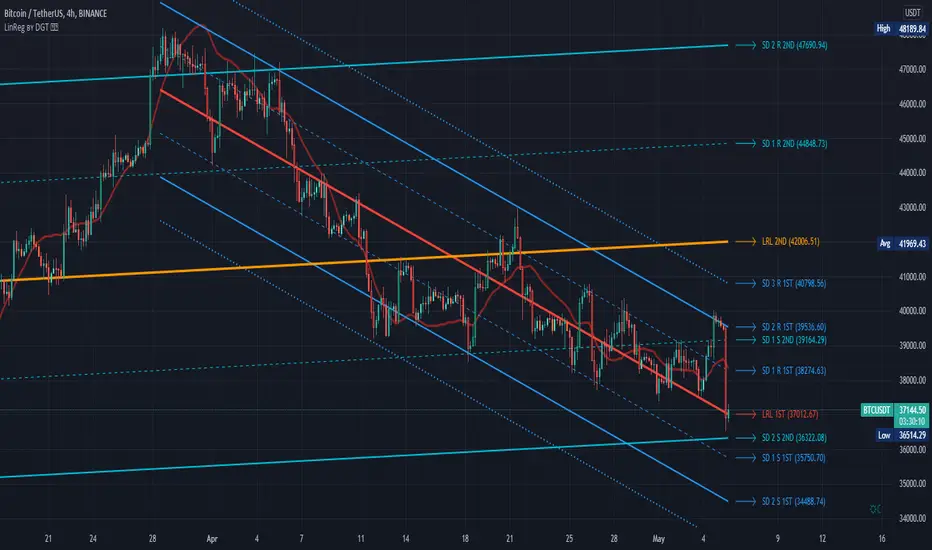
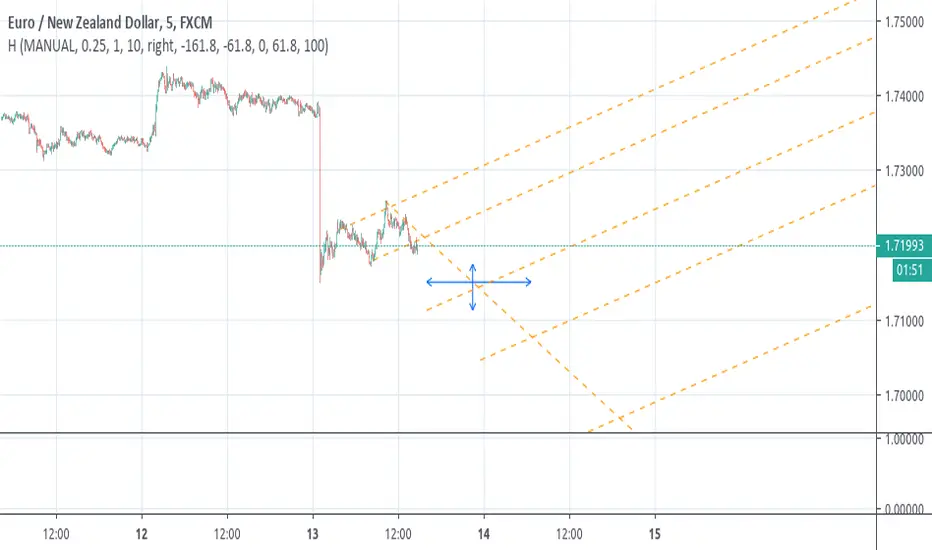
Linear Regression Channel / Curve / Slope by DGTTʜᴇ Lɪɴᴇᴀʀ Rᴇɢʀᴇꜱꜱɪᴏɴ Cʜᴀɴɴᴇʟꜱ
Linear Regression Channels are useful measure for technical and quantitative analysis in financial markets that help identifying trends and trend direction. The use of standard deviation gives traders ideas as to when prices are becoming overbought or oversold relative to the long term trend
The basis of a linear regression channel
Linear Regression Line – is a line drawn according to the least-squares statistical technique which produces a best-fit line that cuts through the middle of price action, a line that best fits all the data points of interest. The resulting fitted model can be used to summarize the data, to predict unobserved values from the same system. Linear Regression Line then present basis for the channel calculations
The linear regression channel
2. Upper Channel Line – A line that runs parallel to the Linear Regression Line and is usually one to two standard deviations above the Linear Regression Line.
3. Lower Channel Line – This line runs parallel to the Linear Regression Line and is usually one to two standard deviations below the Linear Regression Line.
Unlike Fibonacci Channels and Andrew’s Pitchfork, Linear Regression Channels are calculated using statistical methods, both for the regression line (as expressed above) and deviation channels. Upper and Lower channel lines are presenting the idea of bell curve method, also known as a normal distribution and are calculated using standard deviation function.
A standard deviation include 68% of the data points, two standard deviations include approximately 95% of the data points and any data point that appears outside two standard deviations is very rare.
It is often assumed that the data points will move back toward the average, or regress and channels would allow us to see when a security is overbought or oversold and ready to revert to the mean
please note : Over time, the price will move up and down, and the linear regression channel will experience changes as old prices fall off and new prices appear
█ Linear Regression Study Features
Linear Regression Channel
- Linear regression line as basis
- Customizable multiple channels based on Standard Deviation
- ALERTs for the channel levels
Linear Regression Curve
- Linear regression curve as basis
- Optional : Bands based on Standard Deviation or Volatility (ATR). Bands are applied with fixed levels 1, 2 and 3 times StdDev or ATR away from the curve
Linear Regression Slope
- Optional : Up/Down slope arrows for a used defined period
█ Volume / Volatility Add-Ons
High Volatile Bar Indication
Volume Spike Bar Indication
Volume Weighted Colored Bars
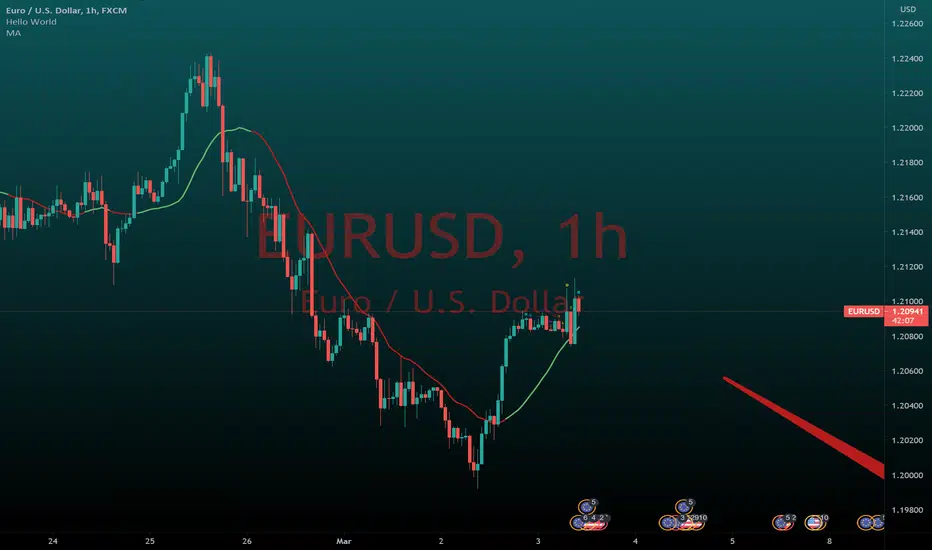
Moving Average Slope to determine market directionMoving Average Slope is a straightforward but also a handy indicator.
By inserting this moving average, it is possible to glance at the direction of the trend.
When the moving average has an increasing angle, it will turn green; vice versa, it will be colored red.
It is a trend indicator; I recommend leaving the period at 20 because it includes the last four trading weeks.
If you found this indicator useful, please like it
Repeated Median Regression ChannelThis script uses the Repeated Median (RM) estimator to construct a linear regression channel and thus offers an alternative to the available codes based on ordinary least squares.
The RM estimator is a robust linear regression algorithm. It was proposed by Siegel in 1982 (1) and has since found many applications in science and engineering for linear trend estimation and data filtering.
The key difference between RM and ordinary least squares methods is that the slope of the RM line is significantly less affected by data points that deviate strongly from the established trend. In statistics, these points are usually called outliers, while in the context of price data, they are associated with gaps, reversals, breaks from the trading range. Thus, robustness to outlier means that the nascent deviation from a predetermined trend will be more clearly seen in the RM regression compared to the least-squares estimate. For the same reason, the RM model is expected to better depict gaps and trend changes (2).
Input Description
Length : Determines the length of the regression line.
Channel Multiplier : Determines the channel width in units of root-mean-square deviation.
Show Channel : If switched off , only the (central) regression line is displayed.
Show Historical Broken Channel : If switched on , the channels that were broken in the past are displayed. Note that a certain historical broken channel is shown only when at least Length / 2 bars have passed since the last historical broken channel.
Print Slope : Displays the value of the current RM slope on the graph.
Method
Calculation of the RM regression line is done as follows (1,3):
For each sample point ( t (i), y (i)) with i = 1.. Length , the algorithm calculates the median of all the slopes of the lines connecting this point to the other Length -1 points.
The regression slope is defined as the median of the set of these median slopes.
The regression intercept is defined as the median of the set { y (i) – m * t (i)}.
Computational Time
The present implementation utilizes a brute-force algorithm for computing the RM-slope that takes O ( Length ^2) time. Therefore, the calculation of the historical broken channels might take a relatively long time (depending on the Length parameter). However, when the Show Historical Broken Channel option is off, only the real-time RM channel is calculated, and this is done quite fast.
References
1. A. F. Siegel (1982), Robust regression using repeated medians, Biometrika, 69 , 242–244.
2. P. L. Davies, R. Fried, and U. Gather (2004), Robust signal extraction for on-line monitoring data, Journal of Statistical Planning and Inference 122 , 65-78.
3. en.wikipedia.org

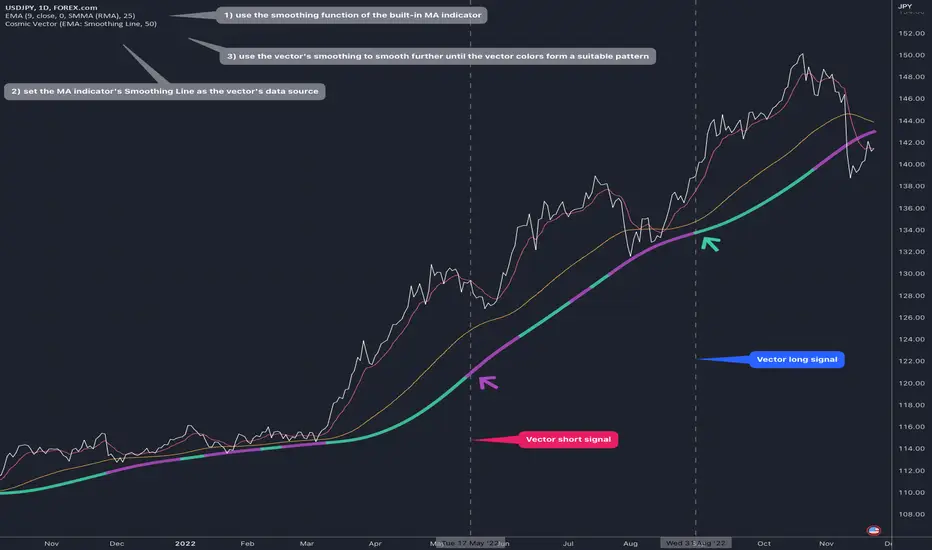
Cosmic VectorThis indicator will copy a moving average's plot and show whether its angle vector is negative or positive. In other words, it will show when the moving average starts to "accelerate" / "decelerate".
To use:
Add any moving average indicator to the chart
Click that indicator's More > Add Indicator on (MA)
Select the Cosmic Angle Gravity indicator
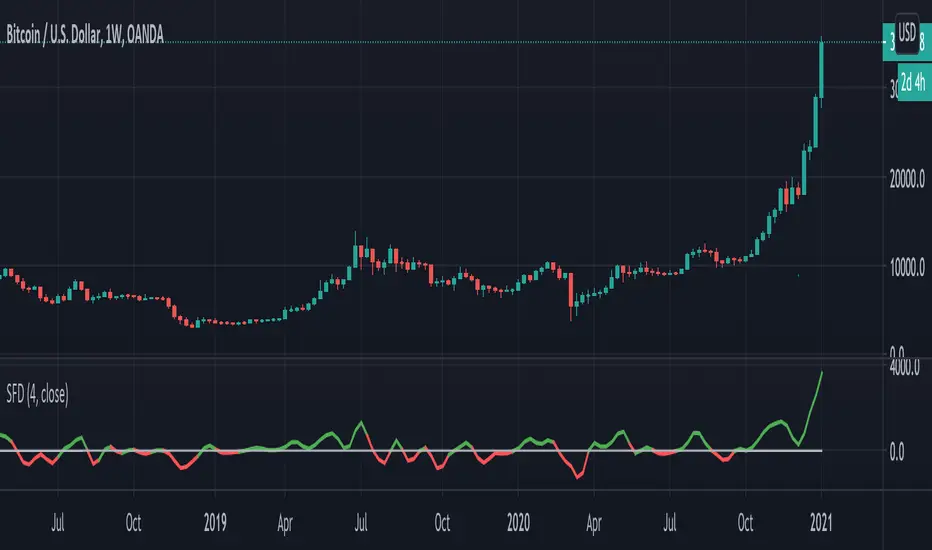
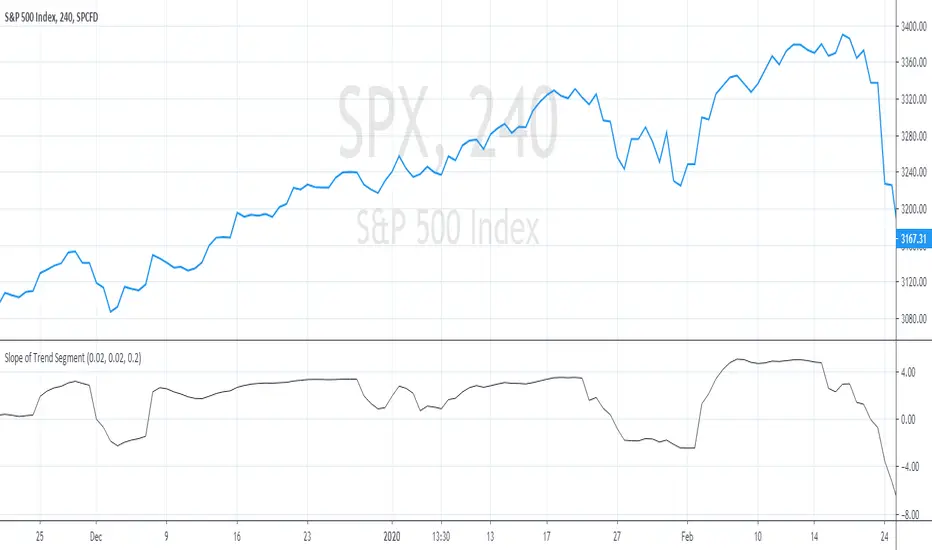
Smooth First Derivative IndicatorIntroducing the Smooth First Derivative indicator. For each time step, the script numerically differentiates the price data using prior datapoints from the look-back window. The resulting time derivative (the rate of price change over time) is presented as a centered oscillator.
A first derivative is a versatile tool used in functional data analysis. When applied to price data, it can be applied to analyze momentum, confirm trend direction, and identify pivot points.
Model Description:
The model assumes that, within the look-back window, price data can be well approximated by a smooth differentiable function. The first derivative can then be computed numerically using a noise-robust one-sided differentiator. The current version of the script employs smooth differentiators developed by P. Holoborodko (www.holoborodko.com). Note that the Indicator should not be confused with Constance Brown's Derivative Oscillator.
Input parameter:
The Bandwidth parameter sets the number of points in the moving look-back window and thus determines the smoothness of the first derivative curve. Note that a smoother Indicator shows a greater lag.
Interpretation:
When using this Indicator, one should recall that the first derivative can simply be interpreted as the slope of the curve:
- The maximum (minimum) in the Indicator corresponds to the point at which the market experiences the maximum upward (downward) slope, i.e., the inflection point. The steeper the slope, the greater the Indicator value.
- The positive-to-negative zero-crossing in the Indicator suggests that the market has formed a local maximum (potential start of a downtrend or a period of consolidation). Likewise, a zero-crossing from negative to positive is a potential bullish signal.
Linear Regression Slope HistogramThis is the slope of linear regression plotted as a histogram. It has a threshold for the slope in case there is a minimum slope amount that the user wants for it to show green or red. The color shows a dim and bright effect depending on the direction of the slope to better show its rise and fall. You can set the length of the slope in the input setting screen.
Some interesting things about linear regression slope that I found out: It kind of looks like the histogram of ADX or the directional movement lines depending on the length used for the slope. According to Tushar Chande, linear regression can be used as an alternative of finding trend direction, although it is hard to say what length to use for it, I haven't been able to figure out a good way to apply it yet. According to Bulkowski, linear regression of the volume can be used with certain chart patterns that he listed to increase their chance of success by taking trades where the linear regression line points towards, so if you use volume as a source on this indicator you can take trades in whatever said direction. Got any other ideas on how to use linear regression? Feel free to let me knows, would gladly appreciate it.

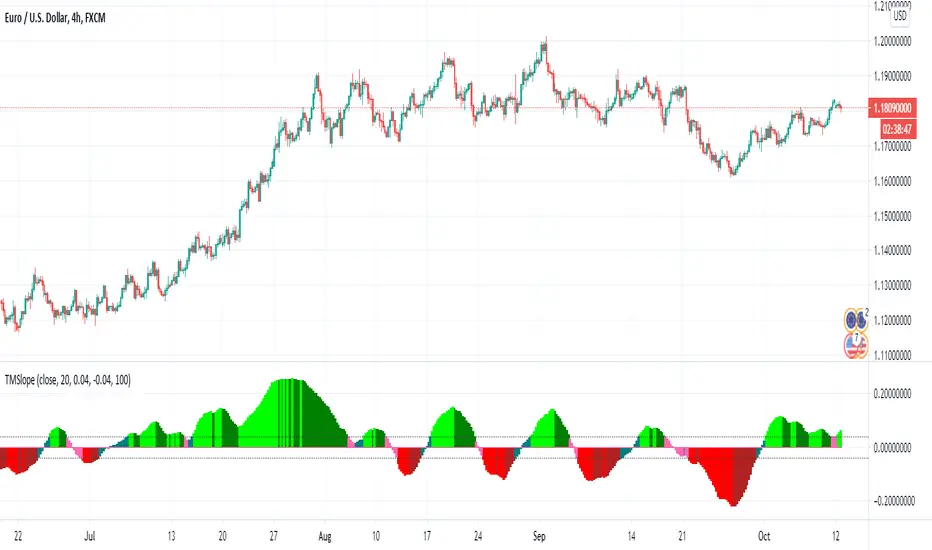
The TMA Slope - TMSlope Oscillator The TMA Slope oscillator is a simple slope of a Triangular Moving Average compared and normalized with the Average True Range of the last 100 periods (default setting).
This specific version add 2 triggers to give trading signals according to the slope:
- Above superior trigger, the trend is bullish, so trading is “Buy”
- Below inferior trigger, the trend is bearish, trading is “Sell”
- If the slope is included between these 2 levels, the market is probably ranging and no new orders should be initiated
3 MA w price slope The MA is indicating historical cost on the market.
This script will help you observe MA with price and slope.
This stript is inspired by LEI & LoneCapital.
All thanks to LEI.

Directional Movement IndexThis is a standard ADX DMI indicator with Background colour and the option to draw the Background colour of the next higher timeframe.

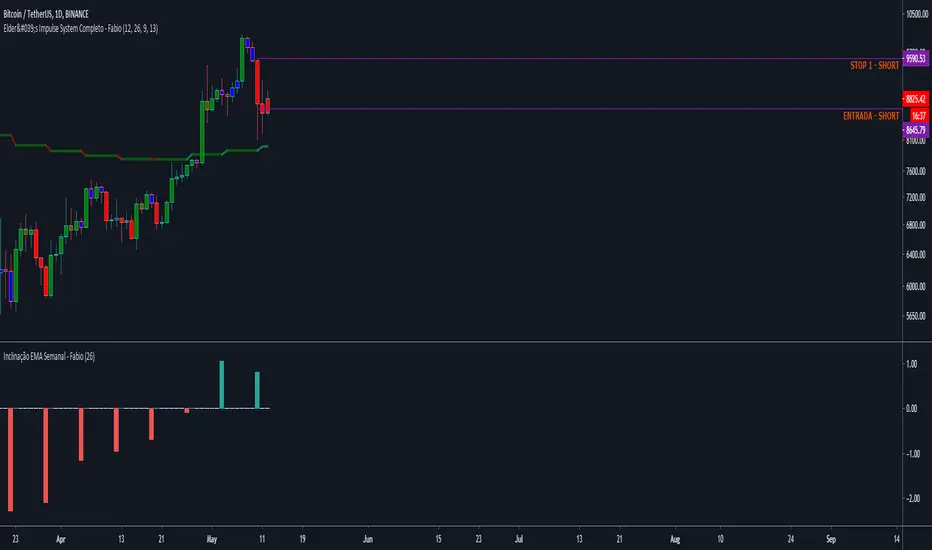
EMA Slope - ValenteThis indicator will show you the EMA SLOPE as a HISTOGRAM.
Este indicador mostra a INCLINACAO da EMA como um HISTOGRAMA

EMA Slope Trend Follower StrategyThis strategy is based on the slope of the EMA130.
Over that slope, the script calculates two EMAs (9,21) which are used to generate the main entry and exit signal.
In particular, the strategy enters a LONG position when EMA9 > EMA21. On the contrary, it closes the LONG and opens a SHORT when EMA9 < EMA21.
When the slope of the EMA130 is rising, it means that the price is accelerating upwards, fueling an uptrend. Conversely, when the slope is falling, it means that the price is slowing down, falling into a possible downtrend.
Calculating and analyzing two EMAs (fast and slow) over the slope of a medium length EMA instead of the price anticipates a lot the signal. In this way, the strategy never miss a trend.
In order to minimize false positives (entering useless positions), I included two filters, which can be optionally turned on:
- Trend Filter: When the price is above EMA200, the strategy opens ONLY LONG positions. If price < EMA200, only shorts allowed. If the slope gives a long signal and price is below EMA200, for example, the eventual SHORT position is closed, but the LONG entry is postponed to the moment when both conditions (slope uptrending and price > ema200) are met.
I recommend always turning on this filter, as it dramatically decreases drawdown.
- Volatility Filter: When the standard deviation of the last 20 candles is below its 50 samples moving average, no positions are opened, as market is going sideways. The purpose of this filter is to prevent false positives (positions which open and close in a matter of candles due to false signals in sideways market).
I recommend turning on this filter only on low time frames.
This strategy works great on medium time frames (like 4h, 6h, daily), since it spends way less in fees, opening less positions.
It works good on low TFs too (up to 1h, didn't test lower ones), provided Volatility filter is turned on and parameters are set according to the asset.
Commission included in calculations: 0.06% (it's the taker commission on BitMEX with the 10% discount obtainable with any referral link)
Slippage included in calculations: 2 ticks (BitMEX has very liquid order books, and slippage doesn't happen very often unless a huge position size is used).

Leavitt Convolutions Multicator - Jay Leavitt, Ph.D.Hot off the press, I present this next generation "Leavitt Convolutions Multicator" employing PSv4.0, originally formulated by Jay Leavitt, Ph.D. for TASC - January 2020 Traders Tips. Basically it's an all-in-one combination of three Leavitt indicators. This triplet indicator, being less than a 60 line implementation at initial release, is a heavily modified version of the original indicator using novel techniques, surpassing Leavitt's original intended design.
Utilizing the "Power of Pine", I included the maximum amount of features I could surmise in an ultra small yet powerful package. Configurations are displayed above in multiple scenarios that should be suitable for most traders.
Features List Includes:
Dark Background - Easily disabled in indicator Settings->Style for "Light" charts or with Pine commenting
AND much, much more... You have the source!
For those of you who are new to Pine Script, this script may also help you understand advanced programming techniques in Pine and how they may be utilized in a most effective manner. Most notably, the script shows how to potentially combine three indicators in one with Pine. This is commonly what my dense intricate code looks like behind the veil, and if you are wondering why there is no notes, that's because the notation is in the variable naming.
The comments section below is solely just for commenting and other remarks, ideas, compliments, etc... regarding only this indicator, not others. When available time provides itself, I will consider your inquiries, thoughts, and concepts presented below in the comments section, should you have any questions or comments regarding this indicator. When my indicators achieve more prevalent use by TV members, I may implement more ideas when they present themselves as worthy additions. As always, "Like" it if you simply just like it with a proper thumbs up, and also return to my scripts list occasionally for additional postings. Have a profitable future everyone!

[RS][V4]ZigZag Percent Reversal - Helper - AntiSlopeEXPERIMENTAL:
A helper script to map the Anti derivative slopes.
EMA slopeA very simple script to get the slope of the EMA.
Can be used together with "Inverse Volatility" and "Support Resistance IV Finder" for optimal results

Moving Average Slope [aamonkey]This indicator tries to identify ranging and trending markets.
It measures the angle of a Moving Average in order to filter out ranging markets.
The idea is to only enter a trend following trade if the slope is steep enough.
In order to create this indicator, I used a strategy script from bennef called "Trend Angle BF" and slightly modified it to transform it from an entry/exit indicator to a filter.
The calculations are based on Evergrets "Jurik MA" and angle calculation by KyJ.
SMA_TKP_TREND SYSTEMI took the "EMA_TKP_TREND SYSTEM" and converted it to plot a simple moving average for the "slow moving average".
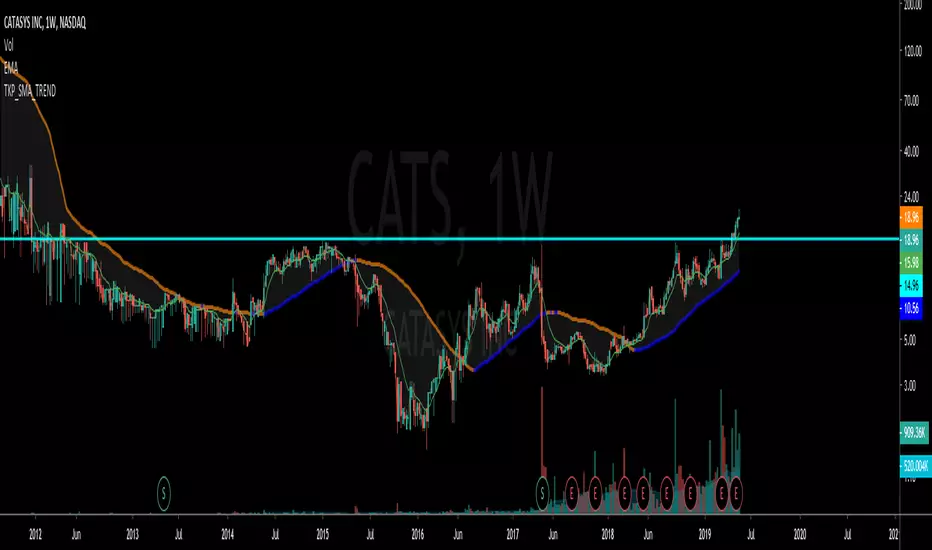
EMA_TKP_TREND_ SYSTEMThis script was cannibalized by another member on here (Kudos given in Script). I trimmed down the script and created this to give a visual representation of the changing slope on exponential moving averages.
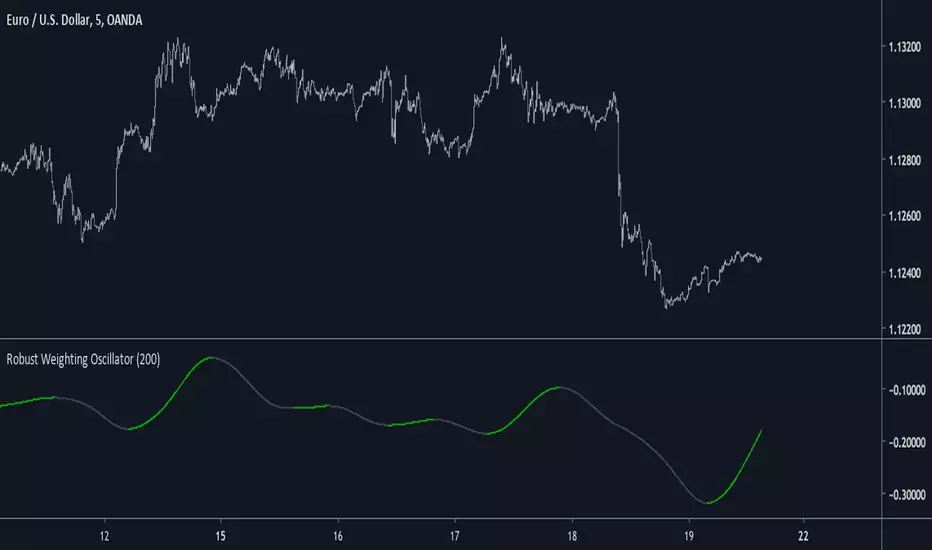
Robust Weighting OscillatorIntroduction
A simple oscillator using a modified lowess architecture, good in term of smoothness and reactivity.
Lowess Regression
Lowess or local regression is a non-parametric (can be used with data not fitting a normal distribution) smoothing method. This method fit a curve to the data using least squares.
In order to have a lowess regression one must use tricube kernel for the weightings w , the weightings are determined using a k-nearest-neighbor model.
lowess is then calculated like so :
Σ (wG(y-a-bx)^2)
Our indicator use G , a , b and remove the square as well as replacing x by y
Conclusion
The oscillator is simple and nothing revolutionary but its still interesting to have new indicators.
Lowess would be a great method to be made on pinescript, i have an estimate but its not that good. Some codes use a simple line equation in order to estimate a lowess smoother, i can describe it as ax + b where a is a smooth oscillator, b some kind of filter defined by lp + bp with lp a smooth low pass filter and bp a bandpass filter, x is a variable dependent of the smoothing span.