Daily/MTF Moving Averages (EMA20, EMA55, SMA50, SMA100, SMA200)Script to plot common daily/alternative timeframe moving averages on when viewing securities at other resolutions.
There's lots of different MA scripts out there, but I couldn't find one that just represented the standard support/resistance indicators that were typical for my markets. So, this is the DIY. :)
Sma100
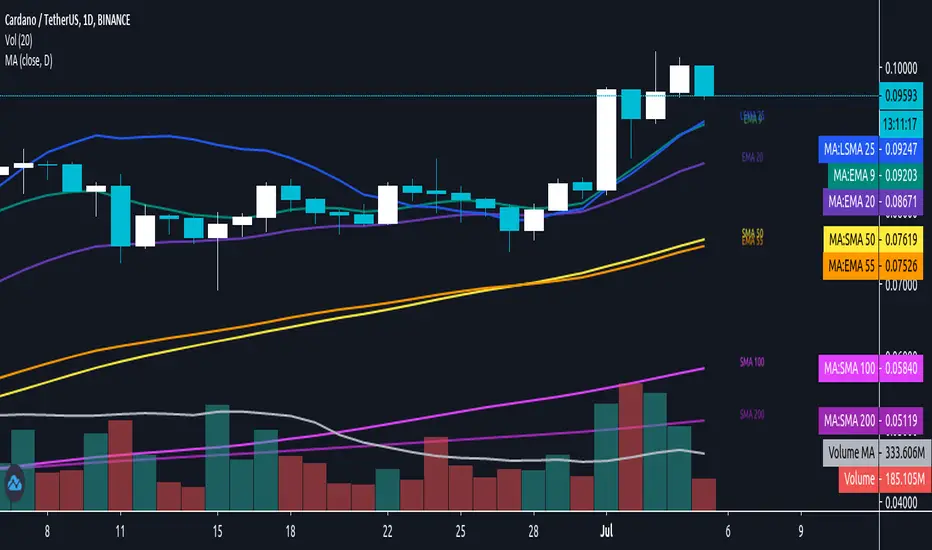
sma 50 100 200 multi Timframes actual daily weekly monthlysma 50-100-200
Just 3 sma from actual,daily,weekly and monthly timeframe
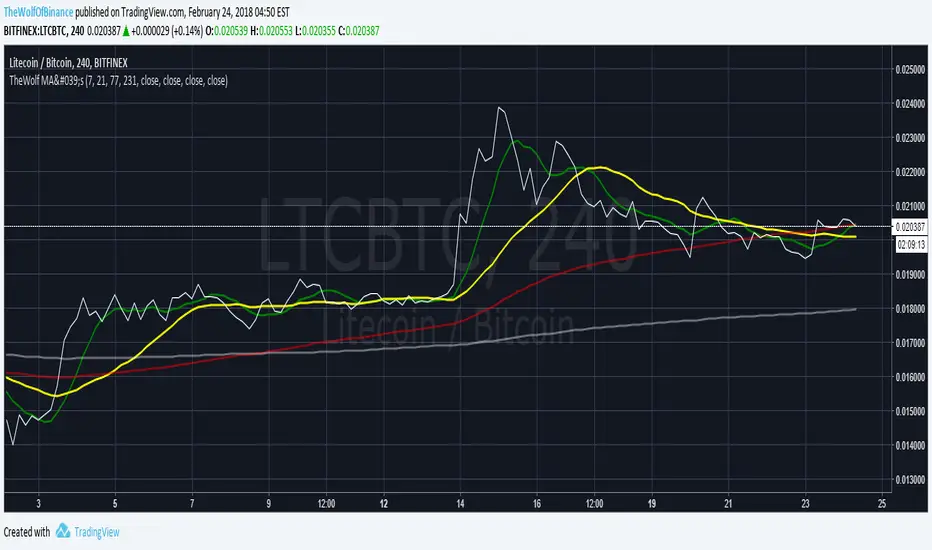
TheWolfOfBinance - Moving Averages - V2This indicator was made to allow four moving averages to be displayed without needing to use up 3 charting indicators individually
4 moving averages
231 (white) shows the trend
77 (red) crosses above 231 (white) buy signal - longterm
7 (green) crosses above 77 (red) buy signal - quick money
7 (green) crosses below 21 (yellow) sell signal - quick money gone
7 (green) crosses below 77 (red) sell signal - quick money gone

TheWolfOfBinance Moving Averages4 moving averages
231 (white) shows the trend
77 (red) crosses above 231 (white) buy signal - longterm
7 (green) crosses above 77 (red) buy signal - quick money
7 (green) crosses below 21 (yellow) sell signal - quick money gone
7 (green) crosses below 77 (red) sell signal - quick money gone