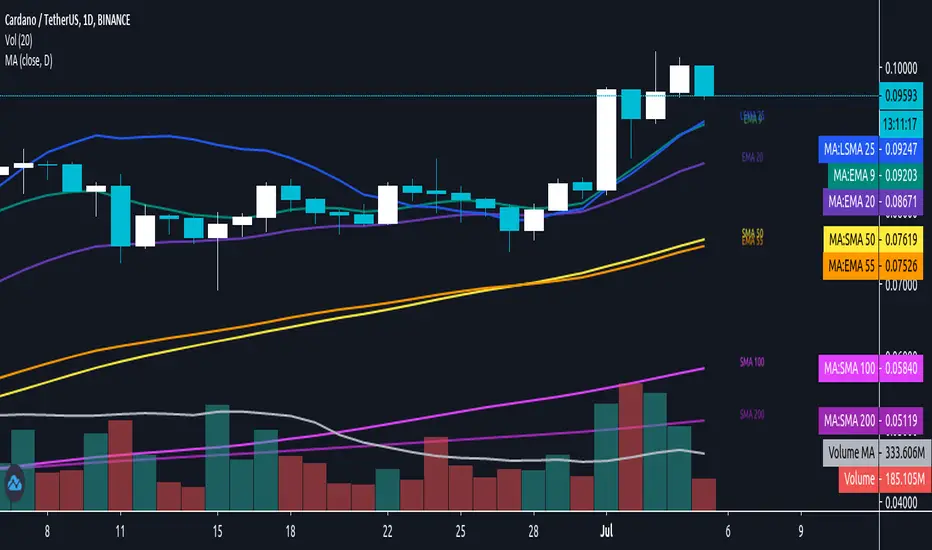
Daily/MTF Moving Averages (EMA20, EMA55, SMA50, SMA100, SMA200)Script to plot common daily/alternative timeframe moving averages on when viewing securities at other resolutions.
There's lots of different MA scripts out there, but I couldn't find one that just represented the standard support/resistance indicators that were typical for my markets. So, this is the DIY. :)
Sma50
sma 50 100 200 multi Timframes actual daily weekly monthlysma 50-100-200
Just 3 sma from actual,daily,weekly and monthly timeframe
SMA colour changeThis SMA will change colour when the price crosses above and below.
When the Price is above, the SMA will be GREEN to indicate you should look for BUY entries.
When the Price is below, the SMA will be RED to indicate you should look for SELL entries.
The default is set to 50 SMA, this can be changed in the settings to suit your requirements.

SMA 50 collector V2Hi everyone
The today script is an upgrade on steroids of my previous SMA 50 collector
Why this script ?
The SMA 50 is known to define a trend. If price is closing above, trend is bullish , if below, trend is bearish.
That's why I like to have all of them in all timeframes on my chart :)
Those are very relevant for all assets class : FOREX, INDEX, STOCKS, CRYPTO, ...
What's the update ?
I added new timeframes and developped a small optimization to get those labels placed on the right hand side of your screen.
"Is it really useful sir ?" Well, you certainly noticed that looking at a chart on tradingview mobile is not ideal (indicators overlapping, indicator names taking too much space and so on...)
When you'll deactivate the indicator name label display from tradingview, you can activate mine which will look way nicer on your mobile (and even Desktop).
This concept was greatly inspired by @scarf :
HOW TO USE IT ?
You can activate/deactivate the SMA50 you (don't) need in the style section of the indicator configuration UI. You'll just have to uncheck/check. Simple right :) ?
See y'all tomorrow for the next indicator or idea. The one for tomorrow should blow your mind as it certainly did when I discovered and optimized it
Enjoy
Dave
