SMC Pro: Institutional Bias & Liquidity Sweep EngineOverview This script is a high-confluence technical analysis tool designed for traders following Smart Money Concepts (SMC) and Price Action methodologies. Its primary objective is to filter trend-based signals (EMA 9/21 crossovers) by integrating two critical institutional filters: HTF Bias (Higher Timeframe Sentiment) and Directional Liquidity Sweeps.
Key Features & Technical Originality Unlike standard crossover indicators, this script introduces a multi-layered institutional validation logic:
Real-Time HTF Bias Dashboard: The indicator automatically calculates the Daily Bias based on the previous close's position relative to the "Equilibrium" (the 50% mark of the previous day's range). This sentiment is displayed via a clean UI dashboard in the top-right corner, ensuring traders stay aligned with the higher timeframe flow.
Directional Liquidity Sweeps: The engine identifies local highs and lows within a dynamic lookback period. A "BUY" signal is only triggered if the price has first performed a "Sweep Low" (raiding sell-side liquidity), and a "SELL" signal only follows a "Sweep High" (raiding buy-side liquidity). This effectively filters out "Bull/Bear Traps."
Adaptive Memory Logic: The signal engine "remembers" a liquidity raid for a configurable number of bars. This allows for natural price development before confirming the entry with the EMA cross, capturing the expansion phase of the move.
Weekly NWOG Anchor: Includes an automated New Week Opening Gap (NWOG) tracker. Following institutional liquidity principles, this box anchors from Friday’s close to the new week’s open. Per user-defined constraints, the projection is limited strictly to the current trading week to maintain chart clarity and relevance.
How to Use
Confluence: Look for "BUY" signals when the Dashboard displays a "BULLISH" Bias and a recent sweep of lows has occurred.
Context: Use the NWOG levels as institutional magnets; price often gravitates toward or rebalances these gaps before continuing its expansion.
Optimized Timeframes: Best suited for M1, M5, and M15 intraday scalping.
Disclaimer This indicator is a visual aid for technical analysis and does not constitute financial advice. Past performance does not guarantee future results.
SMC-ICT

eBacktesting - Learning: PD ArrayseBacktesting - Learning: PD Arrays helps you practice one of the most important “Smart Money” ideas: price tends to react from specific delivery areas (PD Arrays) like Imbalances (FVGs), Order Blocks, and Breakers.
Use this to train your eyes to:
- Spot where an imbalance/OB is created (often after displacement)
- Wait for price to return into that area
- Study the reaction (hold, reject, or slice through) and what that implies next
These indicators are built to pair perfectly with the eBacktesting extension, where traders can practice these concepts step-by-step. Backtesting concepts visually like this is one of the fastest ways to learn, build confidence, and improve trading performance.
Educational use only. Not financial advice.

Order Block Finder | Gold | ProjectSyndicate🥇 ProjectSyndicate Gold Order Block Finder
📌 Institutional Order Blocks for XAUUSD Built for Gold’s Volatility
The ProjectSyndicate Gold Order Block Finder is a professional-grade TradingView indicator engineered specifically for XAUUSD / Gold traders who want clean, high-probability institutional supply & demand zones on their chart.
Gold moves fast, sweeps liquidity often, and loves sharp displacement. This tool is tuned to match that behavior—so you can quickly spot the zones where smart money likely stepped in, and plan entries, targets, and invalidations with confidence. ✅
🚀 Why Gold Traders Like It
✅ Made for XAUUSD: Detection is tuned for Gold’s unique volatility and impulse structure
🏦 Institutional Zone Detection: Finds the last opposing candle before a true displacement + structure break
🧹 Auto-Cleanup (Mitigation): Zones automatically disappear when invalidated (no clutter)
📦 Clean Visualization: Professional OB boxes that extend into live price action
⚡ Pine Script v6: Built on the latest TradingView engine for stability and speed
🧠 Detection Logic Simple, Effective, Battle-Tested
📈 Bullish Order Block (Demand):
The last bearish candle before a strong bullish displacement that breaks market structure (BOS)
📉 Bearish Order Block (Supply):
The last bullish candle before a strong bearish displacement that breaks market structure (BOS)
💥 Displacement Filter Power Move Confirmation:
Zones are validated only when the impulse move meets a minimum strength threshold (default: 1.3× candle range)—helping filter out weak noise and low-quality blocks.
🛠 Recommended Gold Settings (XAUUSD)
Use these presets to match Gold’s typical behavior across higher-impact timeframes:
Timeframe | Swing Length | Displacement
M5 | 5–7 | 1.2 – 1.4
M10 | 5–7 | 1.2 – 1.4
M30 | 5–7 | 1.2 – 1.4
H1 | 7–9 | 1.3 – 1.6
H4 | 8–10 | 1.5 – 2.0
💡 Tip: If you want more signals, reduce Swing Length.
If you want higher quality only, increase Displacement.
✅ Best Use-Cases on Gold
🎯 Mark premium supply/demand zones without manual drawing
🧲 Wait for price to return to the OB for cleaner entries
🛡️ Use OB boundaries for clear invalidation + stop placement
📊 Combine with trend bias / liquidity sweeps / session levels for extra confirmation

Session Liquidity Raid ModelSession Liquidity Raid Model
This indicator helps you understand what each market session is doing with liquidity — without guessing, predicting, or over-complicating things.
It tracks the Asia, London, and New York sessions and shows you:
Where each session’s highs and lows are
Whether those levels have been taken (raided) or are still untouched
When New York is likely cleaning up liquidity left by London
The basic idea (very simple)
If London moves price strongly without taking Asia’s opposite side, New York often comes back to raid London levels first before the real move happens.
This indicator makes that process visible at a glance.
What it shows on the chart
Asia High & Low
London High & Low
Whether each level is taken or not
A simple Bullish / Bearish / Neutral session bias
Clean horizontal lines for key session levels
No buy or sell signals.
No indicators stacked on top of each other.
Just context.
How to use it
Use it to avoid bad trades, not force trades
Wait for liquidity to be taken before looking for entries
Combine it with your own price action, structure, or FVGs
If you trade CME_MINI:NQ1! , this helps you stay aligned with what New York is actually doing, instead of reacting late.
Important note
This is not a trading strategy and it does not predict the future.
It simply shows which session still owes liquidity and which one has already been cleared.

ForzAguanno - Premium / Discount (Range Glissant)Premium / Discount Zones – Dynamic Range (Fibo-based)
This indicator highlights Premium, Discount, and Equilibrium zones using a dynamic Fibonacci range calculated from recent price action.
It is designed to help traders contextualize price and avoid taking trades in unfavorable locations (e.g. buying too high or selling too low).
- How it works
The indicator automatically:
- Detects the highest high (HH) and lowest low (LL) over a rolling range
- Builds a Fibonacci-style structure between LL → HH
- Defines three key areas:
Discount Zone (lower part of the range)
Equilibrium Zone (around the 50% level)
Premium Zone (upper part of the range)
Two additional extreme levels are used:
0.075 → deep discount
0.925 → deep premium
These levels help isolate areas where price is statistically stretched.
- Visual elements
- Horizontal levels:
- Green → Discount
- Purple → Equilibrium
- Red → Premium
- Text labels are placed inside each zone for instant readability.
Zones are extended into the future for cleaner visualization.
- How to use it
This tool is best used as a context filter, not a standalone signal generator.
Typical use cases:
Look for longs in Discount
Look for shorts in Premium
Use Equilibrium as a neutral / decision zone
Combine with structure, momentum, or entry models
It works particularly well with:
Market structure concepts
Smart money / range-based trading
Session-based strategies
⚠️ Important notes
This indicator does not predict direction
It provides context, not signals
Always combine with proper risk management
Final thoughts
The goal of this indicator is simplicity and clarity:
Know where price is located inside its range before taking a trade.
If you find it useful, feel free to share feedback.

Fair Value Gap Signals [Kodexius]Fair Value Gap Signals is an advanced market structure tool that automatically detects and tracks Fair Value Gaps (FVGs), evaluates the quality of each gap, and highlights high value reaction zones with visual metrics and signal markers.
The script is designed for traders who focus on liquidity concepts, order flow and mean reversion. It goes beyond basic FVG plotting by continuously monitoring how price interacts with each gap and by quantifying three key aspects of each zone:
-Entry velocity inside the gap
-Volume absorption during tests
-Structural integrity and depth of penetration
The result is a dynamic, information rich visualization of which gaps are being respected, which are being absorbed, and where potential reversals or continuations are most likely to occur.
All visual elements are configurable, including the maximum number of visible gaps per direction, mitigation method (close or wick) and an ATR based filter to ignore insignificant gaps in low volatility environments.
🔹 Features
🔸 Automated Fair Value Gap Detection
The script detects both bullish and bearish FVGs based on classic three candle logic:
Bullish FVG: current low is strictly above the high from two bars ago
Bearish FVG: current high is strictly below the low from two bars ago
🔸 ATR Based Gap Filter
To avoid clutter and low quality signals, the script can ignore very small gaps using an ATR based filter.
🔸Per Gap State Machine and Lifecycle
Each gap is tracked with an internal status:
Fresh: gap has just formed and has not been tested
Testing: price is currently trading inside the gap
Tested: gap was tested and left, waiting for a potential new test
Rejected: price entered the gap and then rejected away from it
Filled: gap is considered fully mitigated and no longer active
This state machine allows the script to distinguish between simple touches, multiple tests and meaningful reversals, and to trigger different alerts accordingly.
🔸 Visual Ranking of Gaps by Metrics
For each active gap, three additional horizontal rank bars are drawn on top of the gap area:
Rank 1 (Vel): maximum entry velocity inside the gap
Rank 2 (Vol): relative test volume compared to average volume
Rank 3 (Dpt): remaining safety of the gap based on maximum penetration depth
These rank bars extend horizontally from the creation bar, and their length is a visual score between 0 and 1, scaled to the age of the gap. Longer bars represent stronger or more favorable conditions.
🔸Signals and Rejection Markers
When a gap shows signs of rejection (price enters the gap and then closes away from it with sufficient activity), the script can print a signal label at the reaction point. These markers summarize the internal metrics of the gap using a tooltip:
-Velocity percentage
-Volume percentage
-Safety score
-Number of tests
🔸 Flexible Mitigation Logic (Close or Wick)
You can choose how mitigation is defined via the Mitigation Method input:
Close: the gap is considered filled only when the closing price crosses the gap boundary
Wick: a full fill is detected as soon as any wick crosses the gap boundary
🔸 Alert Conditions
-New FVG formed
-Price entering a gap (testing)
-Gap fully filled and invalidated
-Rejection signal generated
🔹Calculations
This section summarizes the main calculations used under the hood. Only the core logic is covered.
1. ATR Filter and Gap Size
The script uses a configurable ATR length to filter out small gaps. First the ATR is computed:
float atrVal = ta.atr(atrLength)
Gap size for both directions is then measured:
float gapSizeBull = low - high
float gapSizeBear = low - high
If useAtrFilter is enabled, gaps smaller than atrVal are ignored. This ties the minimum gap size to the current volatility regime.
2. Fair Value Gap Detection
The basic FVG conditions use a three bar structure:
bool fvgBull = low > high
bool fvgBear = high < low
For bullish gaps the script stores:
-top as low of the current bar
-bottom as high
For bearish gaps:
-top as high of the current bar
-bottom as low
This defines the price range that is considered the imbalance area.
3. Depth and Safety Score
Depth measures how far price has penetrated into the gap since its creation. For each bar, the script computes a currentDepth and updates the maximum depth:
float currentDepth = 0.0
if g.isBullish
if l < g.top
currentDepth := g.top - l
else
if h > g.bottom
currentDepth := h - g.bottom
if currentDepth > g.maxDepth
g.maxDepth := currentDepth
The safety score expresses how much of the gap remains intact:
float depthRatio = g.maxDepth / gapSize
float safetyScore = math.max(0.0, 1.0 - depthRatio)
safetyScore near 1: gap is mostly untouched
safetyScore near 0: gap is mostly or fully filled
4. Velocity Metric
Velocity captures how aggressively price moves inside the gap. It is based on the body to range ratio of each bar that trades within the gap and rewards bars that move in the same direction as the gap:
float barRange = h - l
float bodyRatio = math.abs(close - open) / barRange
float directionBonus = 0.0
if g.isBullish and close > open
directionBonus := 0.2
else if not g.isBullish and close < open
directionBonus := 0.2
float currentVelocity = math.min(bodyRatio + directionBonus, 1.0)
The gap keeps track of the strongest observed value:
if currentVelocity > g.maxVelocity
g.maxVelocity := currentVelocity
This maximum is later used as velScore when building the velocity rank bar.
5. Volume Accumulation and Volume Score
While price is trading inside a gap, the script accumulates the traded volume:
if isInside
g.testVolume += volume
It also keeps track of the number of tests and the volume at the start of the first test:
if g.status == "Fresh"
g.status := "Testing"
g.testCount := 1
g.testStartVolume := volume
An average volume is computed using a 20 period SMA:
float volAvg = ta.sma(volume, 20)
The expected volume is approximated as:
float expectedVol = volAvg * math.max(1, (bar_index - g.index) / 2)
The volume score is then:
float volScore = math.min(g.testVolume / expectedVol, 1.0)
This produces a normalized 0 to 1 metric that shows whether the gap has attracted more or less volume than expected over its lifetime.
6. Rank Bar Scaling
All three scores are projected visually along the time axis as horizontal bars. The script uses the age of the gap in bars as the maximum width:
float maxWidth = math.max(bar_index - g.index, 1)
Then each metric is mapped to a bar length:
int len1 = int(math.max(1, maxWidth * velScore))
g.rankBox1.set_right(g.index + len1)
int len2 = int(math.max(1, maxWidth * volScore))
g.rankBox2.set_right(g.index + len2)
int len3 = int(math.max(1, maxWidth * safetyScore))
g.rankBox3.set_right(g.index + len3)
This creates an intuitive visual representation where stronger metrics produce longer rank bars, making it easy to quickly compare the relative quality of multiple FVGs on the chart.

Position Size Calculator + Live R/R Panel — SMC/ICT (@PueblaATH)Position Size + Live R/R Panel — SMC/ICT (@PueblaATH)
Position Size + Live R/R Panel — SMC/ICT (@PueblaATH) is a professional-grade risk management and execution module built for Smart Money Concepts (SMC) and ICT Traders who require accurate, repeatable, institution-style trade planning.
This tool delivers precise position sizing, R:R modeling, leverage and margin projections, fee-adjusted PnL outcomes, and real-time execution metrics—all directly on the chart. Optimized for crypto, forex, and futures, it provides scalpers, day traders, and swing traders with the clarity needed to execute high-quality trades with confidence and consistency.
What the Indicator Does
Institutional Position Sizing Engine
Calculates position size based on account balance, % risk, and SL distance.
Supports custom minimum lot size rounding across crypto, FX, indices, and derivatives.
Intelligent direction logic (Auto / Long / Short) based on SMC/ICT structure.
Advanced Risk/Reward & Profit Modeling
Real-time R:R ratio using actual rounded position size.
Live PnL readout that updates with price movements.
Gross & net profit projections with full fee deduction.
Execution Planning with Draggable Levels
Entry, SL, and TP levels fully draggable for fast scenario modeling.
Automatic projected lines backward/forward with clean label alignment.
TP and SL tags include % movement from Entry, ideal for SMC/ICT journaling.
Precise modeling of real exchange fee structures
Maker fee per side
Taker fee per side
Mixed fee modes (Maker entry, Taker exit, Average, etc.)
Leverage & Margin Forecasting
Margin requirements displayed for 3 customizable leverage settings.
Helps traders understand capital commitment before executing the trade.
Useful for futures, crypto perps, and CFD setups.
Clean HUD Panel for Rapid Decision-Making
A full professional trading panel displays:
Target & actual risk
Position size
Entry / SL / TP
TP/SL percentage distance
Gross profit
Net profit (after fees)
Fees @ TP and @ SL
Live PnL
Margin requirements
Optimized for SMC & ICT Workflows
Perfect for traders using:
Breakers, FVGs, OBs
Liquidity sweeps
Session models
Precision entries (OTE, Displacement, Rebalancing)
Leverage-based execution (crypto perps, futures)
How to Use It
Attach the indicator to your chart.
Set account balance, risk %, fee model, and leverage presets.
Drag Entry, SL, and TP to shape the setup.
View instant calculations of: Position size; R:R; Net PnL after fees; Margin required
Use it as your pre-trade checklist & execution model.
Originality & Credits
This script is an original creation by @PueblaATH, released under the MPL 2.0 license.
It does not copy, modify, or repackage any existing TradingView code.
All logic—including the fee engine, margin calculator, responsive HUD, dynamic risk model, and visual execution system—is authored specifically for this indicator.

BOS and CHoCHThe market never moves in a straight line. It moves in waves.
It makes a High, comes down a bit (Low), then breaks the previous High to make a new High.
Similarly, It makes a Low, goes up a bit (High), then breaks the previous Low to make a new Low.
BOS (Break Of Structure) - Trend Continuation
BOS means the market is continuing its current trend. If the market is in an Uptrend and breaks the old "High" -> Bullish BOS. If the market is in a Downtrend and breaks the old "Low" -> Bearish BOS.
3. CHOCH (Change Of Character) - Trend Reversal
CHOCH means the mood of the market has changed. For the first time, the trend has shifted its nature.
Bullish to Bearish CHOCH: The market was making Higher Highs, but suddenly it broke its previous "Low". Now the market can fall.
Bearish to Bullish CHOCH: The market was falling (Lower Lows), but suddenly it broke its previous "High". Now the market can rise.
BOS: Confirms the trend (Breaking the ceiling to go higher).
CHOCH: Signals a trend change (Slipping and falling below the previous floor).

FVG 9:31–10:00 AM ETFVG 9:31–10:00 AM ET - Script Description
What This Script Does
This indicator finds **Fair Value Gaps (FVGs)** that form during the first 29 minutes of the U.S. stock market (9:31 AM to 10:00 AM Eastern Time). A Fair Value Gap is a price imbalance where there's a gap between candles that often becomes an important support or resistance level.
Key Features:
- **Time Window**: Only looks for FVGs between 9:31-10:00 AM ET (most important opening period)
- **One Per Day**: Finds only the first FVG that forms in this time window each day
- **Visual Display**: Draws a purple box around the gap with a clear "FVG" label
- **Price Tracking**: Monitors when price comes back to test the gap level
- **Alert System**: Sends notifications when price returns to the FVG zone
How FVGs Are Detected:
- **Bullish FVG**: When there's a gap up (low of middle candle is above high of 3rd candle back)
- **Bearish FVG**: When there's a gap down (high of middle candle is below low of 3rd candle back)
The 9:31-10:00 AM window is chosen because this is when institutions and algorithms create their biggest price moves right after market open, making these gaps very reliable.
Customization Options
User Settings
Extend FVG Box (Bars)
- **What it does**: Makes the purple box longer to the right
- **Default**: 0 (box ends right after the gap forms)
- **Options**: Any number from 0 to 100+
- **When to use**:
- Keep at 0 for clean historical view
- Set to 10-20 to track the gap during the current session
- Set higher for longer reference
Code Settings (Can Be Changed)
Time Window
- **Start**: 9:31 AM Eastern Time
- **End**: 10:00 AM Eastern Time
- **Can modify**: Change the hour/minute numbers in the code
Visual Style
- **Color**: Purple with see-through background
- **Label**: Shows "FVG" text in white
- **Can modify**: Change colors and transparency in the code
How to Use:
Setup
Chart Settings
1. Use 1-minute, 5-minute, or 15-minute charts (works best on these timeframes)
2. Apply to liquid markets like ES, NQ, major stocks, or forex pairs
3. Set the "Extend FVG Box" to your preference (start with 0 or 10)
What You'll See
- A purple box appears when an FVG forms during 9:31-10:00 AM
- Box shows the exact price levels of the gap
- "FVG" label appears on the box
- Only one FVG per day will be marked
Trading Strategies
Basic FVG Trading
1. **Wait for Formation**: Let the purple box appear during 9:31-10:00 AM
2. **Watch Price Movement**: See if price moves away from the gap
3. **Enter on Retest**: When price comes back to the purple box area, consider entering
4. **Trade Direction**:
- Bullish FVG = look for long opportunities when price retests
- Bearish FVG = look for short opportunities when price retests
Entry Methods
- **Bounce Play**: Enter when price touches the FVG box and bounces away
- **Break Play**: Enter if price strongly breaks through the FVG box
- **Rejection Play**: Enter opposite direction if price gets rejected at the FVG
Risk Management
Stop Losses
- Place stops just outside the FVG box (a few ticks beyond the gap)
- If trading a bounce, stop goes on opposite side of the gap
- If trading a break, stop goes back inside the gap
Position Sizing
- Start small until you understand how FVGs work in your market
- Bigger gaps = smaller position size (more risk)
- Smaller gaps = can use larger position size
Profit Targets
- Take profits at obvious levels like round numbers, previous highs/lows
- Consider taking half profits at 1:1 risk/reward ratio
- Let some position run if the move is strong
Best Practices
When It Works Best
- High-volume stocks and futures (ES, NQ work great)
- Normal market days without major news during the 9:31-10:00 window
- When there's clear institutional activity in the opening period
When to Be Careful
- Low-volume stocks or markets
- Major economic news releases during the time window
- Market holidays when volume is low
- Very choppy or sideways days
Alert Usage
- The script will alert you when price comes back to test the FVG
- Don't trade the alert blindly - always check the current market situation
- Use the alert as a heads-up to start watching the setup more closely
Tips for Success
- The earlier the FVG forms in the 9:31-10:00 window, often the more significant it is
- FVGs that form with high volume are usually more reliable
- Always consider the overall market direction - don't fight the main trend
- Practice on paper first to understand how FVGs behave in your chosen market
🔗 Works Best With:
✅ Liquidity Levels — Smart Swing Lows: Spot key structural lows that can fuel stop hunts and reversals.
✅ ICT Turtle Soup — Liquidity Reversal: Add a classic reversal pattern to your toolkit to catch fakeouts cleanly.
✅ ICT SMC Liquidity Grabs and OBs- Liquidity Grabs, Order Block Zones, and Fibonacci OTE Levels, allowing traders to identify institutional entry models with clean, rule-based visual signals.
This script is most valuable for day traders who want to catch institutional moves right after market open, but it can also help swing traders identify important intraday levels.
✅ ICT Macro Zones (Grey Box Version)- It tracks real-time highs and lows for each Silver Bullet session.
✅ Weekly Opening Gap (cryptonnnite)

Institutional Sessions Overlay (Asia/London/NY)Institutional Sessions Overlay is a professional TradingView indicator that visually highlights the main trading sessions (Asia, London, and New York) directly on your chart.
Customizable: Easily adjust session start and end times (including minutes) for each market.
Timezone Alignment: Shift session boxes using the timezone offset parameter so sessions match your chart’s timezone exactly.
Clear Visuals: Colored boxes and optional labels display session opens and closes for fast institutional market structure reference.
Toggle Labels: Show or hide session open/close labels with a single click for a clean or detailed look.
Intuitive UI: User-friendly grouped settings for efficient configuration.
This tool is designed for day traders, institutional traders, and anyone who wants to instantly recognize global session timing and ranges for SMC, ICT, and other session-based strategies.
How to use:
Set your chart to your local timezone.
Use the "Session timezone offset" setting if session boxes do not match actual session opens on your chart.
Adjust the hours and minutes for each session as needed.
Enable or disable labels in the “Display” settings group.
Tip: Use the overlay to spot session highs and lows, volatility windows, and institutional liquidity sweeps.

FVG Premium [no1x]█ OVERVIEW
This indicator provides a comprehensive toolkit for identifying, visualizing, and tracking Fair Value Gaps (FVGs) across three distinct timeframes (current chart, a user-defined Medium Timeframe - MTF, and a user-defined High Timeframe - HTF). It is designed to offer traders enhanced insight into FVG dynamics through detailed state monitoring (formation, partial fill, full mitigation, midline touch), extensive visual customization for FVG representation, and a rich alert system for timely notifications on FVG-related events.
█ CONCEPTS
This indicator is built upon the core concept of Fair Value Gaps (FVGs) and their significance in price action analysis, offering a multi-layered approach to their detection and interpretation across different timeframes.
Fair Value Gaps (FVGs)
A Fair Value Gap (FVG), also known as an imbalance, represents a range in price delivery where one side of the market (buying or selling) was more aggressive, leaving an inefficiency or an "imbalance" in the price action. This concept is prominently featured within Smart Money Concepts (SMC) and Inner Circle Trader (ICT) methodologies, where such gaps are often interpreted as footprints left by "smart money" due to rapid, forceful price movements. These methodologies suggest that price may later revisit these FVG zones to rebalance a prior inefficiency or to seek liquidity before continuing its path. These gaps are typically identified by a three-bar pattern:
Bullish FVG : This is a three-candle formation where the second candle shows a strong upward move. The FVG is the space created between the high of the first candle (bottom of FVG) and the low of the third candle (top of FVG). This indicates a strong upward impulsive move.
Bearish FVG : This is a three-candle formation where the second candle shows a strong downward move. The FVG is the space created between the low of the first candle (top of FVG) and the high of the third candle (bottom of FVG). This indicates a strong downward impulsive move.
FVGs are often watched by traders as potential areas where price might return to "rebalance" or find support/resistance.
Multi-Timeframe (MTF) Analysis
The indicator extends FVG detection beyond the current chart's timeframe (Low Timeframe - LTF) to two higher user-defined timeframes: Medium Timeframe (MTF) and High Timeframe (HTF). This allows traders to:
Identify FVGs that might be significant on a broader market structure.
Observe how FVGs from different timeframes align or interact.
Gain a more comprehensive perspective on potential support and resistance zones.
FVG State and Lifecycle Management
The indicator actively tracks the lifecycle of each detected FVG:
Formation : The initial identification of an FVG.
Partial Fill (Entry) : When price enters but does not completely pass through the FVG. The indicator updates the "current" top/bottom of the FVG to reflect the filled portion.
Midline (Equilibrium) Touch : When price touches the 50% level of the FVG.
Full Mitigation : When price completely trades through the FVG, effectively "filling" or "rebalancing" the gap. The indicator records the mitigation time.
This state tracking is crucial for understanding how price interacts with these zones.
FVG Classification (Large FVG)
FVGs can be optionally classified as "Large FVGs" (LV) if their size (top to bottom range) exceeds a user-defined multiple of the Average True Range (ATR) for that FVG's timeframe. This helps distinguish FVGs that are significantly larger relative to recent volatility.
Visual Customization and Information Delivery
A key concept is providing extensive control over how FVGs are displayed. This control is achieved through a centralized set of visual parameters within the indicator, allowing users to configure numerous aspects (colors, line styles, visibility of boxes, midlines, mitigation lines, labels, etc.) for each timeframe. Additionally, an on-chart information panel summarizes the nearest unmitigated bullish and bearish FVG levels for each active timeframe, providing a quick glance at key price points.
█ FEATURES
This indicator offers a rich set of features designed to provide a highly customizable and comprehensive Fair Value Gap (FVG) analysis experience. Users can tailor the FVG detection, visual representation, and alerting mechanisms across three distinct timeframes: the current chart (Low Timeframe - LTF), a user-defined Medium Timeframe (MTF), and a user-defined High Timeframe (HTF).
Multi-Timeframe FVG Detection and Display
The core strength of this indicator lies in its ability to identify and display FVGs from not only the current chart's timeframe (LTF) but also from two higher, user-selectable timeframes (MTF and HTF).
Timeframe Selection: Users can specify the exact MTF (e.g., "60", "240") and HTF (e.g., "D", "W") through dedicated inputs in the "MTF (Medium Timeframe)" and "HTF (High Timeframe)" settings groups. The visibility of FVGs from these higher timeframes can be toggled independently using the "Show MTF FVGs" and "Show HTF FVGs" checkboxes.
Consistent Detection Logic: The FVG detection logic, based on the classic three-bar imbalance pattern detailed in the 'Concepts' section, is applied consistently across all selected timeframes (LTF, MTF, HTF)
Timeframe-Specific Visuals: Each timeframe's FVGs (LTF, MTF, HTF) can be customized with unique colors for bullish/bearish states and their mitigated counterparts. This allows for easy visual differentiation of FVGs originating from different market perspectives.
Comprehensive FVG Visualization Options
The indicator provides extensive control over how FVGs are visually represented on the chart for each timeframe (LTF, MTF, HTF).
FVG Boxes:
Visibility: Main FVG boxes can be shown or hidden per timeframe using the "Show FVG Boxes" (for LTF), "Show Boxes" (for MTF/HTF) inputs.
Color Customization: Colors for bullish, bearish, active, and mitigated FVG boxes (including Large FVGs, if classified) are fully customizable for each timeframe.
Box Extension & Length: FVG boxes can either be extended to the right indefinitely ("Extend Boxes Right") or set to a fixed length in bars ("Short Box Length" or "Box Length" equivalent inputs).
Box Labels: Optional labels can display the FVG's timeframe and fill percentage on the box. These labels are configurable for all timeframes (LTF, MTF, and HTF). Please note: If FVGs are positioned very close to each other on the chart, their respective labels may overlap. This can potentially lead to visual clutter, and it is a known behavior in the current version of the indicator.
Box Borders: Visibility, width, style (solid, dashed, dotted), and color of FVG box borders are customizable per timeframe.
Midlines (Equilibrium/EQ):
Visibility: The 50% level (midline or EQ) of FVGs can be shown or hidden for each timeframe.
Style Customization: Width, style, and color of the midline are customizable per timeframe. The indicator tracks if this midline has been touched by price.
Mitigation Lines:
Visibility: Mitigation lines (representing the FVG's opening level that needs to be breached for full mitigation) can be shown or hidden for each timeframe. If shown, these lines are always extended to the right.
Style Customization: Width, style, and color of the mitigation line are customizable per timeframe.
Mitigation Line Labels: Optional price labels can be displayed on mitigation lines, with a customizable horizontal bar offset for positioning. For optimal label placement, the following horizontal bar offsets are recommended: 4 for LTF, 8 for MTF, and 12 for HTF.
Persistence After Mitigation: Users can choose to keep mitigation lines visible even after an FVG is fully mitigated, with a distinct color for such lines. Importantly, this option is only effective if the general setting 'Hide Fully Mitigated FVGs' is disabled, as otherwise, the entire FVG and its lines will be removed upon mitigation.
FVG State Management and Behavior
The indicator tracks and visually responds to changes in FVG states.
Hide Fully Mitigated FVGs: This option, typically found in the indicator's general settings, allows users to automatically remove all visual elements of an FVG from the chart once price has fully mitigated it. This helps maintain chart clarity by focusing on active FVGs.
Partial Fill Visualization: When price enters an FVG, the indicator offers a dynamic visual representation: the portion of the FVG that has been filled is shown as a "mitigated box" (typically with a distinct color), while the original FVG box shrinks to clearly highlight the remaining, unfilled portion. This two-part display provides an immediate visual cue about how much of the FVG's imbalance has been addressed and what potential remains within the gap.
Visual Filtering by ATR Proximity: To help users focus on the most relevant price action, FVGs can be dynamically hidden if they are located further from the current price than a user-defined multiple of the Average True Range (ATR). This behavior is controlled by the "Filter Band Width (ATR Multiple)" input; setting this to zero disables the filter entirely, ensuring all detected FVGs remain visible regardless of their proximity to price.
Alternative Usage Example: Mitigation Lines as Key Support/Resistance Levels
For traders preferring a minimalist chart focused on key Fair Value Gap (FVG) levels, the indicator's visualization settings can be customized to display only FVG mitigation lines. This approach leverages these lines as potential support and resistance zones, reflecting areas where price might revisit to address imbalances.
To configure this view:
Disable FVG Boxes: Turn off "Show FVG Boxes" (for LTF) or "Show Boxes" (for MTF/HTF) for the desired timeframes.
Hide Midlines: Disable the visibility of the 50% FVG Midlines (Equilibrium/EQ).
Ensure Mitigation Lines are Visible: Keep "Mitigation Lines" enabled.
Retain All Mitigation Lines:
Disable the "Hide Fully Mitigated FVGs" option in the general settings.
Enable the feature to "keep mitigation lines visible even after an FVG is fully mitigated". This ensures lines from all FVGs (active or fully mitigated) remain on the chart, which is only effective if "Hide Fully Mitigated FVGs" is disabled.
This setup offers:
A Decluttered Chart: Focuses solely on the FVG opening levels.
Precise S/R Zones: Treats mitigation lines as specific points for potential price reactions.
Historical Level Analysis: Includes lines from past, fully mitigated FVGs for a comprehensive view of significant price levels.
For enhanced usability with this focused view, consider these optional additions:
The on-chart Information Panel can be activated to display a quick summary of the nearest unmitigated FVG levels.
Mitigation Line Labels can also be activated for clear price level identification. A customizable horizontal bar offset is available for positioning these labels; for example, offsets of 4 for LTF, 8 for MTF, and 12 for HTF can be effective.
FVG Classification (Large FVG)
This feature allows for distinguishing FVGs based on their size relative to market volatility.
Enable Classification: Users can enable "Classify FVG (Large FVG)" to identify FVGs that are significantly larger than average.
ATR-Based Threshold: An FVG is classified as "Large" if its height (price range) is greater than or equal to the Average True Range (ATR) of its timeframe multiplied by a user-defined "Large FVG Threshold (ATR Multiple)". The ATR period for this calculation is also configurable.
Dedicated Colors: Large FVGs (both bullish/bearish and active/mitigated) can be assigned unique colors, making them easily distinguishable on the chart.
Panel Icon: Large FVGs are marked with a special icon in the Info Panel.
Information Panel
An on-chart panel provides a quick summary of the nearest unmitigated FVG levels.
Visibility and Position: The panel can be shown/hidden and positioned in any of the nine standard locations on the chart (e.g., Top Right, Middle Center).
Content: It displays the price levels of the nearest unmitigated bullish and bearish FVGs for LTF, MTF (if active), and HTF (if active). It also indicates if these nearest FVGs are Large FVGs (if classification is enabled) using a selectable icon.
Styling: Text size, border color, header background/text colors, default text color, and "N/A" cell background color are customizable.
Highlighting: Background and text colors for the cells displaying the overall nearest bullish and bearish FVG levels (across all active timeframes) can be customized to draw attention to the most proximate FVG.
Comprehensive Alert System
The indicator offers a granular alert system for various FVG-related events, configurable for each timeframe (LTF, MTF, HTF) independently. Users can enable alerts for:
New FVG Formation: Separate alerts for new bullish and new bearish FVG formations.
FVG Entry/Partial Fill: Separate alerts for price entering a bullish FVG or a bearish FVG.
FVG Full Mitigation: Separate alerts for full mitigation of bullish and bearish FVGs.
FVG Midline (EQ) Touch: Separate alerts for price touching the midline of a bullish or bearish FVG.
Alert messages are detailed, providing information such as the timeframe, FVG type (bull/bear, Large FVG), relevant price levels, and timestamps.
█ NOTES
This section provides additional information regarding the indicator's usage, performance considerations, and potential interactions with the TradingView platform. Understanding these points can help users optimize their experience and troubleshoot effectively.
Performance and Resource Management
Maximum FVGs to Track : The "Max FVGs to Track" input (defaulting to 25) limits the number of FVG objects processed for each category (e.g., LTF Bullish, MTF Bearish). Increasing this value significantly can impact performance due to more objects being iterated over and potentially drawn, especially when multiple timeframes are active.
Drawing Object Limits : To manage performance, this script sets its own internal limits on the number of drawing objects it displays. While it allows for up to approximately 500 lines (max_lines_count=500) and 500 labels (max_labels_count=500), the number of FVG boxes is deliberately restricted to a maximum of 150 (max_boxes_count=150). This specific limit for boxes is a key performance consideration: displaying too many boxes can significantly slow down the indicator, and a very high number is often not essential for analysis. Enabling all visual elements for many FVGs across all three timeframes can cause the indicator to reach these internal limits, especially the stricter box limit
Optimization Strategies : To help you manage performance, reduce visual clutter, and avoid exceeding drawing limits when using this indicator, I recommend the following strategies:
Maintain or Lower FVG Tracking Count: The "Max FVGs to Track" input defaults to 25. I find this value generally sufficient for effective analysis and balanced performance. You can keep this default or consider reducing it further if you experience performance issues or prefer a less dense FVG display.
Utilize Proximity Filtering: I suggest activating the "Filter Band Width (ATR Multiple)" option (found under "General Settings") to display only those FVGs closer to the current price. From my experience, a value of 5 for the ATR multiple often provides a good starting point for balanced performance, but you should feel free to adjust this based on market volatility and your specific trading needs.
Hide Fully Mitigated FVGs: I strongly recommend enabling the "Hide Fully Mitigated FVGs" option. This setting automatically removes all visual elements of an FVG from the chart once it has been fully mitigated by price. Doing so significantly reduces the number of active drawing objects, lessens computational load, and helps maintain chart clarity by focusing only on active, relevant FVGs.
Disable FVG Display for Unused Timeframes: If you are not actively monitoring certain higher timeframes (MTF or HTF) for FVG analysis, I advise disabling their display by unchecking "Show MTF FVGs" or "Show HTF FVGs" respectively. This can provide a significant performance boost.
Simplify Visual Elements: For active FVGs, consider hiding less critical visual elements if they are not essential for your specific analysis. This could include box labels, borders, or even entire FVG boxes if, for example, only the mitigation lines are of interest for a particular timeframe.
Settings Changes and Platform Limits : This indicator is comprehensive and involves numerous calculations and drawings. When multiple settings are changed rapidly in quick succession, it is possible, on occasion, for TradingView to issue a "Runtime error: modify_study_limit_exceeding" or similar. This can cause the indicator to temporarily stop updating or display errors.
Recommended Approach : When adjusting settings, it is advisable to wait a brief moment (a few seconds) after each significant change. This allows the indicator to reprocess and update on the chart before another change is made
Error Recovery : Should such a runtime error occur, making a minor, different adjustment in the settings (e.g., toggling a checkbox off and then on again) and waiting briefly will typically allow the indicator to recover and resume correct operation. This behavior is related to platform limitations when handling complex scripts with many inputs and drawing objects.
Multi-Timeframe (MTF/HTF) Data and Behavior
HTF FVG Confirmation is Essential: : For an FVG from a higher timeframe (MTF or HTF) to be identified and displayed on your current chart (LTF), the three-bar pattern forming the FVG on that higher timeframe must consist of fully closed bars. The indicator does not draw speculative FVGs based on incomplete/forming bars from higher timeframes.
Data Retrieval and LTF Processing: The indicator may use techniques like lookahead = barmerge.lookahead_on for timely data retrieval from higher timeframes. However, the actual detection of an FVG occurs after all its constituent bars on the HTF have closed.
Appearance Timing on LTF (1 LTF Candle Delay): As a natural consequence of this, an FVG that is confirmed on an HTF (i.e., its third bar closes) will typically become visible on your LTF chart one LTF bar after its confirmation on the HTF.
Example: Assume an FVG forms on a 30-minute chart at 15:30 (i.e., with the close of the 30-minute bar that covers the 15:00-15:30 period). If you are monitoring this FVG on a 15-minute chart, the indicator will detect this newly formed 30-minute FVG while processing the data for the 15-minute bar that starts at 15:30 and closes at 15:45. Therefore, the 30-minute FVG will become visible on your 15-minute chart at the earliest by 15:45 (i.e., with the close of that relevant 15-minute LTF candle). This means the HTF FVG is reflected on the LTF chart with a delay equivalent to one LTF candle.
FVG Detection and Display Logic
Fair Value Gaps (FVGs) on the current chart timeframe (LTF) are detected based on barstate.isconfirmed. This means the three-bar pattern must be complete with closed bars before an FVG is identified. This confirmation method prevents FVGs from being prematurely identified on the forming bar.
Alerts
Alert Setup : To receive alerts from this indicator, you must first ensure you have enabled the specific alert conditions you are interested in within the indicator's own settings (see 'Comprehensive Alert System' under the 'FEATURES' section). Once configured, open TradingView's 'Create Alert' dialog. In the 'Condition' tab, select this indicator's name, and crucially, choose the 'Any alert() function call' option from the dropdown list. This setup allows the indicator to trigger alerts based on the precise event conditions you have activated in its settings
Alert Frequency : Alerts are designed to trigger once per bar close (alert.freq_once_per_bar_close) for the specific event.
User Interface (UI) Tips
Settings Group Icons: In the indicator settings menu, timeframe-specific groups are marked with star icons for easier navigation: 🌟 for LTF (Current Chart Timeframe), 🌟🌟 for MTF (Medium Timeframe), and 🌟🌟🌟 for HTF (High Timeframe).
Dependent Inputs: Some input settings are dependent on others being enabled. These dependencies are visually indicated in the settings menu using symbols like "↳" (dependent setting on the next line), "⟷" (mutually exclusive inline options), or "➜" (directly dependent inline option).
Settings Layout Overview: The indicator settings are organized into logical groups for ease of use. Key global display controls – such as toggles for MTF FVGs, HTF FVGs (along with their respective timeframe selectors), and the Information Panel – are conveniently located at the very top within the '⚙️ General Settings' group. This placement allows for quick access to frequently adjusted settings. Other sections provide detailed customization options for each timeframe (LTF, MTF, HTF), specific FVG components, and alert configurations.
█ FOR Pine Script® CODERS
This section provides a high-level overview of the FVG Premium indicator's internal architecture, data flow, and the interaction between its various library components. It is intended for Pine Script™ programmers who wish to understand the indicator's design, potentially extend its functionality, or learn from its structure.
System Architecture and Modular Design
The indicator is architected moduarly, leveraging several custom libraries to separate concerns and enhance code organization and reusability. Each library has a distinct responsibility:
FvgTypes: Serves as the foundational data definition layer. It defines core User-Defined Types (UDTs) like fvgObject (for storing all attributes of an FVG) and drawSettings (for visual configurations), along with enumerations like tfType.
CommonUtils: Provides utility functions for common tasks like mapping user string inputs (e.g., "Dashed" for line style) to their corresponding Pine Script™ constants (e.g., line.style_dashed) and formatting timeframe strings for display.
FvgCalculations: Contains the core logic for FVG detection (both LTF and MTF/HTF via requestMultiTFBarData), FVG classification (Large FVGs based on ATR), and checking FVG interactions with price (mitigation, partial fill).
FvgObject: Implements an object-oriented approach by attaching methods to the fvgObject UDT. These methods manage the entire visual lifecycle of an FVG on the chart, including drawing, updating based on state changes (e.g., mitigation), and deleting drawing objects. It's responsible for applying the visual configurations defined in drawSettings.
FvgPanel: Manages the creation and dynamic updates of the on-chart information panel, which displays key FVG levels.
The main indicator script acts as the orchestrator, initializing these libraries, managing user inputs, processing data flow between libraries, and handling the main event loop (bar updates) for FVG state management and alerts.
Core Data Flow and FVG Lifecycle Management
The general data flow and FVG lifecycle can be summarized as follows:
Input Processing: User inputs from the "Settings" dialog are read by the main indicator script. Visual style inputs (colors, line styles, etc.) are consolidated into a types.drawSettings object (defined in FvgTypes). Other inputs (timeframes, filter settings, alert toggles) control the behavior of different modules. CommonUtils assists in mapping some string inputs to Pine constants.
FVG Detection:
For the current chart timeframe (LTF), FvgCalculations.detectFvg() identifies potential FVGs based on bar patterns.
For MTF/HTF, the main indicator script calls FvgCalculations.requestMultiTFBarData() to fetch necessary bar data from higher timeframes, then FvgCalculations.detectMultiTFFvg() identifies FVGs.
Newly detected FVGs are instantiated as types.fvgObject and stored in arrays within the main script. These objects also undergo classification (e.g., Large FVG) by FvgCalculations.
State Update & Interaction: On each bar, the main indicator script iterates through active FVG objects to manage their state based on price interaction:
Initially, the main script calls FvgCalculations.fvgInteractionCheck() to efficiently determine if the current bar's price might be interacting with a given FVG.
If a potential interaction is flagged, the main script then invokes methods directly on the fvgObject instance (e.g., updateMitigation(), updatePartialFill(), checkMidlineTouch(), which are part of FvgObject).
These fvgObject methods are responsible for the detailed condition checking and the actual modification of the FVG's state. For instance, the updateMitigation() and updatePartialFill() methods internally utilize specific helper functions from FvgCalculations (like checkMitigation() and checkPartialMitigation()) to confirm the precise nature of the interaction before updating the fvgObject’s state fields (such as isMitigated, currentTop, currentBottom, or isMidlineTouched).
Visual Rendering:
The FvgObject.updateDrawings() method is called for each fvgObject. This method is central to drawing management; it creates, updates, or deletes chart drawings (boxes, lines, labels) based on the FVG's current state, its prev_* (previous bar state) fields for optimization, and the visual settings passed via the drawSettings object.
Information Panel Update: The main indicator script determines the nearest FVG levels, populates a panelData object (defined in FvgPanelLib), and calls FvgPanel.updatePanel() to refresh the on-chart display.
Alert Generation: Based on the updated FVG states and user-enabled alert settings, the main indicator script constructs and triggers alerts using Pine Script's alert() function."
Key Design Considerations
UDT-Centric Design: The fvgObject UDT is pivotal, acting as a stateful container for all information related to a single FVG. Most operations revolve around creating, updating, or querying these objects.
State Management: To optimize drawing updates and manage FVG lifecycles, fvgObject instances store their previous bar's state (e.g., prevIsVisible, prevCurrentTop). The FvgObject.updateDrawings() method uses this to determine if a redraw is necessary, minimizing redundant drawing calls.
Settings Object: A drawSettings object is populated once (or when inputs change) and passed to drawing functions. This avoids repeatedly reading numerous input() values on every bar or within loops, improving performance.
Dynamic Arrays for FVG Storage: Arrays are used to store collections of fvgObject instances, allowing for dynamic management (adding new FVGs, iterating for updates).

FVG Candle HighlighterThis indicator highlights only the true Fair Value Gap (FVG) creator candle — the middle candle in a 3-bar FVG formation — with zero clutter.
🔹 Bullish FVG: Candle is colored if price gaps above the high two bars back
🔹 Bearish FVG: Candle is colored if price gaps below the low two bars back
✨ No boxes. No zones. Just pure, visual price-action accuracy.
🔧 Powered by Pine Script v6
🧠 Based on institutional-style FVG logic
🎯 Ideal for Smart Money / ICT / Order Block strategies

FVG + OB + RSI Divergence + Volume Spikes🧠 FVG + OB + RSI Divergence + Volume Spikes – Market Structure Confluence Tool
This all-in-one indicator brings together four powerful market concepts into a single script designed to help traders identify high-probability trade setups with precision and clarity:
🔍 What It Does
✅ Fair Value Gaps (FVG)
Highlights inefficiencies in price action, showing where the market may return to “rebalance.”
✅ Order Blocks (OB)
Marks key institutional footprints — bullish and bearish order blocks based on engulfing candle structures.
✅ RSI Divergence
Detects both bullish and bearish divergences between price and RSI, signaling potential reversals.
✅ Volume Spikes
Flags bars where volume significantly exceeds the average — a common footprint of smart money.
🎯 How to Use
Use this tool to spot confluences between price inefficiencies (FVG), key reversal zones (OB), momentum shifts (RSI Divergence), and institutional interest (Volume Spikes). The best setups often occur when multiple signals align — especially at key support/resistance or trend zones.
⚙️ Inputs
RSI length (for divergence)
Volume spike sensitivity (multiplier)
Lookback for Order Blocks and FVGs
⚠️ Notes
This is a non-repainting tool.
Ideal for price action, SMC, ICT, and order flow traders.
Combine with your existing strategy and higher time frame bias for best results.

ICT Turtle Soup (Liquidity Reversal)ICT Turtle Soup — Liquidity Reversal Detection
Classic Liquidity Trap Reversal Strategy for Smart Money Traders
This indicator implements the ICT Turtle Soup concept — a classic liquidity-based reversal pattern — which occurs when price runs above or below a recent swing level to grab liquidity, then sharply reverses. This pattern is commonly used in Smart Money Concepts (SMC) and Inner Circle Trader (ICT) strategies to anticipate false breakouts and high-probability reversals.
🔍 What This Script Does:
Identifies Swing Highs & Lows
Detects recent swing highs and lows using a customizable lookback period.
Tracks Liquidity Grabs
A bearish Turtle Soup setup is triggered when price breaks above a recent swing high but closes back below it.
A bullish Turtle Soup setup is triggered when price breaks below a recent swing low but closes back above it.
These conditions often signal liquidity traps, where price sweeps resting orders before reversing.
Plots Signals Directly on the Chart
Turtle Soup setups are marked with 🐢🔻 (bearish) and 🐢🔺 (bullish) labels.
Optional full-text labels can also be displayed for clarity and journaling.
Includes Alert Conditions
Alerts can be enabled to notify you of bullish or bearish Turtle Soup reversals in real-time.
⚙️ Customization Features:
Adjustable swing lookback period
Enable/disable Turtle Soup labels
Set label font size
Choose your preferred bullish/bearish signal colors
💡 How to Use:
Add this script to your chart (ideally on intraday timeframes such as 5m–15m).
Wait for a Turtle Soup signal near a key swing high/low or liquidity zone.
Combine with other confirmation tools (e.g., FVGs, Order Blocks, OTE) for stronger setups.
Use alerts to stay ahead of fast-moving reversals.
🧠 Why It Works:
Turtle Soup setups are rooted in liquidity theory — they exploit the market’s tendency to sweep obvious swing levels before reversing. These moves often trap retail traders and mark the beginning of Smart Money entries.
🔗 Best Used With:
Maximize the edge by combining this with other SMC tools:
✅ First FVG — Opening Range Fair Value Gap Detector
✅ ICT SMC Liquidity Grabs + OB + Fibonacci OTE Levels
✅ Liquidity Levels — Smart Swing Lows
Together, they create a complete ecosystem for identifying, confirming, and executing liquidity-driven trade setups with precision.

Liquidity Levels (Smart Swing Lows)Liquidity Levels — Smart Swing Low Detection
Efficient Liquidity Sweep Visualization for Smart Money Traders
This script automatically identifies and plots liquidity-rich swing lows based on pivot logic, filters them to remove redundant levels, and overlays daily highs/lows for added context — giving Smart Money Concept (SMC) traders a clean, actionable map of liquidity.
It’s designed to be minimal yet powerful: perfect for spotting potential liquidity grabs, mitigation zones, and sweep targets with zero chart clutter.
🔍 What This Script Does:
Detects Smart Swing Lows
Uses fixed pivot detection (left = 3, right = customizable) to identify structurally significant swing lows.
Filters out swing lows that are too close together using a percentage-based spacing threshold to reduce noise.
Mitigation Cleanup Logic
Tracks whether recent price action breaches past swing lows.
If breached, the swing level is automatically removed, keeping only relevant, unmitigated liquidity levels on your chart.
Plots Daily Highs and Lows
Each new trading day, horizontal rays mark the prior day’s high and low — useful for identifying resting liquidity and possible sweep zones.
Labeling and Style Customization
Optional labels for swing lows.
Full control over label size, color, and visibility to match any chart aesthetic.
Timeframe Filtering
Runs exclusively on 5m, 10m, and 15m charts to ensure optimal reliability and signal clarity.
⚙️ Customization Features:
Pivot sensitivity (Right side control)
Minimum distance between swing lows (in %)
Label visibility, size, and color
Line width and colors for both swing levels and daily highs/lows
Mitigation cleanup lookback length
💡 How to Use:
Add the script to a qualifying intraday chart (5–15m).
Use the swing low levels to monitor liquidity-rich zones.
Combine with your personal strategy to identify liquidity grabs, potential reversal zones, or entry points following a sweep.
Let the built-in cleanup logic remove any already-mitigated levels so you can focus on active targets.
🚀 What Makes It Unique:
This isn’t just another pivot plotter — it’s a smart, self-cleaning SMC tool designed for modern liquidity-based trading strategies.
A must-have for traders using concepts like liquidity grabs, mitigation blocks, or sweep-to-reverse trade models.
🔗 Best used in combination with:
✅ First FVG — Opening Range Fair Value Gap Detector: Pinpoint the day’s first imbalance zone for intraday setups.
✅ ICT SMC Liquidity Grabs + OB + Fibonacci OTE Levels: Confluence-based entries powered by liquidity logic, order blocks, and premium/discount zones.
Used together, these scripts form a complete Smart Money toolkit — helping you build high-probability setups with confidence, clarity, and clean charts.

One Trading Setup for Life ICT [TradingFinder] Sweep Session FVG🔵 Introduction
ICT One Trading Setup for Life is a trading strategy based on liquidity and market structure shifts, utilizing the PM Session Sweep to determine price direction. In this strategy, the market first forms a price range during the PM Session (from 13:30 to 16:00 EST), which includes the highest high (PM Session High) and lowest low (PM Session Low).
In the next session, the price first touches one of these levels to trigger a Liquidity Hunt before confirming its trend by breaking the Change in State of Delivery (CISD) Level. After this confirmation, the price retraces toward a Fair Value Gap (FVG) or Order Block (OB), which serve as the best entry points in alignment with liquidity.
In financial markets, liquidity is the primary driver of price movement, and major market participants such as institutional investors and banks are constantly seeking liquidity at key levels. This process, known as Liquidity Hunt or Liquidity Sweep, occurs when the price reaches an area with a high concentration of orders, absorbs liquidity, and then reverses direction.
In this setup, the PM Session range acts as a trading framework, where its highs and lows function as key liquidity zones that influence the next session’s price movement. After the New York market opens at 9:30 EST, the price initially breaks one of these levels to capture liquidity.
However, for a trend shift to be confirmed, the CISD Level must be broken.
Once the CISD Level is breached, the price retraces toward an FVG or OB, which serve as optimal trade entry points.
Bullish Setup :
Bearish Setup :
🔵 How to Use
In this strategy, the PM Session range is first identified, which includes the highest high (PM Session High) and lowest low (PM Session Low) between 13:30 and 16:00 EST. In the following session, the price touches one of these levels for a Liquidity Hunt, followed by a break of the Change in State of Delivery (CISD) Level. The price then retraces toward a Fair Value Gap (FVG) or Order Block (OB), creating a trading opportunity.
This process can occur in two scenarios : bearish and bullish setups.
🟣 Bullish Setup
In a bullish scenario, the PM Session High and PM Session Low are identified. In the following session, the price first breaks the PM Session Low, absorbing liquidity. This process results in a Fake Breakout to the downside, misleading retail traders into taking short positions.
After the Liquidity Hunt, the CISD Level is broken, confirming a trend reversal. The price then retraces toward an FVG or OB, offering an optimal long entry opportunity.
The initial take-profit target is the PM Session High, but if higher timeframe liquidity levels exist, extended targets can be set.
The stop-loss should be placed below the Fake Breakout low or the first candle of the FVG.
🟣 Bearish Setup
In a bearish scenario, the market first defines its PM Session High and PM Session Low. In the next session, the price initially breaks the PM Session High, triggering a Liquidity Hunt. This movement often causes a Fake Breakout, misleading retail traders into taking incorrect positions.
After absorbing liquidity, the CISD Level breaks, indicating a shift in market structure. The price then retraces toward an FVG or OB, offering the best short entry opportunity.
The initial take-profit target is the PM Session Low, but if additional liquidity exists on higher timeframes, lower targets can be considered.
The stop-loss should be placed above the Fake Breakout high or the first candle of the FVG.
🔵 Setting
CISD Bar Back Check : The Bar Back Check option enables traders to specify the number of past candles checked for identifying the CISD Level, enhancing CISD Level accuracy on the chart.
Order Block Validity : The number of candles that determine the validity of an Order Block.
FVG Validity : The duration for which a Fair Value Gap remains valid.
CISD Level Validity : The duration for which a CISD Level remains valid after being broken.
New York PM Session : Defines the PM Session range from 13:30 to 16:00 EST.
New York AM Session : Defines the AM Session range from 9:30 to 16:00 EST.
Refine Order Block : Enables finer adjustments to Order Block levels for more accurate price responses.
Mitigation Level OB : Allows users to set specific reaction points within an Order Block, including: Proximal: Closest level to the current price. 50% OB: Midpoint of the Order Block. Distal: Farthest level from the current price.
FVG Filter : The Judas Swing indicator includes a filter for Fair Value Gap (FVG), allowing different filtering based on FVG width: FVG Filter Type: Can be set to "Very Aggressive," "Aggressive," "Defensive," or "Very Defensive." Higher defensiveness narrows the FVG width, focusing on narrower gaps.
Mitigation Level FVG : Like the Order Block, you can set price reaction levels for FVG with options such as Proximal, 50% OB, and Distal.
Demand Order Block : Enables or disables bullish Order Block.
Supply Order Block : Enables or disables bearish Order Blocks.
Demand FVG : Enables or disables bullish FVG.
Supply FVG : Enables or disables bearish FVGs.
Show All CISD : Enables or disables the display of all CISD Levels.
Show High CISD : Enables or disables high CISD levels.
Show Low CISD : Enables or disables low CISD levels.
🔵 Conclusion
The ICT One Trading Setup for Life is a liquidity-based strategy that leverages market structure shifts and precise entry points to identify high-probability trade opportunities. By focusing on PM Session High and PM Session Low, this setup first captures liquidity at these levels and then confirms trend shifts with a break of the Change in State of Delivery (CISD) Level.
Entering a trade after a retracement to an FVG or OB allows traders to position themselves at optimal liquidity levels, ensuring high reward-to-risk trades. When used in conjunction with higher timeframe bias, order flow, and liquidity analysis, this strategy can become one of the most effective trading methods within the ICT Concept framework.
Successful execution of this setup requires risk management, patience, and a deep understanding of liquidity dynamics. Traders can enhance their confidence in this strategy by conducting extensive backtesting and analyzing past market data to optimize their approach for different assets.

MTF OB Supply Demand ZonesHello everyone,
This exceptional indicator provides you with visual representations of bullish and bearish order blocks or supply and demand zones across multiple timeframes. In simple terms, bullish order blocks are represented by a small red candle followed by a large red candle, while bearish order blocks are depicted as a small green candle followed by a large red candle. Supply and demand zones are drawn by using order blocks.
Features:
Display order blocks from up to three different timeframes.
Customize the maximum number of boxes shown and the colors of the zones.
Choose from three different modes: OB (Order Block), Extended OB, and Supply/Demand.
Mode Descriptions:
OB: Includes the body of the candle.
Extended OB: Encompasses the body and wick of the candle.
Supply/Demand: Covers the body, wick, and half the body of the large candle.
Usage:
Ensure that charts 2 and 3 are set to a higher timeframe. For modes 2 and 3, it’s recommended to reduce the maximum number of boxes shown. The zones or boxes are transparent, allowing for overlap. This feature aids in identifying reversal zones or confirmed zones. The more intense the color, the stronger the confirmation. If a green zone overlaps a red zone (or vice versa), it signifies a reversal zone.
Thank you for checking out this indicator!
---
Additional Information:
Order blocks refer to specific price areas where large market participants, such as institutional traders, have previously placed significant buy or sell orders. These clusters of orders can impact price movement, liquidity, and market sentiment.
Order blocks are a strategic approach to identifying key levels of support and resistance based on the behavior of institutional traders. These key levels are then utilized as entry or exit points for trades.
An order block is an area where there has been a large concentration of limit orders awaiting execution. These blocks are identified on a chart by observing previous price action and pinpointing areas where the price experienced significant movement or abrupt changes in direction.
Order blocks are used in the following popular trading philosophies:
Smart Money Concepts (SMC)
Inner Circle Trading (ICT)
Price Action
---
Credits to: @AGFXTRADING

Fibonacci Inversion Fair Value Gaps | Flux Charts💎 GENERAL OVERVIEW
Introducing our new Fibonacci Inversion Fair Value Gaps (IFVG) indicator! Inverse Fair Value Gaps occur when a Fair Value Gap becomes invalidated. They reverse the role of the original Fair Value Gap, making a bullish zone bearish and vice versa. This indicator plots the Fibonacci retracement levels of the IFVG, which often act like support & resistance levels.
Features of the new Fibonacci IFVGs Indicator :
Renders Bullish / Bearish IFVG Zones
Renders Fibonacci Retracement Levels Of IFVGs
Combination Of Overlapping FVG Zones
Variety Of Zone Detection / Sensitivity / Filtering / Invalidation Settings
High Customizability
🚩UNIQUENESS
This indicator stands out with its ability to render up to 3 Fibonacci retracement levels of IFVGs. Fibonacci retracement levels are widely used within trading, and we wanted to implement them for IFVG zones. You can also customize the FVG Filtering method, FVG & IFVG Zone Invalidation, Detection Sensitivity etc. according to your needs to get the best performance from the indicator.
📌 HOW DOES IT WORK ?
A Fair Value Gap generally occur when there is an imbalance in the market. They can be detected by specific formations within the chart. An Inverse Fair Value Gap is when a FVG becomes invalidated, thus reversing the direction of the FVG.
This indicator renders 0.618, 0.5 and 0.382 (can be changed from the settings) Fibonacci retracement levels of the IFVGs, which often act as support and resistances. Check this example :
⚙️SETTINGS
1. General Configuration
FVG Zone Invalidation -> Select between Wick & Close price for FVG Zone Invalidation.
IFVG Zone Invalidation -> Select between Wick & Close price for IFVG Zone Invalidation. This setting also switches the type for IFVG consumption.
Zone Filtering -> With "Average Range" selected, algorithm will find FVG zones in comparison with average range of last bars in the chart. With the "Volume Threshold" option, you may select a Volume Threshold % to spot FVGs with a larger total volume than average.
FVG Detection -> With the "Same Type" option, all 3 bars that formed the FVG should be the same type. (Bullish / Bearish). If the "All" option is selected, bar types may vary between Bullish / Bearish.
Detection Sensitivity -> You may select between Low, Normal or High FVG detection sensitivity. This will essentially determine the size of the spotted FVGs, with lower sensitivies resulting in spotting bigger FVGs, and higher sensitivies resulting in spotting all sizes of FVGs.
Show Historic Zones -> If this option is on, the indicator will render invalidated IFVG zones as well as current IFVG zones. For a cleaner look at current IFVG zones which are not invalidated yet, you can turn this option off.
2. Fibonacci Retracement Levels
You can enable / disable up to 3 different Fibonnaci Retracement levels at this group of settings. You can also switch their line styles between solid, dashed and dotted as well as changing their colors.

Order Blocks | Flux Charts💎 GENERAL OVERVIEW
Introducing our new Volumized Order Blocks indicator! This new indicator can render order blocks with their volumetric information. It's highly customizable with detection, invalidation and style settings.
Features of the new Volumized Order Blocks indicator :
Render Bullish & Bearish Order Blocks
Enable / Disable Volumetric Information
Enable / Disable Historic Zones
Visual Customizability
📌 HOW DOES IT WORK ?
Order blocks occur when there is a high amount of market orders exist on a price range. It is possible to find order blocks using specific formations on the chart.
The high & low volume of order blocks should be taken into consideration while determining their strengths. The determination of the high & low volume of order blocks are similar to FVGs, in a bullish order block, the high volume is the last 2 bars' total volume, while the low volume is the oldest bar's volume. In a bearish order block scenario, the low volume becomes the last 2 bars' total volume.
🚩UNIQUENESS
The ability to render the total volume of Order Blocks as well as bullish / bearish volume ratio is what sets this Order Block indicator apart from others. Also the ability to combine overlapping Order Block zones will result in cleaner charts for traders.
⚙️SETTINGS
1. General Configuration
Volumetric Info -> The volumetric information of the Order Blocks will be rendered if activated.
Zone Invalidation -> Select between Wick & Close price for Order Block Invalidation.
Swing Length -> Swing length is used when finding order block formations. Smaller values will result in finding smaller order blocks.

Liquidity Voids (FVG) [LuxAlgo]The Liquidity Voids (FVG) indicator is designed to detect liquidity voids/imbalances derived from the fair value gaps and highlight the distribution of the liquidity voids at specific price levels.
Fair value gaps and liquidity voids are both indicators of sell-side and buy-side imbalance in trading. The only difference is how they are represented in the trading chart. Liquidity voids occur when the price moves sharply in one direction forming long-range candles that have little trading activity, whilst a fair value is a gap in price.
🔶 USAGE
Liquidity can help you to determine where the price is likely to head next. In conjunction with higher timeframe market structure, and supply and demand, liquidity can give you insights into potential price movement. It's essential to practice using liquidity alongside trend analysis and supply and demand to read market conditions effectively.
The peculiar thing about liquidity voids is that they almost always fill up. And by “filling”, we mean the price returns to the origin of the gap. The reason for this is that during the gap, an imbalance is created in the asset that has to be made up for. The erasure of this gap is what we call the filling of the void. And while some voids waste no time in filling, some others take multiple periods before they get filled.
🔶 SETTINGS
The script takes into account user-defined parameters and detects the liquidity voids based on them, where detailed usage for each user-defined input parameter in indicator settings is provided with the related input's tooltip.
🔹 Liquidity Detection
Liquidity Voids Threshold: Act as a filter while detecting the Liquidity Voids. When set to 0 basically means no filtering is applied, increasing the value causes the script to check the width of the void compared to a fixed-length ATR value
Bullish: Color customization option for Bullish Liquidity Voids
Bearish: Color customization option for Bearish Liquidity Voids
Labels: Toggles the visibility of the Liquidity Void label
Filled Liquidity Voids: Toggles the visibility of the Filled Liquidity Voids
🔹 Display Options
Mode: Controls the lookback length of detection and visualization
# Bars: Lookback length customization, in case Mode is set to Present
🔶 RELATED SCRIPTS
Buyside-Sellside-Liquidity
Fair-Value-Gaps

Session Open PriceThis Indicator displays the ICT kill zones' open price
You will be able to see the following open prices (ALL TIMES ARE IN NEW YORK TIME)
All times and appearances are customisable to your own liking.
The default time setting is recommended
- 00:00 AM Midnight New York Open Price (RED DASH LINE)
- 2:00 AM Frankfurt Open Price (GREEN DASH LINE)
- 3:00 AM London Open Price (BLUE DASH LINE)
- 8:30 AM New York Open Price (ORANGE DASH LINE)
HOW TO USE SESSION OPEN PRICE IN YOUR TRADING
If the price is above the opening price you only look for sells whereas if the price is under the opening price you only look for buys
BUY EXAMPLE
Wait for Midnight New York and Frankfurt open price to display
The price must be under both prices
Look for a Market maker buy model or your own entry model
Stoploss will be at the swing low and Take profit can be a fixed RR or how you calculate your take profit level
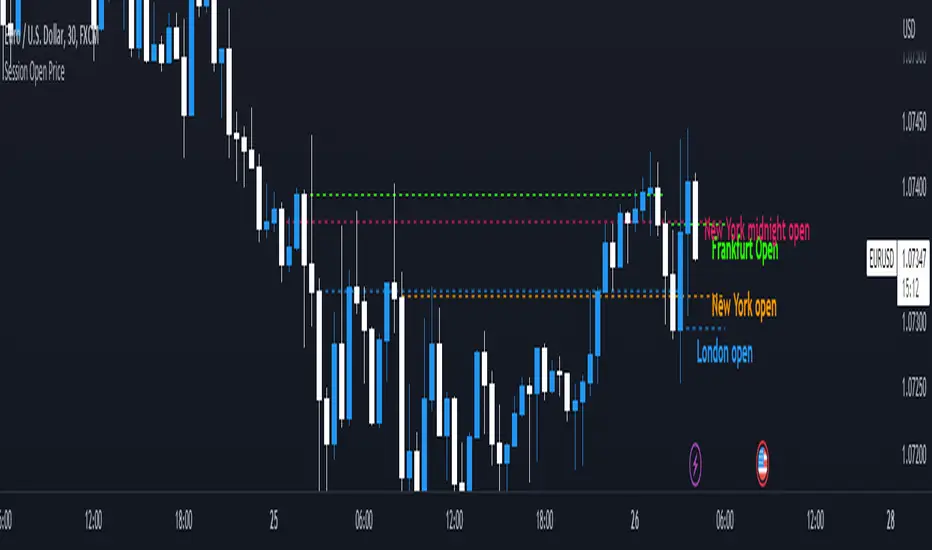
Market Structure Trailing Stop [LuxAlgo]This script returns trailing stops on the occurrence of market structure (CHoCH/BOS labeling). Trailing stops are adjusted based on trailing maximums/minimums with the option for users to be able to control how quickly a trailing stop can converge toward the price.
🔶 SETTINGS
Pivot Lookback: Pivot length used for the detection of swing points.
Increment Factor %: Controls how fast trailing stops converge toward the price, with lower values returning slower converging trailing stops.
Reset Stop On: Determines if trailing stops are reset on CHoCH structure or all (CHoCH + BOS).
Show Structure: Determines if market structure is displayed.
🔶 USAGE
Trailing stops allow traders to protect them against downside risk while also guaranteeing a potential profit in case the market goes in the expected direction of the trade.
Users making use of market structure as a primary entry condition can benefit from having trailing stops based on these to either provide an additional exit condition or to provide points of support/resistance with the price.
Trailing stops can avoid being hit more frequently by using a lower Increment Factor % setting.
Finally, users can reset the trailing stop when any market structure is detected (or only on CHoCHs). Allowing trailing stops to reset on the detection of any market structure allows the indicator to return trailing stops closer to the price. CHoCH labels are highlighted as dashed lines while BOS labels are highlighted as dotted lines.
🔶 DETAILS
When a new structure (or only CHoCH if specified by the user) is detected, trailing stops will initially be set based on the maximum/minimum made on the previous trend. This will also set the trailing maximum/minimum to the current price value.
If an uptrend is detected (most recent market structure is bullish) then the trailing stop will increase if the trailing maximum increase, the increment is calculated as:
trailing stop = trailing stop + Increment Factor % of (trailing maximum - previous trailing maximum)
If a downtrend is detected (most recent market structure is bearish) then the trailing stop will decrease if the trailing minimum decrease, the decrement is calculated as:
trailing stop = trailing stop + Increment Factor % of (trailing minimum - previous trailing minimum)
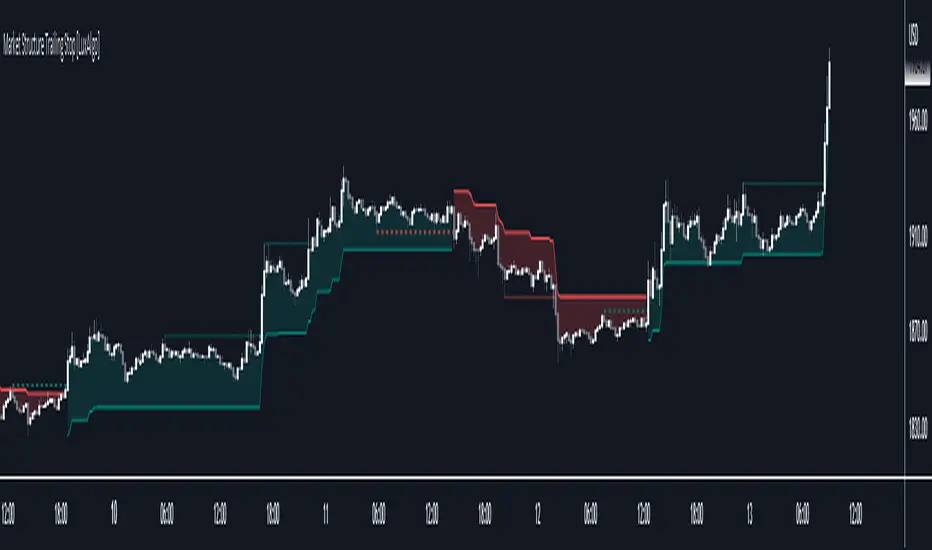
SMC sessionzz by JelleThe main function of this indicator is to make it easy to identify several smart money concepts (SMC) and ICT practices by using a single indicator. The functions themselves are not my original content, but rather a collection of several scripts with some tweaking, combined into a single indicator.
Main functions:
- Provides the ability to set bar color for London, New York and Asia sessions
- Provides the ability to set background color for London, New York and Asia sessions
- Provides the ability to indicate NY and GMT midnight on the chart by plotting vertical lines
- Provides several smart features to turn bar color and background color on/off depending on the timeframe
Usage example:
- Easily determine each session high and low by using the bar color feature
- Easily determine the daily high and low by using the vertical midnight lines
- Easily determine ICT kill zones by setting background color for each session
- Easily avoid clutter on your chart by using the timeframe filters