Script_Algo - Double Smoothed CCI Strategy📉 The uniqueness of this non-trending oscillator strategy lies in the combination of two smoothed CCI lines: one signals entry into a position from overbought/oversold zones, and the other serves as a trend filter for entries. The smoothing of the fast and slow CCI lines significantly reduces market noise, allowing the filtering of false signals often generated by the standard CCI.
📚 For those unfamiliar with CCI:
The Commodity Channel Index (CCI) is a momentum-based oscillator used to identify overbought and oversold conditions.
It helps traders spot potential trend reversals or confirm trend strength by comparing the current price to its average over a period of time.
1️⃣ General Principle of Operation
⚡ Fast CCI: Generates main signals when exiting oversold and overbought zones.
📈 Slow CCI: Acts as a trend filter. For long positions, the slow CCI must be above zero (confirmation of an uptrend), and for short positions, it must be below zero (confirmation of a downtrend). This prevents the strategy from opening trades against the dominant trend.
🛡️ Dynamic ATR Stop-Loss: Unlike fixed-percentage stop-losses, a stop tied to the Average True Range (ATR) considers market volatility. During calm periods, the stop will be narrower, allowing for more profit capture. In highly volatile periods, the stop becomes wider, protecting against premature closures caused by noise.
📊 Comprehensive Risk Management: The strategy uses not only a take-profit based on signals (exit into the opposite zone) but also a protective ATR stop-loss and a mechanism to close trades upon receiving an opposite signal (e.g., closing a long when a short signal appears).
💡 Usefulness of the Strategy:
👨💻 For traders: Provides clear, mathematically justified entry and exit signals with built-in loss protection.
📉 For analysts: Visualizes the behavior of the double CCI on a separate panel, allowing study of the interaction of the fast and slow lines and their reaction to levels without mandatory trades.
📚 For learning: An excellent example of combining multiple indicators and capital management tools into a single trading system.
2️⃣ Detailed Algorithm Logic
📥 Long Entry Signals:
The fast smoothed CCI was below the oversold level (oversold_level, e.g., -100) and crossed this level upward (fast_exits_oversold).
The slow CCI at this moment is above zero (confirming an uptrend).
If both conditions are met, a long position is opened.
📤 Long Exit: Happens under one of these conditions:
The fast CCI crosses the overbought level (overbought_level) downward (exit_long).
The price reaches a stop-loss level calculated as entry price - (ATR * multiplier).
An opposite short signal appears (enter_short).
📥 Short Entry Signals:
The fast CCI was above the overbought level (overbought_level, e.g., 100) and crossed this level downward (fast_exits_overbought).
The slow CCI at this moment is below zero (confirming a downtrend).
If both conditions are met, a short position is opened.
📤 Short Exit: Happens under one of these conditions:
The fast CCI crosses the oversold level (oversold_level) upward (exit_short).
The price reaches a stop-loss level calculated as entry price + (ATR * multiplier).
An opposite long signal appears (enter_long).
3️⃣ Default Settings Description
⚙️ General Strategy Settings (strategy):
overlay=false: The indicator is displayed in a separate panel below the chart, not overlaid on it.
default_qty_type=strategy.cash, default_qty_value=1000, initial_capital=100000: The strategy manages a virtual capital of 100,000 USD, using 1,000 USD per trade.
commission_value=0.1, slippage=1: Commission (0.1%) and slippage (1 tick) are considered for more realistic testing.
⚡ Fast CCI (Signal Generator):
Length: 8 (short enough for quick price reactions).
Source: hlc3 (average of High, Low, Close).
Smoothing: WMA (Weighted Moving Average) for smoother results than SMA.
Smoothing Length: 5 (removes part of the noise).
📈 Slow CCI (Trend Filter):
Length: 20 (standard mid-term trend period).
Source: close.
Smoothing: WMA.
Smoothing Length: 21 (even stronger smoothing for a clean trend line).
📊 Levels:
Overbought Level: 100 (classic CCI level).
Oversold Level: -100 (classic CCI level).
🛡️ Stop-Loss (ATR):
ATR Length: 6 (short period for quick adaptation).
ATR Multiplier: 10.0 (very wide stop, designed for long-term trade holding and noise filtering).
💰 As seen in backtests, this strategy shows a steadily growing equity curve with minor drawdowns. On the highly liquid crypto pair XRPUSDT, the algorithm demonstrated a fairly high win rate and relatively high profit factor on a 4-hour timeframe over 4 years, though the overall profit is moderate.
⚠️ Important Notes
Always remember: Strategy results may not repeat in the future.
The market constantly changes, so:
✅ Monitor the situation
✅ Backtest regularly
✅ Adjust settings for each asset
Also remember about possible bugs in any algorithmic trading strategy.
Even if a script is well-tested, no one knows what unpredictable events the market may bring tomorrow.
⚠️ Risk Management:
Do not risk more than 1% of your deposit per trade, otherwise you may lose your account balance, since this strategy works without stop losses.
⚠️ Disclaimer
The author of the strategy does not encourage anyone to use this algorithm and bears no responsibility for any possible financial losses resulting from its application!
Any decision to use this strategy is made personally by the owners of TradingView accounts and cryptocurrency exchange accounts.
📝 Final Notes
This is not the final version. I already have ideas on how to improve it further, so follow me to not miss updates.
🐞 Bug Reports
If you notice any bugs or inconsistencies in my algorithm,
please let me know — I will try to fix them as quickly as possible.
💬 Feedback & Suggestions
If you have any ideas on how this or any of my other strategies can be improved, feel free to write to me. I will try to implement your suggestions in the script.
Wishing everyone good luck and stable profits! 🚀💰
Smoothedcci
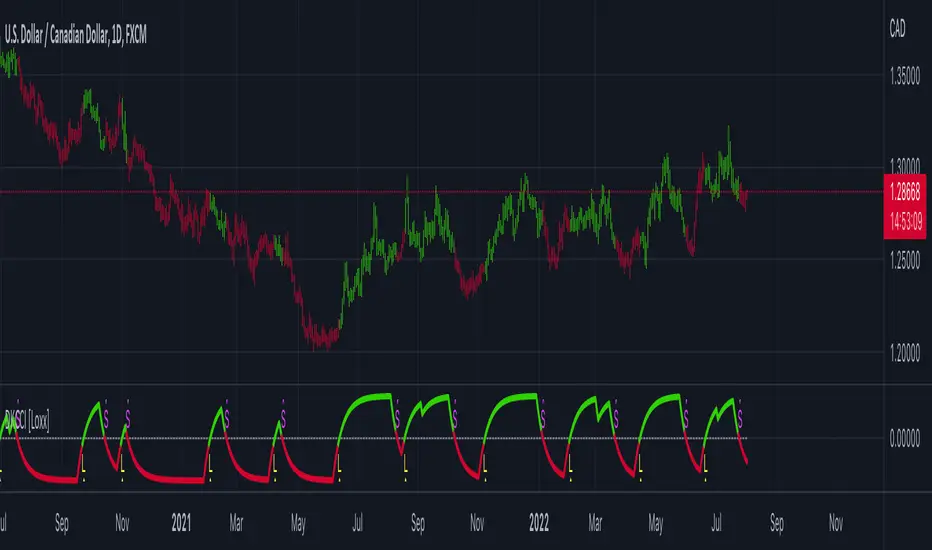
Digital Kahler CCI [Loxx]Digital Kahler CCI is a Digital Kahler filtered CCI. This modification significantly reduces noise.
What is Digital Kahler?
From Philipp Kahler's article for www.traders-mag.com, August 2008. "A Classic Indicator in a New Suit: Digital Stochastic"
Digital Indicators
Whenever you study the development of trading systems in particular, you will be struck in an extremely unpleasant way by the seemingly unmotivated indentations and changes in direction of each indicator. An experienced trader can recognise many false signals of the indicator on the basis of his solid background; a stupid trading system usually falls into any trap offered by the unclear indicator course. This is what motivated me to improve even further this and other indicators with the help of a relatively simple procedure. The goal of this development is to be able to use this indicator in a trading system with as few additional conditions as possible. Discretionary traders will likewise be happy about this clear course, which is not nerve-racking and makes concentrating on the essential elements of trading possible.
How Is It Done?
The digital stochastic is a child of the original indicator. We owe a debt of gratitude to George Lane for his idea to design an indicator which describes the position of the current price within the high-low range of the historical price movement. My contribution to this indicator is the changed pattern which improves the quality of the signal without generating too long delays in giving signals. The trick used to generate this “digital” behavior of the indicator. It can be used with most oscillators like RSI or CCI .
First of all, the original is looked at. The indicator always moves between 0 and 100. The precise position of the indicator or its course relative to the trigger line are of no interest to me, I would just like to know whether the indicator is quoted below or above the value 50. This is tantamount to the question of whether the market is just trading above or below the middle of the high-low range of the past few days. If the market trades in the upper half of its high-low range, then the digital stochastic is given the value 1; if the original stochastic is below 50, then the value –1 is given. This leads to a sequence of 1/-1 values – the digital core of the new indicator. These values are subsequently smoothed by means of a short exponential moving average . This way minor false signals are eliminated and the indicator is given its typical form.
Calculation
The calculation is simple
Step1 : create the CCI
Step 2 : Use CCI as Fast MA and smoothed CCI as Slow MA
Step 3 : Multiple the Slow and Fast MAs by their respective input ratios, and then divide by their sum. if the result is greater than 0, then the result is 1, if it's less than 0 then the result is -1, then chart the data
if ((slowr * slow_k + fastr * fast_k) / (fastr + slowr) > 50.0)
temp := 1
if ((slowr * slow_k + fastr * fast_k) / (fastr + slowr) < 50.0)
temp := -1
Step 4 : Profit
Other implementations of Digital Kahler
This is to better understand the process the DK process and it's result, and furthermore, I'm linking these because for many in the Forex community, they see DK filtered indicators as the best implementations of standard indicators.
MACD
VHF-Adaptive, Digital Kahler Variety RSI w/ Dynamic Zones
Included:
Bar coloring
Signals
Alerts
Loxx's Expanded Source Types
Loxx's Moving Averages