BBMA by RWBTradeLabBBMA by RWBTradeLab
A clean, non-repainting BBMA indicator built for traders who combine Bollinger Bands with Linear Weighted Moving Averages and EMA to track volatility expansion, price extremes, and confirmed breakout behavior using closed candles only.
What this indicator does
This script combines Bollinger Bands (20, 2) with Linear Weighted Moving Averages (LWMA) and a 50 EMA to help traders identify high-probability price extension zones and confirmed BBMA break conditions—without repainting.
All calculations and alerts are based strictly on closed candles (no running-bar signals).
Core components
Bollinger Bands
*Period: 20
*Deviations: 2
*Apply to: Close
*Visual shift supported (default 0)
*Clean white band structure for clarity
Linear Weighted Moving Averages (LWMA)
*LW MA 5 Low
*LW MA 10 Low
*LW MA 5 High
*LW MA 10 High
These weighted averages react faster to recent price action and help define dynamic BBMA zones.
Exponential Moving Average
*EMA 50
*Apply to: Close
*Method: Exponential
Used as a higher-timeframe trend and structure reference.
BBMA alert logic (closed candle only)
Lower BBMA Break
Triggered when:
*LW MA 5 Low crosses below the Lower Bollinger Band
*The candle closes below the Lower Bollinger Band
*LW MA 5 Low remains below the Lower Bollinger Band after close
Upper BBMA Break
Triggered when:
*LW MA 5 High crosses above the Upper Bollinger Band
*The candle closes above the Upper Bollinger Band
*LW MA 5 High remains above the Upper Bollinger Band after close
⚠️ No alerts are generated on running candles—only on confirmed bar close.
Visuals on chart
*Bollinger Bands plotted in clean white
*LW MAs color-coded for easy distinction
*EMA 50 plotted in green
*Optional show/hide toggles for BB, LW MAs, and EMA
Alerts
Built-in alerts trigger only on candle close:
*BBMA Lower Break (confirmed)
*BBMA Upper Break (confirmed)
Designed for reliable discretionary trading and automation without repainting issues.
Key settings
*BB Period & Deviations
*LW MA periods (5 & 10, High / Low)
*EMA period
*Visual shift for Bollinger Bands
*Individual visibility toggles
Non-repainting confirmation
All calculations, plots, and alerts are based on confirmed candles only.
No running-bar logic → no repainting.
Disclaimer
This indicator is a technical analysis tool, not financial advice.
Trading involves risk—always use proper risk management and confirm signals with your own analysis.
Creator: RWBTradeLab
If you find this indicator useful, please leave a like ⭐ and share your feedback.
SNR

QM Level Detector by RWBTradeLabQM Level Detector by RWBTradeLab
A clean, non-repainting QM level detector built for traders who track structure shifts and level-break sequences using confirmed candles only.
What this indicator does
This script detects and marks QM Levels based on a strict, rule-based sequence using closed candles only (no running-bar signals).
It identifies two types of QM:
Buy QM
A Buy QM is confirmed when the following sequence completes in order:
* V Level is detected.
* That V Level is broken down by a red candle close below the V Level price.
* After that breakdown, the most recent A Level (formed before the breakdown) is identified.
* When that A Level is later broken out by a green candle close above the A Level price, the original V Level becomes a Buy QM Level .
Sell QM
A Sell QM is confirmed when the opposite sequence completes in order:
* A Level is detected.
* That A Level is broken out by a green candle close above the A Level price.
* After that breakout, the most recent V Level (formed before the breakout) is identified.
* When that V Level is later broken down by a red candle close below the V Level price, the original A Level becomes a Sell QM Level .
Visuals on chart
* A horizontal ray (right-extended) is drawn at the confirmed QM price level.
* Label distance is adjustable via Text Offset (ticks).
Alerts
Built-in alerts trigger only on candle close when a QM is confirmed:
* Buy QM
* Sell QM
Each alert is designed for reliable automation without repainting.
Key settings
* Candle Length (closed candles): Scans the last N closed bars (running candle excluded).
* Buy QM / Sell QM toggles: Show or hide each type.
* Text toggle: Show or hide labels.
* QM Line Color and Text Offset (ticks) customization.
Non-repainting confirmation
All detection, marking, and alerts are based on confirmed candles only.
No running-bar conditions → no repainting .
Disclaimer
This indicator is a level-detection tool, not financial advice. Trading involves risk—always use proper risk management and confirm signals with your own analysis.
Creator: RWBTradeLab
If you find this useful, please leave a like ⭐ and share your feedback.

SnR Key Level Detector by RWBTradeLabSnR Key Level Detector by RWBTradeLab
A clean, non-repainting key level detector built for price action traders who want clear, fixed Support/Resistance reference levels with breakout upgrades and alerts.
What this indicator does
This script automatically detects and draws 6 types of SnR key levels using CLOSED candles only (no running-candle logic):
1. Base Key Levels (from 2-candle sequences)
* A Level: Green → Red (Level = 1st Green candle Close)
* V Level: Red → Green (Level = 1st Red candle Close)
* Bullish Gap Level: Green → Green (Level = 1st Green candle Close)
* Bearish Gap Level: Red → Red (Level = 1st Red candle Close)
2. Breakout Upgrade Levels
* RBS (Resistance → Support): When a Green candle CLOSE breaks above an A Level or Bearish Gap Level
* SBR (Support → Resistance): When a Red candle CLOSE breaks below a V Level or Bullish Gap Level
Visuals on chart
* Each detected level is drawn as a horizontal Ray extended to the right.
* Optional text labels are placed above/below the level based on the level type.
* Adjustable “Label Offset (ticks)” to keep labels cleaner on the chart.
Alerts (bar-close only)
Built-in alerts trigger only when a candle is CONFIRMED:
* A Level
* V Level
* Bullish Gap
* Bearish Gap
* SBR
* RBS
Each alert includes price and time in the message.
Key settings
* Candle Length (closed candles): Scans last N closed candles (running candle excluded).
* On/Off toggles: Enable/disable each level type and text labels individually.
* Label Offset (ticks): Controls the label distance from the level line.
Non-repainting confirmation
All levels and alerts are calculated on confirmed bars only.
No repainting, no running-bar signals.
Best use
Works on any market and timeframe. For higher reliability, combine with:
* Higher timeframe structure
* Supply & Demand zones
* Trend context and liquidity sweeps
Disclaimer:
This indicator is a level-detection tool, not financial advice. Trading involves risk; always use proper risk management and confirm levels with your own analysis.
Creator: RWBTradeLab
If you find this useful, please leave a like ⭐ and share your feedback.

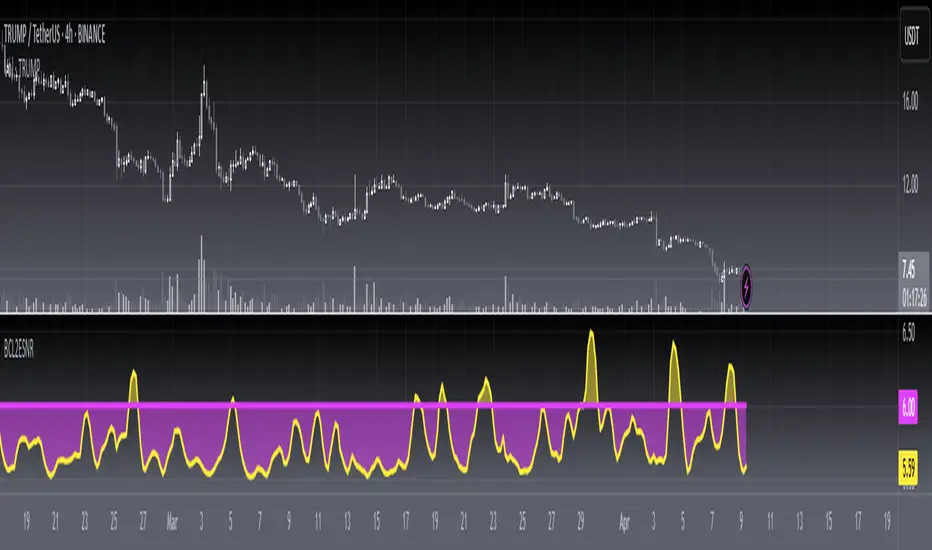
Volatility Signal-to-Noise Ratio🙏🏻 this is VSNR: the most effective and simple volatility regime detector & automatic volatility threshold scaler that somehow no1 ever talks about.
This is simply an inverse of the coefficient of variation of absolute returns, but properly constructed taking into account temporal information, and made online via recursive math with algocomplexity O(1) both in expanding and moving windows modes.
How do the available alternatives differ (while some’re just worse)?
Mainstream quant stat tests like Durbin-Watson, Dickey-Fuller etc: default implementations are ALL not time aware. They measure different kinds of regime, which is less (if at all) relevant for actual trading context. Mix of different math, high algocomplexity.
The closest one is MMI by financialhacker, but his approach is also not time aware, and has a higher algocomplexity anyways. Best alternative to mine, but pls modify it to use a time-weighted median.
Fractal dimension & its derivatives by John Ehlers: again not time aware, very low info gain, relies on bar sizes (high and lows), which don’t always exist unlike changes between datapoints. But it’s a geometric tool in essence, so this is fundamental. Let it watch your back if you already use it.
Hurst exponent: much higher algocomplexity, mix of parametric and non-parametric math inside. An invention, not a math entity. Again, not time aware. Also measures different kinds of regime.
How to set it up:
Given my other tools, I choose length so that it will match the amount of data that your trading method or study uses multiplied by ~ 4-5. E.g if you use some kind of bands to trade volatility and you calculate them over moving window 64, put VSNR on 256.
However it depends mathematically on many things, so for your methods you may instead need multipliers of 1 or ~ 16.
Additionally if you wanna use all data to estimate SNR, put 0 into length input.
How to use for regime detection:
First we define:
MR bias: mean reversion bias meaning volatility shorts would work better, fading levels would work better
Momo bias: momentum bias meaning volatility longs would work better, trading breakouts of levels would work better.
The study plots 3 horizontal thresholds for VSNR, just check its location:
Above upper level: significant Momo bias
Above 1 : Momo bias
Below 1 : MR bias
Below lower level: significant MR bias
Take a look at the screenshots, 2 completely different volatility regimes are spotted by VSNR, while an ADF does not show different regime:
^^ CBOT:ZN1!
^^ INDEX:BTCUSD
How to use as automatic volatility threshold scaler
Copy the code from the script, and use VSNR as a multiplier for your volatility threshold.
E.g you use a regression channel and fade/push upper and lower thresholds which are RMSEs multiples. Inside the code, multiply RMSE by VSNR, now you’re adaptive.
^^ The same logic as when MM bots widen spreads with vola goes wild.
How it works:
Returns follow Laplace distro -> logically abs returns follow exponential distro , cuz laplace = double exponential.
Exponential distro has a natural coefficient of variation = 1 -> signal to noise ratio defined as mean/stdev = 1 as well. The same can be said for Student t distro with parameter v = 4. So 1 is our main threshold.
We can add additional thresholds by discovering SNRs of Student t with v = 3 and v = 5 (+- 1 from baseline v = 4). These have lighter & heavier tails each favoring mean reversion or momentum more. I computed the SNR values you see in the code with mpmath python module, with precision 256 decimals, so you can trust it I put it on my momma.
Then I use exponential smoothing with properly defined alphas (one matches cumulative WMA and another minimizes error with WMA in moving window mode) to estimate SNR of abs returns.
…
Lightweight huh?
∞

Malaysian SNR Levels - Fixed Range# Malaysian SNR Levels - Fixed Range
This indicator displays support and resistance levels based on Malaysian SnR methodology, but calculates levels exclusively from a **user-defined time range** instead of a fixed number of bars lookback.
## What is Malaysian SnR?
Malaysian SnR defines Support and Resistance not as areas but as precise levels based on a line chart's peaks and valleys. There are three types of horizontal levels:
### Level Types
**A-Level**: Located at the peak of the line chart, shaped like the letter "A"
**V-Level**: Located at the valley of the line chart, shaped like the letter "V"
**Gap Level**: Located at the Close/Open gap between two candles of the same color
## Fresh vs. Unfresh Levels
What makes Malaysian SnR unique is the **Fresh/Unfresh state** of levels:
- **Fresh Level** (solid line): Has not been tested by a wick yet, or has been crossed by a candle body since the last wick touch
- **Unfresh Level** (dashed line): Has been touched by a wick
Fresh levels are considered more significant as they have a higher probability of causing price reactions.
## Fixed Range Innovation
Unlike the standard Malaysian SNR indicator that uses a bars lookback period, this **Fixed Range version** allows you to:
- Select a specific **Start Time** and **End Time** to define your analysis period
- Calculate levels exclusively from bars within this time range
- Analyze historical periods precisely (e.g., "levels from Q1 2024")
- Study how levels from specific market phases perform
- Visualize the selected time range with a transparent background overlay
This is particularly useful for:
- Analyzing levels from specific market events or sessions
- Studying quarterly or monthly ranges
- Backtesting level significance from defined periods
- Forward-testing levels formed during key accumulation/distribution phases
## Parameters
### TIME RANGE SELECTION
- **Start Time**: Beginning of the time range for level calculation
- **End Time**: End of the time range for level calculation
- **Extend Levels Right**: Extend levels to the right edge of the chart
### LEVEL SETTINGS
- **Display Gap Levels**: Show/hide gap levels
- **Display Opening Gaps**: Show/hide gap visualization boxes
- **Display Fresh Levels Only**: Hide unfresh/tested levels
- **Display Break Count**: Show how many times each level has been broken
- **Evaluate Current Bar**: Use the current bar to evaluate level freshness
### LEVEL DISPLAY
- **Level Regions**: Calculate levels relative to current Price or bar's High/Low
- **Levels Above**: Number of closest levels to display above price/high
- **Levels Below**: Number of closest levels to display below price/low
- **Max Level Breaks**: Hide levels broken more than this number of times
### VISUAL SETTINGS
- **Line Color**: Color of the level lines
- **Line Width**: Thickness of level lines
- **Show Time Zone Background**: Display transparent background for selected range
- **Zone Background Color**: Customize background color and transparency
- **Timeframe**: The timeframe used for calculating SNR levels
## Trading Applications
### Example Strategy:
1. Select a significant time range (e.g., a major accumulation zone)
2. Identify fresh levels from that period
3. Wait for price to approach these levels on a higher timeframe
4. Switch to lower timeframe to confirm price reaction
5. Fresh support + bullish reaction = potential buy signal
6. Fresh resistance + bearish reaction = potential sell signal
### Use Cases:
- **Session Analysis**: Study levels from Asian/European/US sessions
- **Event-Based Levels**: Analyze levels formed during specific news events
- **Quarterly Ranges**: Track levels from previous quarters
- **Accumulation Zones**: Identify key levels from consolidation periods
## Visual Features
- **Solid lines** = Fresh levels (untested or re-validated)
- **Dashed lines** = Unfresh levels (tested by wicks)
- **Numbers on levels** = Break count (how many times broken)
- **Transparent boxes** = Opening gaps between same-colored candles
- **Background shading** = Selected time range visualization
## Notes
- The indicator processes only bars within the selected time range
- Levels are tested for freshness using all available bars (including those outside the range)
- Break count shows how many times the level has been broken by candle bodies
- The background helps visualize which time period was used for level formation
---
**Tip**: Combine this with the standard Malaysian SNR indicator to compare recent levels (bars lookback) with historical levels (fixed range) for comprehensive multi-timeframe analysis.

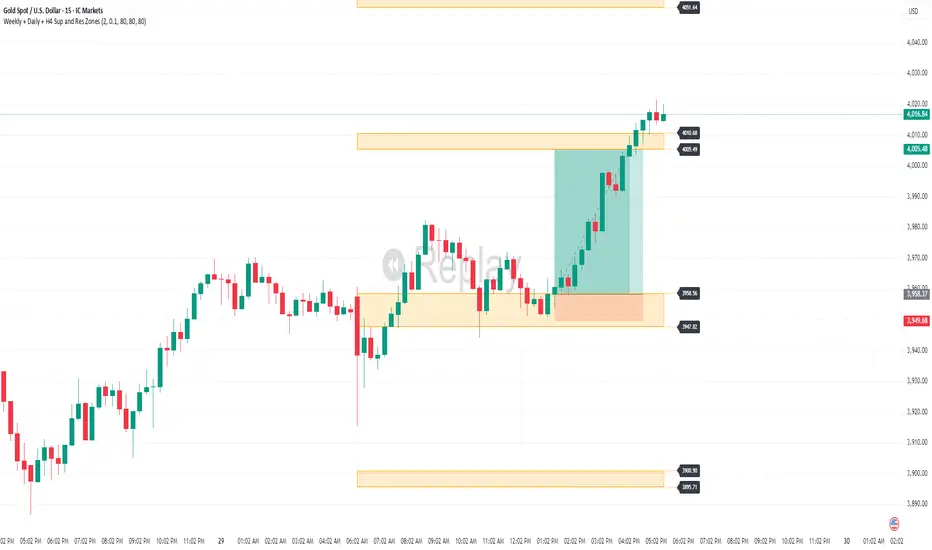
Weekly + Daily + H4 Sup and Res ZonesEveryday price move at a set range. Just wait at the zone for candle reversal/continuation pattern formation before entry. Always keep it simple. Patience is key. Just Pick your preferred tf zone. Daily zone highly recommended for less than 100 pips target. H4 for scalpers and Weekly for swingers.
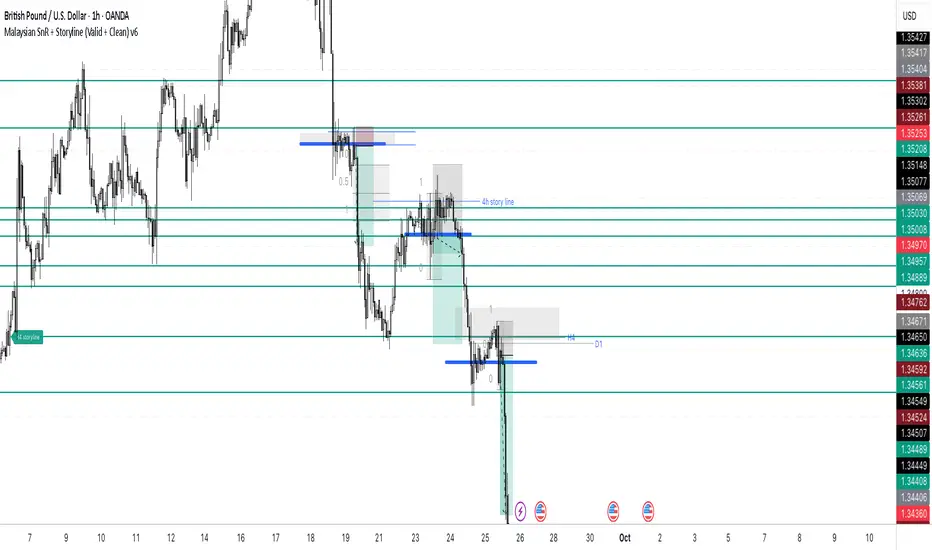
Malaysian SnR + Storyline This indicator combines the Malaysian Support & Resistance (SnR) method with a Multi-Timeframe Storyline view.
🔹 Malaysian SnR (A/V levels)
Plots Support & Resistance using candlestick bodies only (close → open).
“A” shape = Resistance (bullish close → bearish open).
“V” shape = Support (bearish close → bullish open).
Supports Fresh/Unfresh logic with wick-touch validation.
🔹 Storyline (W/D/H4/H1 bias lines)
Weekly = Big map / macro bias.
Daily = Medium trend / retracement.
H4 = Intraday bias confirmation.
H1 = Execution bias (entry filter).
Lines extend forward and only update when a new pivot confirms.
🔹 Extra Features
Alignment Rule: option to hide A/V levels when TF biases don’t align (e.g. W=D=H4=H1).
Story Labels: optional text labels describing each TF storyline.
History filter: show storyline for the last X days only, for cleaner charts.
This script is designed for price action traders who want to combine body-based SnR levels with a clear multi-timeframe bias storyline, making it easier to align intraday execution with higher timeframe context.
Fundur - Easy ZonesFundur Easy Zones Trading Indicator
The Fundur Easy Zones trading indicator is designed to simplify market analysis by visually marking critical trading zones. This tool helps traders identify optimal buy and sell areas based on historical price action, making it easier to make informed trading decisions.
Calculation Methodology
The Easy Zones indicator employs pivot point calculations combined with price action analysis and the Average True Range (ATR) to determine key trading zones. These zones are calculated by analyzing market volatility and price movements within each timeframe, allowing the identification of significant discount and premium levels.
Pivot Points: The indicator calculates pivot points based on the average of high, low, and close prices from previous periods. These pivot points serve as the foundational levels from which discount and premium zones are derived.
Price Action Analysis: Historical price data is scrutinized to identify patterns and behaviors that signify potential reversal points. This analysis helps in pinpointing zones where the market is likely to experience significant support (discount) or resistance (premium).
Average True Range (ATR): ATR is used to measure market volatility. By incorporating ATR into the calculations, the indicator adjusts the zone boundaries to reflect current market conditions, ensuring that the zones remain relevant and accurate. Higher ATR values indicate greater volatility and wider zones, while lower ATR values result in narrower zones.
Discount and Premium Levels: Based on the pivot points and ATR, the indicator calculates various tiers of discount and premium levels. These tiers (D1, D2, D3 for discounts and P1, P2, P3 for premiums) represent increasing levels of price deviation from the mean, providing traders with clear entry and exit points.
Features Overview
Zones Settings:
Zones History Length: Adjust the number of historical zones displayed on the chart to analyze past price behavior.
Levels Line Width: Customize the thickness of the zone lines for better visibility.
Structure Settings:
Show Fair Value: Display the fair value zone, providing a visual reference for equilibrium price levels. The fair value is calculated based on the median price over the selected period.
DP (Discount and Premium) Settings:
Enable Discount and Premium Levels: Activate the display of critical buy (discount) and sell (premium) zones. These zones are determined using price deviation analysis from the mean, identifying significant discount (support) and premium (resistance) levels.
Tiered Levels: Visualize up to three levels of discount and premium zones, each with specific target prices (TP1, TP2, TP3), representing different levels of price deviation significance.
Highlight Buy and Sell Zones:
Enable Background: Highlight the background of buy and sell zones for enhanced clarity.
Label Settings:
Enable All Labels: Ensure all labels are visible for quick reference.
Show Descriptive Title: Display titles for each zone, making it easier to understand the context.
Show Take Profit Targets (TP): Clearly mark take profit targets within each zone.
Show Price: Display price levels for each zone for precise entry and exit points.
Symbols Settings:
Fair Value, Premium, and Discount Indicators: Customize symbols to represent gaining or losing fair value, premium, and discount levels, enhancing visual cues for market sentiment.
How to Use the Easy Zones Indicator
Identifying Entry Points:
Use the Discount Zones to identify optimal buy areas. The levels (D1, D2, D3) represent increasing levels of discount, with D1 being the least discounted and D3 the most.
Place buy orders at or near these zones to take advantage of potential price reversals.
Identifying Exit Points:
Use the Premium Zones to identify optimal sell areas. The levels (P1, P2, P3) represent increasing levels of premium, with P1 being the least and P3 the highest.
Place sell orders at or near these zones to maximize profits on upward price movements.
Using Fair Value:
The Fair Value Zone provides a balanced price level where the market is likely to return. Use this as a reference point for setting realistic entry and exit targets.
Strategic Planning:
Combine Discount and Premium Zones with the Fair Value Zone to create a strategic trading plan.
Monitor the zones for price reactions and adjust your trading strategy accordingly.
Best Practices
Historical Analysis:
Regularly review historical price actions within the marked zones to understand market behavior.
Customization:
Adjust the settings to suit your trading style and market conditions. Experiment with different zone lengths and line widths for optimal clarity.
Risk Management:
Always use stop-loss orders in conjunction with the identified zones to manage risk effectively.
By integrating the Fundur Easy Zones indicator into your trading strategy, you can enhance your market analysis, make more informed decisions, and ultimately improve your trading performance.

close price numberIn this script, we're creating a custom indicator to plot the previous day's closing price on the chart. This script retrieves the previous day's close using ta.change(time('d')) function. Then, it checks the value of the previous day's close and determines the increment accordingly input . Finally, it calculates the current day's close by adding the increment to the previous day's close and plots it on the chart.
The script can be integrated into a trading strategy to generate buy or sell signals based on the crossing closing price+increment line ...
Psychological Levels: previous day close price + increment numbers tend to have psychological significance in trading. Traders often pay attention to these levels because they represent key price levels that are easy to remember and widely recognized. When the price approaches these levels, traders may anticipate increased buying or selling pressure, leading to potential support or resistance.
For take profit and stop loss -Trader can use this as a take profit level on every previous day close+increment or close-decrement
buy signal-
1)whenever price cross any previous day close+number it give buy signal
2) i am using ma for filter buy signal we can enable and disable that function from input
sell signal-
1)whenever price cross any previous day close-number it give sell signal
2) i am using ma for filter sell signal we can enable and disable that function from input
Malaysian SnR LevelsThis indicator can be used to display support and resistance levels in accordance with Malaysian SnR , in which Support and Resistance are not areas in a chart but clear levels of a line chart. The term line chart refers the current chart in Tradingview as type Line (not Candles) with it's peaks and valleys.
There are 3 different horizontal levels in Malaysian SnR:
A-Level: This level is located at the peak of this line chart. It is named so because this peak has the shape of the letter A.
V-Level: Level at the valley of a line chart, which reminds of the letter V.
The A- and V-Levels are formed for the current chart / timeframe and you can define with the parameter Bars Lookback how many candles will be taken into account for adding the levels.
Gap level: This level is located at the Close/Open gap between two candles of the same color. The period for these levels is also defined by the option Bars Lookback .
The levels are shown as horizontal lines and mark Support when they are below the current price and Resistance when they are above it.
What makes the indicator so special is that conventional support and resistance indicators only use ranges, but Malaysian SnR uses clear and accurate levels at the peaks and valleys (and gaps), which can be of the state Fresh or Unfresh . But what does this state mean and how is it displayed in this indicator?
A level is designated as fresh if it has either not yet been tested, i.e. it has not been touched by a wick. If a level was no longer fresh, it can become fresh again if it is crossed by the body of a candle. If it is then touched by a wick again afterwards, it is considered unfresh (tested) again.
If a level is fresh, the theory of Malaysian SnR assumes that there is a greater probability that the price will react at that level and move in the opposite direction because this fresh Support / Resistance level is more significant than an unfresh level.
The indicator is calculating this state and displays the levels then in a different way. Fresh levels are displayed as solid lines, unfresh levels are displayed as dashed lines. It is also possible to hide unfresh levels, so that only the fresh levels are visible in the chart.
The Fresh -state of a level would be very hard to see without it the indicator:
If the script would just display all the levels that can be found for the Bars Lookback period, the chart woulkd still be full of levels. To filter this and display the most relevant levels, you can use the options Levels above/below price (number of levels) so that only the levels are displayed that are the closest ones to the current price.
Parameters of the indicator
Line Color: Line color of the levels
Line Width: Thickness of the levels
Display gap levels: Should the Gap-Levels be displayed or not
Display fresh levels only: Should unfresh / tested levels be hidden in the chart
Bars Lookback: Number of bars lookback period at which levels will be added to the chart
Levels Above Price: Number of levels that should be displayed above the price. It will be the closest levels to the price that can be found.
Levels Below Price: Number of levels that should be displayed below the price. It will be the closest levels to the price that can be found.
Timeframe Limit: Indicator will only be visible for this timeframe and above.
How to trade with Malaysian SnR levels?
One way to trade with these levels is for instance to wait on a higher timeframe like the Daily til price is reaching a fresh level. At this point a trader could switch to a lower timeframe to check if price is reacting at this level, which is when price is moving into the opposite direction.
So reaching a level of Support and then see price moving to the upside on a lower timeframe can be used as a buy signal - on the other hand if price is reaching a level of Resistance and then moving away from it to the downside on a lower timeframe, this can be used as a sell signal.

Multi Timeframe Support and Resistance [ABA Invest]About
Automatic level of support and resistance ( SnR ) in the chart. It helps users to decide where is the level of SnR and also optimize the level by changing the input base on their needs
Input:
Pivot - The number of bars left and right side of the pivot to choose how detailed the SnR level
Type - To draw the line on the candle wick endpoints or body
Timeframes option - you can choose to display other timeframes beside the current chart timeframe
Adaptive moving average - to help users identify breaks of the SnR level with the moving average line
Line length - length of the moving average line if you activate the adaptive moving average option
How to use:
Attach the indicator to the chart and then you will find the red and green lines. Red line work as resistance level and green line works as support level and also you can merge adjacent line levels into an area of SnR.
The Adaptive moving average (AMA) line function is to see the break of SnR level and prepare for the setup.
Buy setup: AMA line break resistance level, when the price retest the support (the previous break resistance) we can enter buy trade
Sell setup: AMA line break support level, when the price retest the resistance (the previous break support) we can enter sell trade
Note: Don’t blindly follow the AMA trend signal

[blackcat] L2 Ehlers Enhanced Signal to Noise IndicatorLevel: 2
Background
John F. Ehlers introuced another Enhanced Signal to Noise Indicator in his "Rocket Science for Traders" chapter 8.
Function
blackcat L2 Ehlers Signal to Noise Indicator is used to measure Signal-to-Noise Ratio (SNR). In this code, the period of the measured dominant cycle is calculated in exactly the same manner as we calculated it for the Primary SNR Indicator. Near the end of the code, after the dominant cycle is determined, Dr. Ehlers computes the SNR. The Quadrature component Q3 is calculated by multiplying the 2-bar momentum of the Weighted Moving Average (WMA) smoothing by the dominant cycle amplitude correction factor.
Key Signal
Smooth --> 4 bar WMA w/ 1 bar lag
Detrender --> The amplitude response of a minimum-length HT can be improved by adjusting the filter coefficients by
trial and error. HT does not allow DC component at zero frequency for transformation. So, Detrender is used to remove DC component/ trend component.
Q1 --> Quadrature phase signal
I1 --> In-phase signal
Period --> Dominant Cycle in bars
SNR --> Signal-to-Noise Ratio
Pros and Cons
100% John F. Ehlers definition translation of original work, even variable names are the same. This help readers who would like to use pine to read his book. If you had read his works, then you will be quite familiar with my code style.
Remarks
The 6th script for Blackcat1402 John F. Ehlers Week publication.
Readme
In real life, I am a prolific inventor. I have successfully applied for more than 60 international and regional patents in the past 12 years. But in the past two years or so, I have tried to transfer my creativity to the development of trading strategies. Tradingview is the ideal platform for me. I am selecting and contributing some of the hundreds of scripts to publish in Tradingview community. Welcome everyone to interact with me to discuss these interesting pine scripts.
The scripts posted are categorized into 5 levels according to my efforts or manhours put into these works.
Level 1 : interesting script snippets or distinctive improvement from classic indicators or strategy. Level 1 scripts can usually appear in more complex indicators as a function module or element.
Level 2 : composite indicator/strategy. By selecting or combining several independent or dependent functions or sub indicators in proper way, the composite script exhibits a resonance phenomenon which can filter out noise or fake trading signal to enhance trading confidence level.
Level 3 : comprehensive indicator/strategy. They are simple trading systems based on my strategies. They are commonly containing several or all of entry signal, close signal, stop loss, take profit, re-entry, risk management, and position sizing techniques. Even some interesting fundamental and mass psychological aspects are incorporated.
Level 4 : script snippets or functions that do not disclose source code. Interesting element that can reveal market laws and work as raw material for indicators and strategies. If you find Level 1~2 scripts are helpful, Level 4 is a private version that took me far more efforts to develop.
Level 5 : indicator/strategy that do not disclose source code. private version of Level 3 script with my accumulated script processing skills or a large number of custom functions. I had a private function library built in past two years. Level 5 scripts use many of them to achieve private trading strategy.
[blackcat] L2 Ehlers Signal to Noise IndicatorLevel: 2
Background
John F. Ehlers introuced Signal to Noise Indicator in his "Rocket Science for Traders" chapter 8. Dr. Ehlers terms the case where half the average daily trading range is equal to the signal amplitude as our zero decibel Signal-to-Noise Ratio (0 dB SNR) condition. He wants the signal amplitude to be at least twice the noise amplitude (6dB SNR) so that there exists a reasonable chance to make a profit from the chart analysis.
Function
blackcat L2 Ehlers Signal to Noise Indicator is used to measure Signal-to-Noise Ratio (SNR). The SNR in decibels is calculated in a single line of code near the end. The signal power is divided by the noise power to get a power ratio. The logarithm of the power ratio. At 0 dB, the peak-to-peak noise signal is twice the amplitude of the signal. Therefore, when we compute the 0 dB case, the ratio is calculated to be 10*log(1/2)^2 = -6 dB. We must then add 6 dB back into the computation to remove this bias, establishing the definition of 0 dB SNR.
Key Signal
Smooth --> 4 bar WMA w/ 1 bar lag
Detrender --> The amplitude response of a minimum-length HT can be improved by adjusting the filter coefficients by
trial and error. HT does not allow DC component at zero frequency for transformation. So, Detrender is used to remove DC component/ trend component.
Q1 --> Quadrature phase signal
I1 --> In-phase signal
Period --> Dominant Cycle in bars
SNR --> Signal-to-Noise Ratio
Pros and Cons
100% John F. Ehlers definition translation of original work, even variable names are the same. This help readers who would like to use pine to read his book. If you had read his works, then you will be quite familiar with my code style.
Remarks
The 5th script for Blackcat1402 John F. Ehlers Week publication.
Readme
In real life, I am a prolific inventor. I have successfully applied for more than 60 international and regional patents in the past 12 years. But in the past two years or so, I have tried to transfer my creativity to the development of trading strategies. Tradingview is the ideal platform for me. I am selecting and contributing some of the hundreds of scripts to publish in Tradingview community. Welcome everyone to interact with me to discuss these interesting pine scripts.
The scripts posted are categorized into 5 levels according to my efforts or manhours put into these works.
Level 1 : interesting script snippets or distinctive improvement from classic indicators or strategy. Level 1 scripts can usually appear in more complex indicators as a function module or element.
Level 2 : composite indicator/strategy. By selecting or combining several independent or dependent functions or sub indicators in proper way, the composite script exhibits a resonance phenomenon which can filter out noise or fake trading signal to enhance trading confidence level.
Level 3 : comprehensive indicator/strategy. They are simple trading systems based on my strategies. They are commonly containing several or all of entry signal, close signal, stop loss, take profit, re-entry, risk management, and position sizing techniques. Even some interesting fundamental and mass psychological aspects are incorporated.
Level 4 : script snippets or functions that do not disclose source code. Interesting element that can reveal market laws and work as raw material for indicators and strategies. If you find Level 1~2 scripts are helpful, Level 4 is a private version that took me far more efforts to develop.
Level 5 : indicator/strategy that do not disclose source code. private version of Level 3 script with my accumulated script processing skills or a large number of custom functions. I had a private function library built in past two years. Level 5 scripts use many of them to achieve private trading strategy.
True Strong Classical Support/Resistance LevelsThis script is based on the approach of filtering signals by checking higher timeframes.
So basically setting higher numbers in "Strength Of Levels" option, will make the indicator check for support and/or resistance levels in timeframes higher than the current.
Unfortunately, I was forced to still use inefficient built-in functions pivothigh() and pivotlow(). I hope they fix them up soon!
I'm looking for any opinion about the idea and if you like any of my scripts, anything you send means a lot to me.
This script is published for the third time because of some moderators absurd behavior.
But thank heavens, the code is now more clean and of course the option "Strength Of Levels" accepts float numbers.

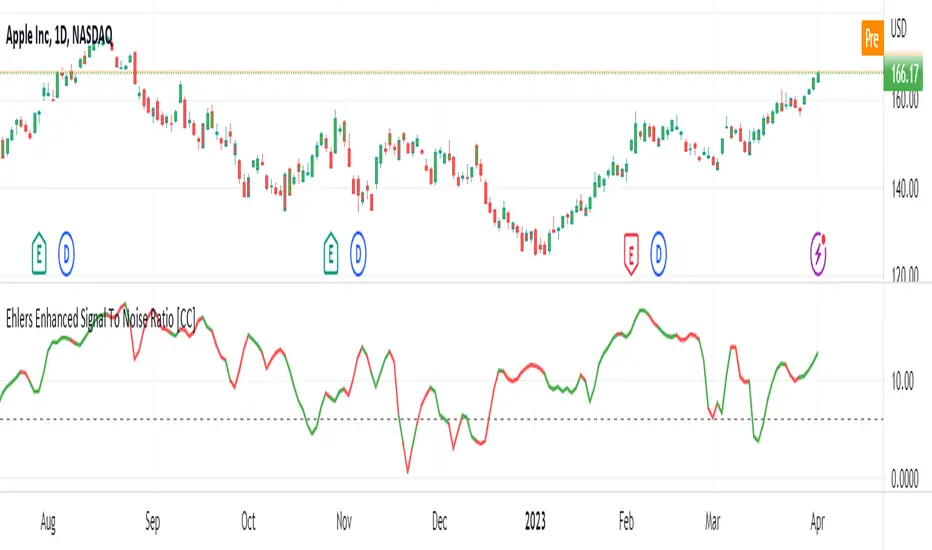
Ehlers Enhanced Signal To Noise Ratio [CC]The Enhanced Signal To Noise Ratio was created by John Ehlers (Rocket Science For Traders pgs 87-88) and this is my favorite Ehlers Signal To Noise Ratio indicator. Scalpers like to use this indicator because when it is above the dotted line then the stock is trending and not trading sideways. Buy when the indicator line is green and sell when it is red.
Let me know when you want to see me publish other indicators or if you want something custom done!
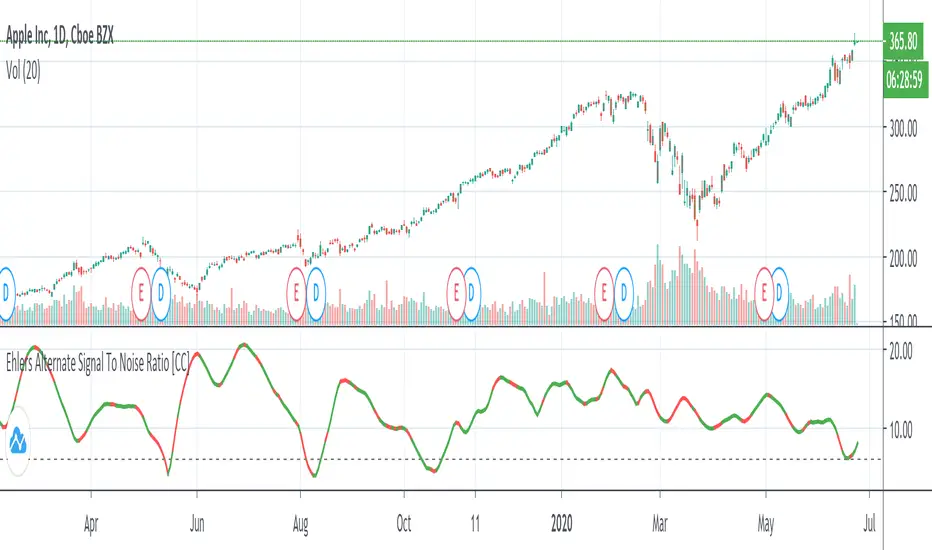
Ehlers Alternate Signal To Noise Ratio [CC]The Alternate Signal To Noise Ratio was created by John Ehlers (Rocket Science For Traders pgs 84-85) and this is a variation of his signal to noise ratio that some scalpers might find more useful than his default signal to noise ratio. You would want to buy and sell when the indicator is above the dotted line because that means the stock is volatile enough to maximize any movement of the trade in either direction. Buy when the indicator line is green and sell when it is red.
Let me know if there are other indicators you would like to see me publish or if you want something custom done!
Hidden Supports & Resistances + Round LevelsIf you search the internet, you won't find much about these types of resistance and support levels. Hidden levels are SnR levels calculated based on some psychological patterns and sometimes it's unbelievable that the chart responds to these levels.
So use the indicator and check the idea.

Classical Supports & ResistancesThis indicator shows classical resistance and support levels which retraced the chart lately. Notice that the condensed lines laying close together are showing an area of support and/or resistance.
But after all, it was a tedious work creating this indicator because like I've already said, pine script is a very odd and weak language which does not have many ordinary features like useful loops, simple line drawing and even reasonable variable casting!
So I was forced to use its built-in pivothigh() and pivotlow() functions without any handy documentation. I assume that even these functions don't work as expected, and because of that, I embedded "Sensitivity" and "Lookback Time" options in the indicator as a workaround.
Feel free to use it and send me your comments/solutions.
Ehlers Signal To Noise Ratio [CC]The Signal To Noise Ratio was created by John Ehlers (Rocket Science For Traders pgs 81-82) and this indicator is perfect for all of the scalpers out there! This will let you know when the stock is at a high volatility or not and when to buy or sell. If the indicator crosses over the dotted line then that means the stock is volatile and it is trading flat then it will be below the dotted line. Buy when the indicator line is green and sell when it is red.
This was a custom request so let me know if there are any other scripts you would like me to publish or if you want something custom done!

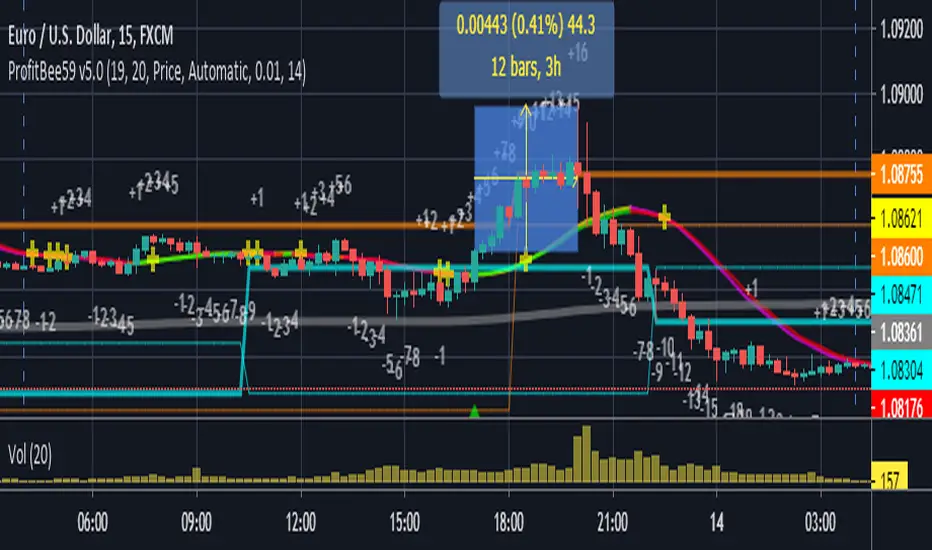
ProfitBee59 v5.0ProfitBee59 v5.0 for TradingView (pb5 ai) helps you do tedious works on your technical charts. It does CC59 counting and prints out positive or negative number on each price bar. When the counting arrives at -9 or +9, it creates respectable support and resistance ( SNR ) levels on the chart. It draws a pair of fast/slow average lines with pink/red colors for corresponding downtrend and yellow/green for uptrend. A yellow cross sign shows a crossing point between these fast/slow average line. It also draws a mega average line in gray to give a mega trend picture. Pb5 ai provides time/price analyseses. Up/Dn arrows are printed out at high probability buy/sell regions. In addition, other auxiliary tools such as Max/Min finder used to find the candlesticks with local max/min prices or Gap finder used to locate discontinuity between candlesticks.
For Forex trading, other intraday parameters are also available including the day opening level, high/low of yesterday and intraday brown background marking time interval for key trading hours in Asian-London-New York markets.
Smart phone/tablet and PC notifications of events occurring in the chart can be sent to you by server-side alerts so that you don't have to stay in front of the screen all the time.
=================================================================
The script ProfitBee59 v5.0 for TradingView (pb5 ai) is locked and protected. Contact the author for your access.
=================================================================
How to install the script:
------------------------------
*Go to the bottom of this page and click on "Add to Favorite Scripts".
*Remove older version of the script by clicking on the "X" button behind the indicator line at the top left corner of the chart window.
*Open a new chart at and click on the "Indicators" tab.
*Click on the "Favorites" tab and choose "ProfitBee59 v5.0".
*Right click anywhere on the graph, choose "Color Theme", the select "Dark".
*Right click anywhere on the graph, choose "Settings".
*In "Symbol" tab, set "Precision" to 1/100 for stock price or 1/100000 for Forex and set "Time Zone" to your local time.
*In "Scales" tab, check "Indicator Last Value Label".
*In "Events" tab, check "Show Dividends on Chart", "Show Splits on Chart" and "Show Earnings on Chart".
*At the bottom of settings window, click on "Template", "Save As...", then name this theme of graph setting for future call up such as "My chart setting".
*Click OK.
Intraday Support and ResistanceDisplay daily preferred trading and display support and resistance (modified) which is calculate using daily pivots

Signal To Noise Ratio IndicatorThis is a trend indicator at its core so combine with rsi or a moving average of your choice to see which direction the stock is trending in.
Only enter a position (long or short) when signal to noise ratio is above the signal line
This is one of my first indicators posted on here so be sure to leave me feedback

[CS] AMA Strategy - Channel Break-Out"There are various ways to detect trends with moving averages. The moving average is a rolling filter and uptrends are detected when either the price is above the moving average or when the moving average’s slope is positive.
Given that an SMA can be well approximated by a constant-α AMA, it makes a lot of sense to adopt the AMA as the principal representative of this family of indicators. Not only it is potentially flexible in the definition of its effective lookback but it is also recursive. The ability to compute indicators recursively is a very big positive in latency-sensitive applications like high-frequency trading and market-making. From the definition of the AMA, it is easy to derive that AMA > 0 if P(i) > AMA(i-1). This means that the position of the price relative to an AMA dictates its slope and provides a way to determine whether the market is in an uptrend or a downtrend."
You can find this and other very efficient strategies from the same author here:
www.amazon.com
In the following repository you can find this system implemented in lisp:
github.com
To formalize, define the upside and downside deviations as the same sensitivity moving averages of relative price appreciations and depreciations
from one observation to another:
D+(0) = 0 D+(t) = α(t − 1)max((P(t) − P(t − 1))/P(t − 1)) , 0) + (1 − α(t − 1))D+(t − 1)
D−(0) = 0 D−(t) = −α(t − 1)min((P(t) − P(t − 1))/P(t − 1)) , 0)+ (1 − α(t − 1))D−(t − 1)
The AMA is computed by
AMA(0) = P(0) AMA(t) = α(t − 1)P(t) + (1 − α(t − 1))AMA(t − 1)
And the channels
H(t) = (1 + βH(t − 1))AMA(t) L(t) = (1 − βL(t − 1))AMA(t)
For a scale constant β, the upper and lower channels are defined to be
βH(t) = β D− βL(t) = β D+
The signal-to-noise ratio calculations are state dependent:
SNR(t) = ((P(t) − AMA(t − 1))/AMA(t − 1)) / β D−(t) IfP(t) > H(t)
SNR(t) = −((P(t) − AMA(t − 1))/AMA(t − 1)) / β D−(t) IfP(t) < L(t)
SNR(t) = 0 otherwise.
Finally the overall sensitivity α(t) is determined via the following func-
tion of SNR(t):
α(t) = αmin + (αmax − αmin) ∗ Arctan(γ SNR(t))
Note: I added a moving average to α(t) that could add some lag. You can optimize the indicator by eventually removing it from the computation.
