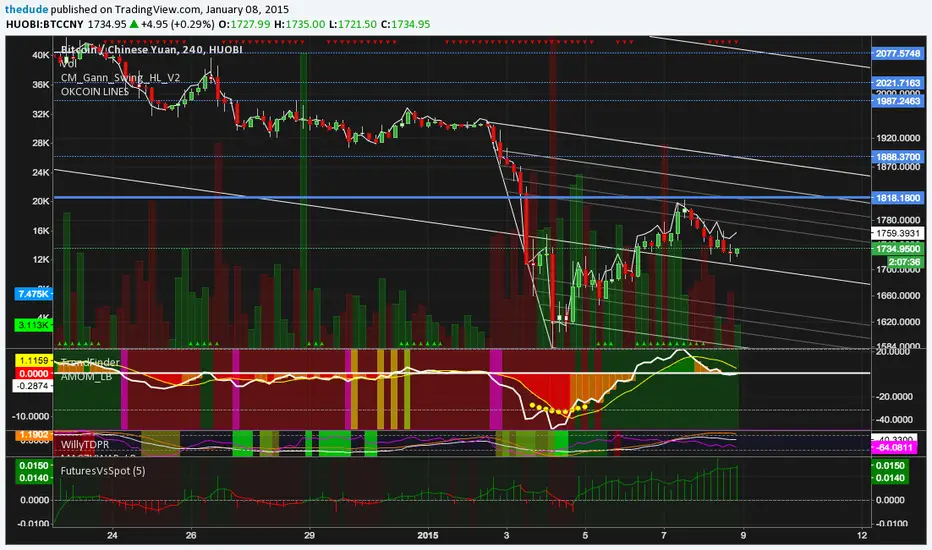
NSE BankNifty Spot Volume - by GrowMore IndicatorsNSE BankNifty Spot Volume - by GrowMore Indicators !!
HOW Does it work ?
Trading volume is a measure of how much of a given financial asset has traded in a period of time. For stocks, volume is measured in the number of shares traded and, for futures and options, it is based on how many contracts have changed hands. The numbers, and other indicators that use volume data, are often provided with online charts.
The Spot Volume of NSE Bank-Nifty is hard to calculate, but TradingView Pine made it easier to calculate the actual spot volume of Bank-Nifty.
As Bank-Nifty users are aware that the Bank-Nifty comprises of 12 banks and each bank has its own weightage in Bank-Nifty movement.
The Indicator has 12 inputs of banks that are in NSE Bank-Nifty and next beside there is weightage input for that particular bank,
now this weightage is modified by NSE every month so it should be changed every month. The link to it is - www1.nseindia.com
User must update the weightage given by NSE into indicator to use it flawlessly.
Disclaimer : Here the volumes are average of volume - of all Bank-Nifty banks.
User Options : Option to input security name and weightage nearby.
also have SMA of volume of user defined length.
Visual Checks - The user could manually validate the back test results on various assets they would like to use this strategy on before putting it live.
How to get access
Please click on the link / email available in the signature or send me a private message to get access.
Feedback
Please click on the link/email in the signature or send me a private message for suggestions/feedbacks.
Spot

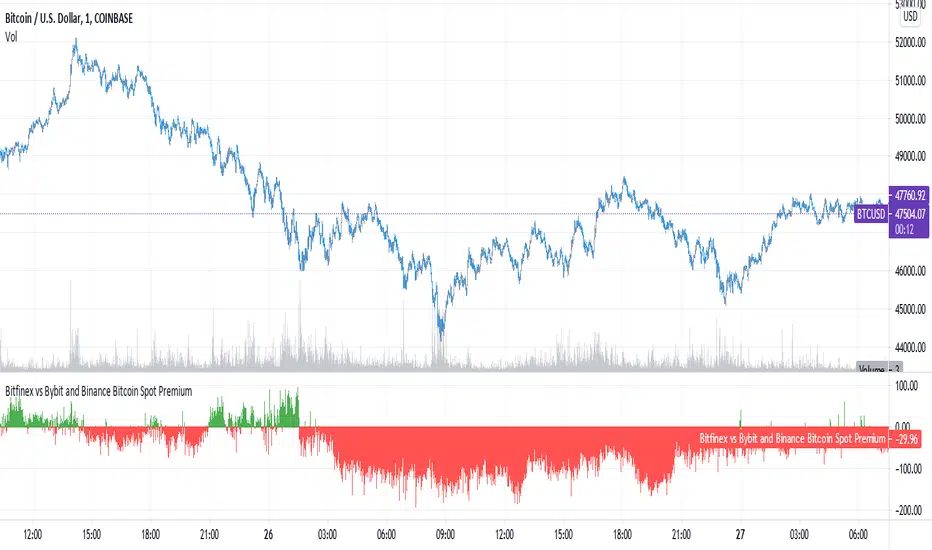
Bitfinex Spot PremiumOverview
A tool to display the spot price premium of Bitfinex coins vs the other big 3 exchanges.
Premium is calculated against:
- Coinbase
- Binance
- FTX
The average is calculated through volume weighting. The absolute difference between the Bitfinex spot price and the calculated average is then displayed on the histogram.
Interacting with the tool
Colours: Green bars indicate a positive premium (Bitfinex spot price is greater than the average), Red bars indicate a negative premium. The ability to grey out smaller premiums is also enabled with the "Grey Small Vals" checkbox, this can be used to further emphasise larger premiums.
Ticker: The ticker input allows you to detect the Bitfinex premium for any coin traded within all 4 exchanges (Bitfinex, Coinbase, Binance, FTX). Just input the coins ticker symbol, for example, "BTC", "ETH", "UNI".
Indicator Ideology
Bitfinex is known for being the home of crypto "smart money". Therefore, positive premiums indicate stronger buying from "smart money". Although this premium is a good sign of bullish/ bearish market conditions, for example, consecutive days of a negative Bitfinex premium have been pretty good at indicating short term tops in BTC, this indicator should only be used as a confirmation signal.

BitcoinNinjas NINJASIGNALS V4 (Script)BitcoinNinjas NINJASIGNALS V4 (Script)
(for Cryptocurrencies, Forex, GunBot, ProfitTrailer, Autoview, CryptoHopper, manual or automated trading, and more)
This is version 4 of our Ninja Signals trading script, with accompanying backtesting strategy.
BitcoinNinjas NINJASIGNALS V4 (Strategy)
•Allows users to easily set automated buy/long and sell/short alerts on TradingView for use with automatic and manual trading of cryptocurrencies, Forex securities, and more (alerts are compatible with automatic trading software such as GunBot, ProfitTrailer, Autoview, CryptoHopper, and more).
•Synthesizes many powerful indicators [e.g., Relative Strength Index (RSI), Stochastic RSI, Money Flow Index (MFI), Moving Average Convergence Divergence (MACD), etc.) into one powerful script to generate very precise buy and sell signals in virtually all market conditions.
•Features user-defined adjustable calibration settings, allowing traders to customize the script to fit any currency / security on any exchange available through TradingView.com, simply by adjusting settings.
•Buy/Long arrows, Sell/Short arrows, & EMA trendline can be customized or hidden, if desired.
•Complete with backtesting strategy version of script which allows users to test various trading strategies based on the alerts the script generates (see information and screenshots below).
•Backtesting strategy features a user-defined adjustable date range, so traders can estimate performance of the script over specific periods of time, such as the last week, month, or year.
•Script and backtesting strategy feature many user-adjustable settings including stop loss and take profit alerts, an ‘only sell for profit’ option (Gunbot-specific), many different buy and sell filters, and more. Simply adjust the script settings and the backtesting results will automatically refresh.
•Backtesting strategy allows for pyramid buying to test various average down / dollar cost average trading strategies. Simply adjust the number of pyramid buys and the quantity of each buy.
•Fully compatible with margin and futures trading for any currency / security on TradingView.com.
DISCLAIMER: By using our BitcoinNinjas ‘Ninja Signals’ planning script, you agree to the BitcoinNinjas 'Terms of Use'. No sharing, copying, reselling, modifying, or any other forms of use are authorized for our documents, script / strategy, and the information published with them. This informational planning script / strategy is strictly for individual use and educational purposes only. This is not financial or investment advice. Investments are always made at your own risk and are based on your personal judgement. BitcoinNinjas is not responsible for any losses you may incur. Please invest wisely.


Bitfinex Bitcoin Spot Premium [@RSEMSONITE]Spot premium difference between Bitfinex and (Binance and Coinbase).
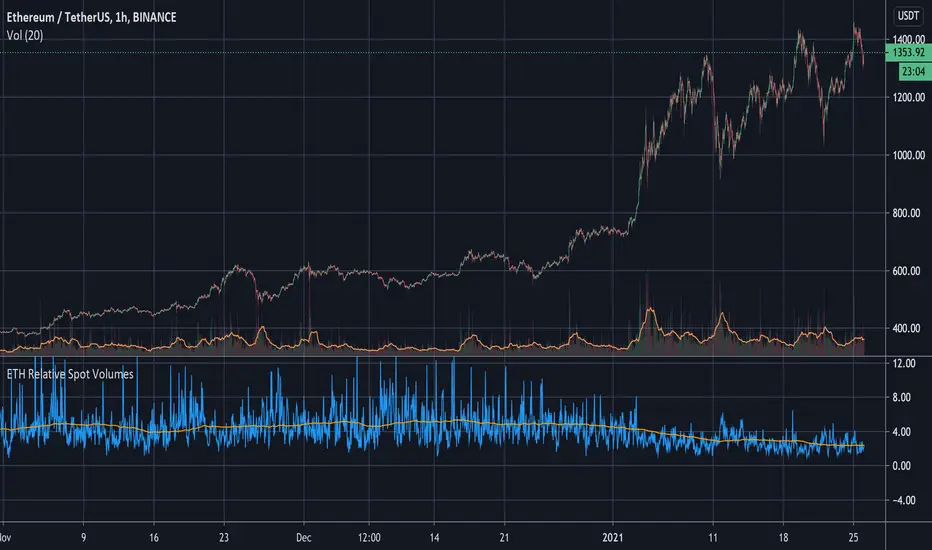
ETH Relative Spot VolumesCompares ETHUSD spot market volumes to ETHUSD perpetual swap volumes.
A higher ratio indicates higher spot buying interest and a more sustained growth overall.
Rallies-driven by spot are deemed more resilient to being affected by high funding rates on futures markets. The long-term trend seems to be increased derivatives volume on ETHUSD contracts making spikes of spot interest more noticeable.
A 200-period Simple Moving Average is applied to indicate a long-term trend.
Weighted derivatives premium BTCCan be extended with more derivative or spot pairs, see the comments in the code for instructions. Most importantly, the pairs need to be added to the respective arrays in the same order, so that the weights are applied to the correct pairs.

Premium Index Generic TheHuntThis indicator is similar to the standard premium index we made for bitcoin, but this one is for alts.
Just like with the bitcoin premium index, you can compare the spot price of a certain altcoin with the price on a futures exchange. The indicator can be used to spot potential strength or weakness in the market.
You can fill in 1 spot exchange pair and compare it with 2 futures exchange pairs.
For example fill in ETHUSD on coinbase and compare it with the future prices on bitmex and bybit.
We can clearly see that on that dump in the blue area, the premium index showed that spot prices were consistently higher than future prices which told us spot was buying the dip.

Premium Index TheHuntThe indicator is used to see the difference in price between spot and futures prices. If future price is higher than spot in a rally, the rally isn't backed by real buys (spot) but by dumb perp longs which CAN be bearish . If spot price is higher than futures in a rally, the upside is backed by real money (spot) which is bullish.
The indicator allows you to pick a spot pair to compare it with the future exchanges you want. You can select which future exchange pairs to compare with by ticking them in the settings.
As you can see here on the chart during this last rally the index is high in the green which means the rally is backed by futures and spot ain't really following. This could be a sign of exhaustion.

Bitcoin Futures: Premium Discount Backwardation Contango [CR]Bitcoin Futures Premium Discount - Backwardation Contango
Cryptorhythms back at it again with another release for your quarantined pleasure! We've had this one in our back pocket for a few months adding new features and testing it out. Now its time to release it into the wild!
Intro
This indicator is used to capture additional profits by spread trading on futures contracts.
Description
This indicator is for members only and instructions will be given out upon becoming a member. It allows you to select from dozens of perpetual, futures and spot markets to compare, along with providing an info panel of many useful statistics and triggers.
How to get access?
You can get more information on joining by referring to my signature links. Members gain access to an entire suite of proven trading indicators and a supportive community of traders.

Cuban's BTCUSD Spot Buying GuideI have been using a few different spreads to track market sentiment for $BTCUSD over the last 12 months, and has worked out very favourably.
Although it's a low sample size, I feel as the market has become more efficient, these signals have become more accurate. Obviously, alpha decay will slowly arb these out but I thought I would share this rough guide.
There are many ways you can use these buy opportunities. I recommend buying after waiting for the candle to flip white (from green), this will be accompanied by the text, 'SPOT'. However, aggressive entries can be taken by slowly averaging in while the candle colouring is green.
I have left out any take profit strategy, as I will leave this to the user.
Enjoy!

BTC FS Diff / Percentage (XBTH20)Shows price difference by a percentage of future (BITMEX:XBTH20) and spot index (BITMEX:XTB) .

Bitfinex Spot vs Margin Volume - Multi-assetThe Bitfinex Spot vs Margin Volume - Multi-asset indicator was designed to help understanding how volume is composed between Spot and Margin transactions, considering all possible scenarios.
It provides valuable additional insight on how 'smarter money' is behaving in anticipation of possible upcoming moves, and can contribute to current analysis toolkits.
To request access, please send me a direct message.
Main features:
Spot vs. Margin insight for all margin-enabled Bitfinex pairs (dynamically detected from Chart).
Can be used on non-Bitfinex Charts which share same Ticker (eg. BTCUSD on Bitfinex or Bitstamp). Also dynamically detected.
Can be used in a separate pane (default) or added to main chart, as a standard volume indicator.
Shapes' meanings:
Colored bars represent scenario where maximum possible volume is attributed to Spot transactions (and its corresponding effect on Margin, if any).
Histograms (thin bars) represent scenario where maximum possible volume is attributed to Margin transactions (and its corresponding effect on Spot, if any).
When volume information leaves room for ambiguity, there will be a mismatch between maximums and minimums. Truth will be somewhere in the middle.
By default, Spot and Margin volumes are stacked up, as in traditional volume bar style.This can be disabled in Options - in which case Margin volumes are presented below zero line (this can facilitate some readings; see notes).
Standard volume for current chart's pair is presented in light gray, in the background. It helps seeing realtime volume and any surplus volume in relation to Bitfinex's.
Colors:
By default, Spot volume bars are colored in blue, but you can choose to use price closes to define them instead - as in traditional volume indicators.
You can also choose to invert Spot and Margin colors, so that Spot volumes are presented in higher contrast.
Margin volumes are, by default, colored based on whether Longs or Shorts were more relevant.
Direction attribution:
Default ratio threshold to define above-mentioned relevance is 1.1 (10%). (eg.: if Longs were greater than Shorts, Longs' volume must be at least 10% grater than Shorts' for direction of movement to be attributed to Longs). Direction then is defined based on winning side, plus whether openings or closings were dominant.
Threshold be configured from 1.01 to N. If ratio is below threshold, direction is considered neutral (yellow/orange colors).
Based on this assessment, label signals are presented at top area of chart, indicating whether opening(+) or closing(-) Longs or Shorts were the major responsibles for the move.
By default, to avoid much cluttering, labels are presented only for greater-than-average (ema 17) margin volumes. This can also be customized in Options.
Claim transactions:
Claim transactions are margin positions closed with traders' own existing assets being handed in to lenders. Thus, they do not impact order books -- and volume -- when executed.
Still, they are an additional, potentially valuable source of information, and the indicator is able to detect and report them.
Green triangle-like area shapes represent Longs closed with Claim transaction(s). Likewise, similar red shapes represent Shorts closed with Claim transactions.
This topic is explained in greater detail in this Bitfinex article .
Notes:
When using stacked up visualization, values in data window do not correspond to actual margin volumes. To see actual values, change to non-stacked up mode, and ignore negative sign.
The lower the time frame, the more precise it gets.
To request access, please send me a direct message.
For questions and feedbacks, please share them in comments section below.
Thank you, and best of success on your trades.

[astropark] Crypto Swing Trading [alarms]Dear Followers,
today a Swing Trading Strategy , runnable on a bot , which works great from 30m timeframe and above. Best suggested timeframes are 1h and 4h.
If you are a scalper, you will love suggested entries for fast profit. You can run it from 1 minute timeframe if you are used to scalp trading and close each trade whenever you fell happy (a proper trailing stop strategy is suggested anyway).
This indicator can trigger till 5 or 20 buy or sell signals in a row before reverting (it changes greatly depending on timeframe you use), so use a proper money management .
This script will let you set alarms whenever a Buy or a Sell signal is drawn on chart. This way you can set all notifications you may need in order to be alerted on each triggered signal.
The backtesting-strategy version of this script can be found here below or by searching for "Crypto Swing Trading" and then choosing the "strategy" version.
Strategy results are calculated on the timeframe from January 2018 to now, so on about 2 years, using 10000$ as initial capital and working at 3x leverage (very safe leverage!).
This is not the "Holy Grail", so use a proper risk management strategy.
This is a premium indicator , so send me a private message in order to get access to this script.

BTC South Korea_PricesSince BTC prices are diverging, this set of 4 indicators charts volume-weighted prices for different exchanges:
Spot, Tether, Futures and South Korea.
I tried doing EUR & JPY, but the divergence is minimal so its a little pointless.
Here is the 4 links:

BTC Futures_PricesSince BTC prices are diverging, this set of 4 indicators charts volume-weighted prices for different exchanges:
Spot, Tether, Futures and South Korea.
I tried doing EUR & JPY, but the divergence is minimal so its a little pointless.
Here is the 4 links:

BTC Spot_PricesSince BTC prices are diverging, this set of 4 indicators charts volume-weighted prices for different exchanges:
Spot, Tether, Futures and South Korea.
I tried doing EUR & JPY, but the divergence is minimal so its a little pointless.
Here is the 4 links:
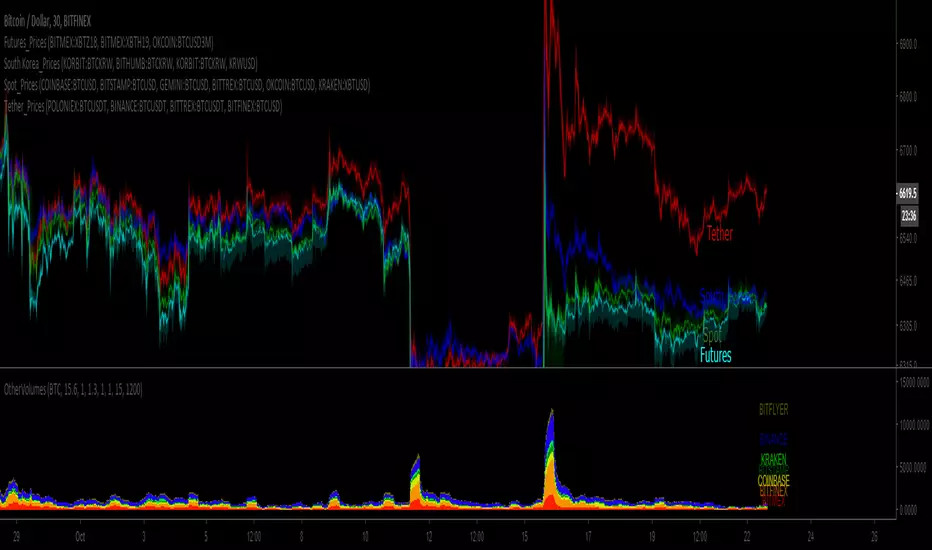
BTC Tether_PricesSince BTC prices are diverging, this set of 4 indicators charts volume-weighted prices for different exchanges:
Spot, Tether, Futures and South Korea.
I tried doing EUR & JPY, but the divergence is minimal so its a little pointless.
Here is the 4 links:

Nadex Fx Volume Indicator Vv1By request
Nadex Fx Volume Indicator Vv1
Original source code & Credit goes to: Pip Foundry - Forex Market Volume from IDC
modified & replaced fx pairs to corrospond with Nadex spot/fx instruments // www.nadex.com

[Bitcoin] Spot price vs Futures indicatorA handy script to detect opportunities in the futures market during extreme movement.
During rallies, futures usually tend to be US$10 above spot price, on the other hand it can be $1 below spot price when the price starts to decline.
You could also draw a trendline to it :) measuring the amount of risk people are willing to take just to predict future prices in the rally/decline.
Credits to lowstrife for the idea, I'm just implementing it :)