R100 Volatility Combo Bands v1 (*v*)The Volatility Combo Bands are made from 4 separate volatility bands- two Bollinger Bands (10 and 20 period) and two Price Headley Acceleration Bands (10 and 20 period). The Volatility Combo Bands plot the innermost upper and lower points from these bands and then plots a mid-line. By default, only the standard 20 period Bollinger Bands and Combo Bands with mid-line are displayed, but can be configured however you want.
Try it out- see squeezes earlier, ride the bands earlier in trending markets, trade pullbacks to the Combo Bands and mid-line, trade the range of the band or use them to help identify potential support and resistance levels. Hopefully they can add another dimension to identifying volatility contraction patterns or whatever you currently use these things for!
I hope you get some value out of it. Only conditions of use are that if you improve it, let me know and if you publish something that uses it, don't hide the code! Enjoy!
Code for the Price Headley Acceleration Bands pinched and modified from LazyBear - thankyou.
Squeeze

Dependent Variable Odd Generator Risk Detector
In fact, I wrote this script for detect Bollinger and Linear Regression Bands squeeze.
It's a side script.
Logic works like this:
Only the stagnant market probability is drawn from the Bollinger bandwidth by Dependent Variable Odd Generator and MFI index is calculated taking into account the volume.
This value ranges from 0 to 100.
To be sure, this value is averaged over a small period.
If you break the average and exceed 50, the bollinger band is too narrow and the risk is too high.
This means more commissions, more transactions, and vain work.
Or, when in position, the warning is not ignored due to unnecessary signals.
This code is open source under the MIT license. If you have any improvements or corrections to suggest, please send me a pull request via the github repository github.com
Stay tuned , best regards.

MS MONEY CCI SQUEEZEAbout
I have used this indicator to find many lucrative opportunities. This indicator takes the moving average of CCI in custom, volatility-specific conditions. CCI measures "overbought" in the red-shaded region and "Oversold" in the green-shaded region. The shaded regions do not constitute a buy/sell signal alone, the MS CCI Squeeze is best used when market conditions agree and is best used when the user has fundamental reasoning for "reversal-like" situations to align. The MS CCI Squeeze will soon have a synergistic partner called "MS RSI Squeeze" indicator that will look similar to help better measure volatility and strength trend.
About the Commodity Channel Index (CCI)
The commodity channel index (CCI) is an oscillator originally introduced by Donald Lambert in 1980. Since its introduction, the indicator has grown in popularity and is now a very common tool for traders in identifying cyclical trends not only in commodities, but also equities (stocks) and currency trading.
How to set an Alert
If the user wants to set an alert , click on one of the support/ resistance lines (black-dashed) near the zero mark. Clicking on the horizontal line above or below the zero line will populate a yellow arrow which will allow you to set alerts when wanted.
Please Read For Better Efficiency
When using this indicator, keep an eye out for harmonic patterns, both bullish and bearish head and shoulders patterns for "HIDDEN" breakout opportunities.
Please like, follow and share and I will continue building better indicators.

Squeeze [LazyBear] w Murat ColorsOriginal by @LazyBear
Differents:
scolor => white & black
plot histogram => linewidth=5
plot style => circles, linewidth => 4, transp => 0

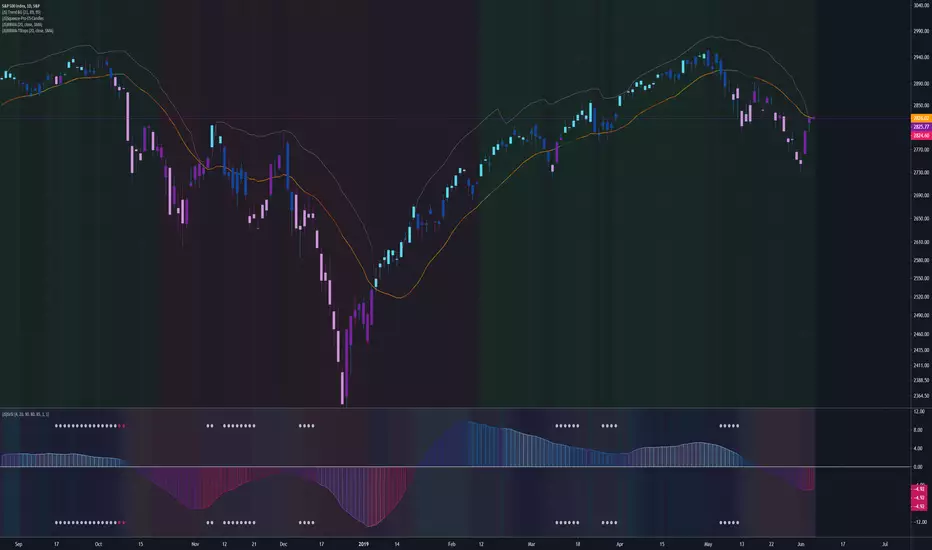
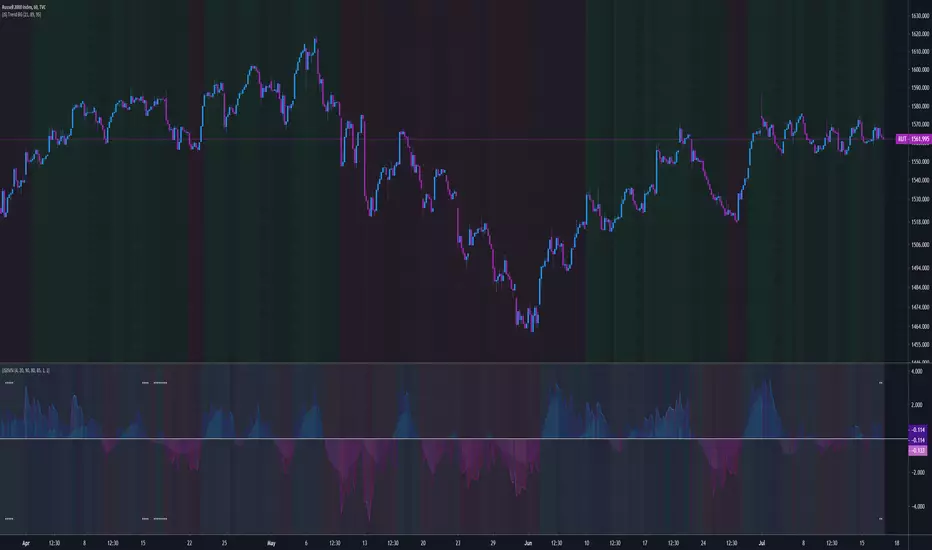
Function : Linear Regression Bands
Used with Pearson Correlation. It can be used to make sense of the trends. Very successful results can be obtained with a MACD style indicator and volume indicator that gives Buy and Sell orders.Open for adaptive and mutable variable periods of moving averages. Best regards!

Nik_Chop_OverlayNASDAQ:AAPL
A tool/ indicator to predict volatility mean reversion zone for both scalper and Trend Traders
Green Zone: Market to possibly remain Sideways / Choppy / Squeeze predicted
Blue Label up : sideways move started (Market to possibly stay in range for next appx. 4 to 8 bars, relative to past 7 to 15 bars)
Red Arrow : Volatility most like to increase (In any direction)
Scalpers : Entry and Exit in Green zone
Trend Traders : Avoid Green zones or be patient in green zone

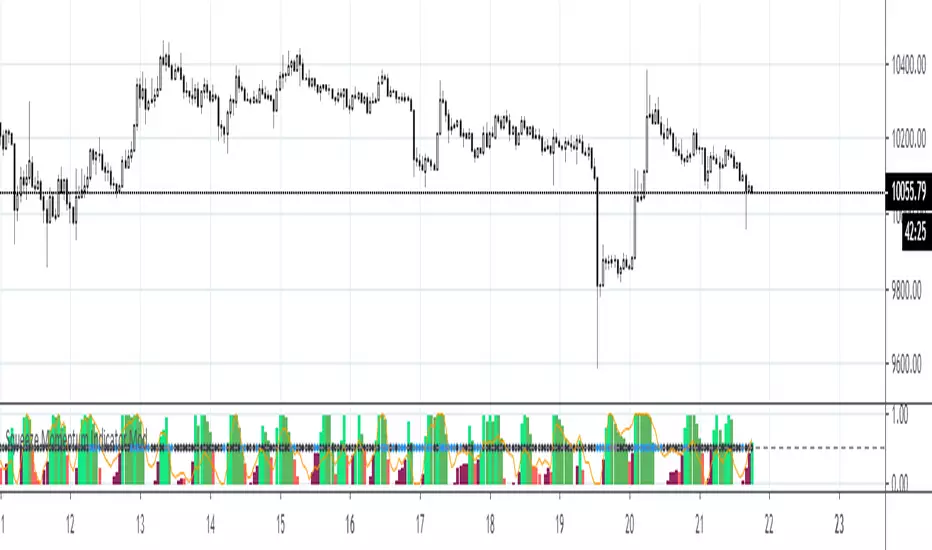
Squeeze Momentum Indicator ModThis is a scaled version of LazyBear's Squeeze Momentum Indicator. Also added are fibo-based periods for BB and KC.
Auto Squeeze Breakout BarsThe Auto Squeeze Breakout Bars find bars that are breaking out of a low volatility environment into a high volatility environment.
The Squeeze shading is signaled when the volatility of the asset is very low. Then the Squeeze Breakout Bars are signaled when the asset is breaking out of this low volatility structure.
Warning bars will be signaled when it is approaching a breakout, but the conditions are not fully met at that very time.
The Auto Squeeze Breakout Bar indicator also has a built in stop loss mechanic that can be set to your preferred limit.
Stop losses are highly recommended when using the breakout bars because of possible head fakes. They are rare, but can occur depending on the asset you are trading.
For Access or Questions: Private message us. Thank you.

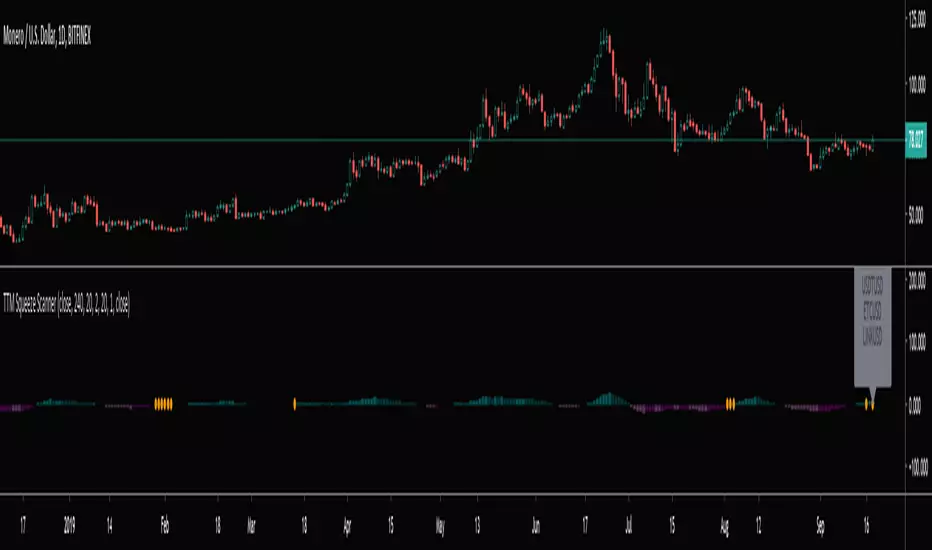
TTM Squeeze Scanner This script scans for TTM Squeezes for the crypto symbols included in the body of the script. The timeframe for the squeeze scan is controlled within the input not the chart.
This script is a merge of @Nico.Muselle's TTM Squeeze script and @QuantNomad's custom screener script. Thanks to both of them!
MACD SqueezeJust saw this on a particular website and created my version of it.
A practical modification of MACD and Squeeze Momentum. The MACD histogram is colored in green or red depending on whether the squeeze momentum is active or not.
Additionally, the MACD line is colored green if the RSI is oversold and red if it's in the overbought levels.

AEONDRIFT-KThis is a special edition of the AEONDRIFT Band that is implemented in my Strategies , which have substantially boosted their profitability.
Squeeze Zone = Increase chance for a big move to happen. I used this to decrease (buy/sell) trading thresholds in my strategy scripts to increase the chances of making a trade.
No Trading Zone = Increase chances for bad trades due to difficulty for indicators to . As the name implies, I used this to disable trading completely during this period.
Alerts are enabled for these states.
~ * ~ * ~ * ~ * ~ * ~ * ~ * ~ * ~ * ~ * ~ * ~ * ~ * ~ * ~ * ~ * ~ * ~ * ~ * ~ * ~
Note:
In no way is this intended as a financial/investment/trading advice. You are responsible for your own investment decisions and trades.
Please exercise your own judgement for your own trades base on your own risk-aversion level and goals as an investor or a trader. The use of OTHER indicators and analysis in conjunction (tailored to your own style of investing/trading) will help improve confidence of your analysis, for you to determine your own trade decisions.
~ * ~ * ~ * ~ * ~ * ~ * ~ * ~ * ~ * ~ * ~ * ~ * ~ * ~ * ~ * ~ * ~ * ~ * ~ * ~ * ~
Please check out my other indicators sets and series, e.g.
LIVIDITIUM (dynamic levels),
AEONDRIFT (multi-levels standard deviation bands),
FUSIONGAPS (MA based oscillators),
MAJESTIC (Momentum/Acceleration/Jerk Oscillators),
PRISM (pSAR based oscillator, with RSI/StochRSI as well as Momentum/Acceleration/Jerk indicators),
PDF (parabolic SAR /w HighLow Trends Indicator/Bar-color-marking + Dynamic Fib Retrace and Extension Level)
and more to come.
Constructive feedback and suggestions are welcome.
~ JuniAiko
(=^~^=)v~
AEONDRIFT
Strategy Scripts:
Cyber Momentum Strategy
Cyber Ensemble Strategy
See Also: Relative Candle Volatility & Directionality Index (RCVI and RCDI)

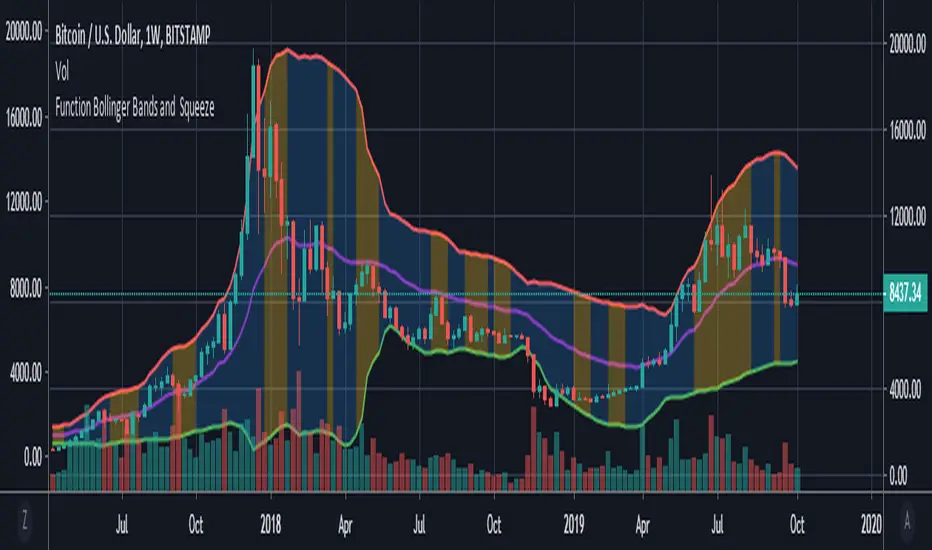
Function : Bollinger Bands and BBW Squeeze DetectorThis script shows Bollinger Bands function and want to detect Bollinger Band Width Squeeze with a successful, different perspective .
Bollinger Bands : You can specify the Bollinger Bands periods as mutable variables .
Bollinger Band Width Squeeze : First the Bollinger bands width was calculated.The width was then divided into levels using the money flow index.
Thus, the bollinger takes into account the available volume averages when calculating the band width mfi (Money Flow Index).
After this modelling, we can limit and color the lower limit and upper limits just as Relative Strength Index.
We can even put warnings on oversold areas if desired. Let's not forget that we are working with width rather than price.
By design, squeeze areas are defined directly above the Bollinger Bands with coloration. I think it is very practical and looks stylish.
I tried and found it quite successful and wanted to share it with users.
I came up with many ideas when I wrote this system, and I will share them very soon . I hope it will be useful to users and give new ideas.
Best regards.
KLM SqueezeThis version corrects a big error that other published versions include.
The John F. Carter setup for the Squeeze mixes 3 major indicators:
- Bollinger bands
- Keltner channel
- Momentum (oscilator)
All these 3 indicators combined create a great way of measuring your entries on a trade and can be used on all timeframes.
Several other versions published on trading view, use incorrect parameters for some of their indicators, which leads to wrong setups.
Based on John F. Carter's book, "Mastering the trade" , I put up this with the correct and original indicator values.
Use it wisely and check John's book for better mastering the trades :)

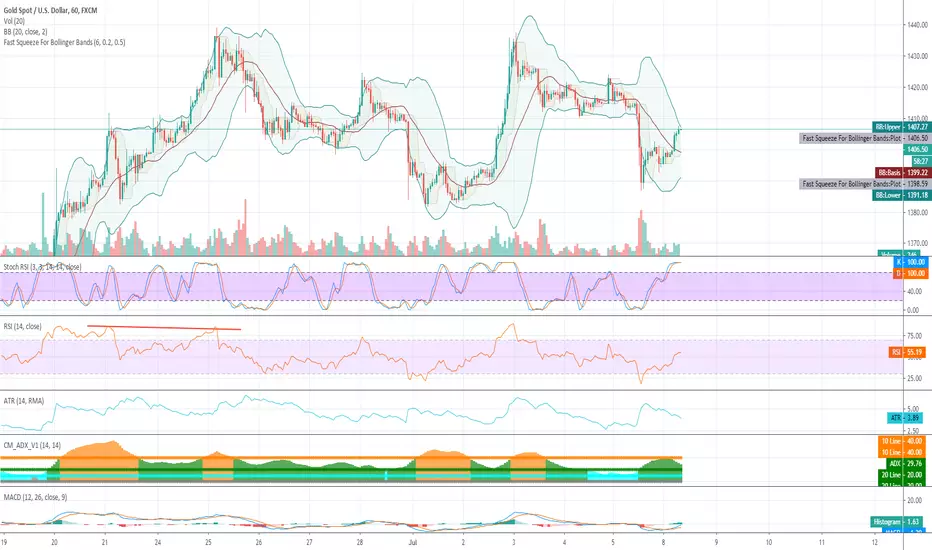
Fast Squeeze For Bollinger BandsUse with bollinger bands, it highlights more recent price range.
Wen price action tightens it will change color from green to orange and then red.
This indicator uses a low timeframe and shows the upcoming mini-squeezes much faster and visually fits into bbands.
Adaptive BB Triple Layer Adaptive BB SD
Band based pullback and pivoting signals ♘♝
Macro Trend sentiment - Outer deviations coloring
Micro trend - Mean Value and normal +/- st.dev colors
Candle Colors - Median Trend
Col Coded Primitive(Basic) Squeeze detection
Sensitive micro break out/down signals derived from basic Mean line crossing (Added some Whipsaw Protection)
Basic Squeeze
Extreme deviations can be turned off for "compact" view
Basic break out/down signals
Indicator needs TESTING
Signal sensitivity and trend recognition need testing/tuning before even considering to use this BB for trading purposes


(JS) Bollinger Band Momentum Average Trailing StopsA tool I made to use alongside the Bollinger Band Momentum Average - fairly simple to use. It has the same settings as the BBMA so you can match them together.
If you prefer a wider stop than a close on the opposing side of the BBMA, this is for you.
The "stop" is triggered by a close on the other side of the stop line line turns red whenever the stop is triggered.
The calculation is simple:
The stop on the short side it is High - BBMA over the length of time you select to use (20 is default).
On the long side, it is BBMA - Low also over the preferred length of time you select to use.
Note: Just shorten the length to make a tighter stop.
(JS) Bollinger Bands Momentum AverageSo this is something I've been using with my Squeeze system that I have found very useful (great addition especially if you use the Squeeze Arrows).
First thing I'd like to point out is that the default setting (20 SMA) is also the default for the Bollinger Bands basis line, so I recommend using the line set at the default.
First thing you'll notice is that whichever side of the line the candles close on, that basically determines the direction of the arrow for the Squeeze Arrows.
So this is extremely helpful in case momentum shifts after an arrow signal is given, if you see the price shoot to the other side of the line you can use that as a means of protection.
Second, the line is color coded in a way that I hope helps with entries and exits.
The colors of the line change based on two things:
1. If there is currently a squeeze.
2. Are the Bollinger Bands expanding or contracting.
Generally speaking, when the bands are contracting (light green and light orange default colors) this is the ideal time for entry before a trending move occurs.
Same thing on the flip side when they're expanding (dark green and dark orange default colors), that's usually the better time to exit.
Now what's the difference between orange and green?
Green = There's an ongoing squeeze
Orange = There's currently no squeeze
So playing the side of momentum when the line is light green and starts to break in a certain direction would be the ideal entry.
And, if momentum changes from that point, you can always use a close on the opposite side of the line as a stop (or an entry the other way).
This is something else I've been using on my own for a little while prior to publishing and it has been a tremendous tool for me. Hope it helps you all as much as it has me!

(JS) Sustained Velocity Squeeze IndexSo I have revamped my original SVI indicator with the new Squeeze Pro system and have fused them together to form a single and extremely versatile indicator.
First, allow me to share the description on the original SVI, as all of this still applies:
" The Sustained Velocity Index is an original indicator I've created as a means to accurately measure parabolic moves to the up or down side.
Acceleration
I have added Acceleration to the equation which you can turn on and off.
This is meant to amplify the value when the move is sustained in a given direction.
What this does is amplify the reading based on consecutive green or red candles.
You can also change the Acceleration sensitivity with 5 being the strongest and 1 being the weakest.
Length
This is rather obvious - the look back period for the math formula.
However - I did include presets that I thought best suited Daily/Weekly/Monthly which you can toggle on and off
The rest of the options are purely cosmetic;
Backgroud Off - Turn the indicator background colors on and off.
Simple Background? - This toggles a simple two shade background on and off.
Background Transparency - Allows you to adjust the transparency of the background colors.
Plot Background Off? - Allows you to toggle the background inside the plot on and off.
Plot Line Color Off? - If you don't like the way the plot line changes colors, this turns it white.
Color Scheme - Four schemes to choose from, first three are color based, the last one is a plain version.
Plot Width - Adjusts the width of the plot line on the indicator.
Plot Line Value? - Toggles a line on the indicator at the current value on and off. "
Regarding the Squeeze Pro:
" The new Squeeze Pro has three different squeeze types rather than a single signal.
White = Warning/Low Squeeze
Red = Regular/Mid Squeeze
Yellow = Power/High Squeeze "
So what does this new indicator do? well - it does everything above, for one. Also, it allows you to use these indicators (Squeeze and SVI) separately in more ways than one, or if you choose so, individually. The default layout is the SVI overlayed on top of the Squeeze Momentum which can be seen in the background allowing you to be aware of both simultaneously, and done in a way that doesn't feel cluttered.
So here''s the new features:
Squeeze Momentum Off - This is rather obvious, when selected this will only show the SVI, no squeeze overlay.
Squeeze Momentum Only - Obvious again, when this is on SVI is removed and only the Squeeze momentum appears on the indicator.
Squeeze Momentum Plot Transparency - This toggles the opacity of the Squeeze momentum when it is overlayed with SVI, so you can bring it out/fade it back more depending on your preference.
Combined Indicator - This is the really cool feature. I combined the math formulas of both the Squeeze and SVI to create a single momentum indicator, the combo indicator tends to lag the other two a bit, but is better at assessing the longer term trend.
There are 5 different color schemes as well, with the fifth being a plain grayscale bg if you aren't into all the extra stuff.
Lots of moving parts to this script! I have been using this thing now for about a week or so prior to publishing and I love it so far, hope you all do too - enjoy!
Ultimate Volatility OscillatorThis is a Premium Volatility indicator which aims to set a framework for Advanced Volatility Studies.
The indicator allows plotting multiple Volatility Studies, including:
Squeeze
Bollinger Bands Volatility
Volatility Index
TTM Squeeze
It enables 3 distinct view modes out of the box:
Oscillator Mode
Histogram Mode
Oscillator + Histogram Mode
And includes the Volatility Belt, which is super-useful to spot volatility changes in a compact mode.
Additional volatility studies might be included down the road.
If you're interested in this one, please PM me.

(JS) Squeeze Pro ArrowsMore Squeeze Pro continuation, this is the signals on the chart. Initial signals appear as small label up and label down icons, while if the squeeze continues to a certain interval a bigger icon will appear later in the same squeeze duration - they are all color coded to match the squeeze signals from the Squeeze Pro indicator

(JS) Squeeze Pro Early Signal CandlesThe next piece of the Squeeze Pro System - early signal candles.. These are supposed to hint at squeeze momentum before it happens - another piece of the new Squeeze Pro trading system
