ALMA/EMA/SRSI Strategy + IndicatorBack with another great high hit rate strategy!!
Disclaimer* This strategy was sampled using source code written by @ClassicScott , as referred to in the script, there is a clear line where the source code was scripted by myself.
This Strategy consists of three key factors, the ALMA, EMA crossover, and a Stochastic Rsi
ALMA: The Alma is the step line shown, turning green and red at select times. This average value gives general oversight of the macro movement of price action. and this particular one was coded by Mr.ClassicScott.
EMA crossover: At the input screen you are given an option of the fast and slow ema's. The default is solely for the hit rate and correlation to the Alma of this strategy. The arrows you see depicted on the chart are the crossover events happening.
Stochastic Rsi: The Stochastic Rsi is a stochastic value, using data sampled from the rsi. The use of this indicator in my strategy is to prevent entries when too overbought and oversold, as well as closures and vice versa, to prevent holding bags either way.
Fixed % TP: In the input screen you are given a take profit and stop loss percentage, for good R/R the hit rate will take a notch down, but with no R/R it will be near perfect.
How to use this:
Add it to your chart to get the strategy inputs. (The strategy is really only useful on a 15min TF. However the indicator within it can be used on anything at anytime!)
Watch the yellow and aqua moving averages, these are your ema's and crossover's will trigger signals based on your integer inputs.
Find Correlation between other leading indicators, as well as crossover's down/up and a red/green alma.
DO NOT use the arrows as buy/sell signals. These are simply to show ema's are crossing under or over. Momentum indicator's paired with this can be useful to determine if it could be a buy signal or sell signal.
Cheat Code's Notes:
Almost at 1000 boosts!!! I appreciate the support from everyone and I will keep trying my best to deliver quality strategies for the people.
-Cheat Code
BYBIT:BTCUSDT
Stochrsi-overbought

MTF Stochastic ScannerThis Stochastic scanner can be use to identify overbought and oversold of 10 symbols over multiple timeframes
it will give you a quick overview which pair is more overbough or more oversold and also signals tops and bottoms in the AVG row
light red/green cell = weak bearish (Stoch = 30-20) / bullish (Stoch = 70-80)
medium red/green cell = bearish (Stoch = 20-10) / bullish (Stoch = 80-90)
dark red/green cell = strong bearish (Stoch <= 10) / bullish (Stoch >= 90)
gray cell = neutral (Stoch = 30-70)
Usage
If AVG (average of all 4 timeframes) falls below 20, the cell will get green, indicating a good time to enter long (buy)
If AVG (average of all 4 timeframes) rises above 80, the cell will get red, indicating a good time to enter short (sell)
Use the "MTF Stochastic Scanner" in combination with the " MTF RSI Scanner "
to find tops (RSI MTF avg >=70 AND Stochastic MTF avg >= 80)
or bottoms (RSI MTF avg <= 30 AND Stochastic MTF avg <= 20)
Here is how the two MTF scanners looked on Nov 08 2021 (ATH) »
and here how the MTF scanners looked on June 21 2022
use TradingViews Replay function to check how it would have worked in the past and when not.
As always… there NOT a single indicator that can show to the top & bottom 100% every single time. So use with caution, with other indicators and/or deeper understanding of technicals analysis ☝️☝️☝️
Settings
You can change the timeframes, symbols, Stochastic settings, overbought/oversold levels and colors to your liking
Drag the table onto the price chart, if you want to use it as an overlay.
NOTE:
Because of the 4x10 security requests, it can take up to 1 minute for changed settings to take effect! Please be patient 🙃
If you have any idea on how to optimise the code, please feel free to share 🙏
*** Inspired by "Binance CHOP Dashboard" from @Cazimiro and "RSI MTF Table" from @mobester16 ***

REDWOOD MTF Stochastic RSI
This MTF Stochastic RSI is custom made to help give you an edge while trading.
As you see the MTF Stochastic RSI is colored depending on the trend and if "K" is above or below "D".
This indicator shows the crossover or crossunder of these values with the colored circles that
are plotted. This can be a very useful indicator to show you Oversold or Overbought areas of an
asset, giving you ideas of when to take profit or enter a new trade.
For more information on Stochastic RSI in general (for reference) Please see the detailed
description here : www.investopedia.com(StochRSI)%20is,than%20to%20standard%20price%20data.
This Stochastic RSI is a Multi Time frame Stochastic, meaning it can show you higher or lower
timeframes of the Stochastic RSI no matter what current time frame your chart is on. This is
applied in the settings of the indicator by default, with a default timeframe of 1hr.
You can easily change back to the current time frame by checking the box "Use current Timeframe?".
This can be very useful to get into a trend early, entering or exiting on low time frame bars while
seeing the live Long time frame Stoch RSI.
All inputs of K, D, RSIlength, Stochlength, Overbought and Oversold areas can be customized to
your liking. By default these run on the recommended Stoch RSI settings and values on tradingview
with overbought and oversold areas at 80 & 20.
There are inputs that will color the bars depending on if the Stoch is showing Overbought(red) or
Oversold(lime) regions, and a separate color setting that colors bars with the color of the Stoch
itself, showing when K is over D and vise versa.
For trading with this indicator, it works very well with a indicator confirming the position or
potential change that is happening, I recommend the MacD. Specifically, the REDWOOD MTF MacD.
When K crosses D and is showing the Stoch green or lime, this is when to take a Long or buy
position.
When D crosses K and is showing the Stoch red, this is when to take a short or sell position.
To filter out false crosses or trades, this is where I recommend the MacD, taking trades on the
Stoch when the MacD is showing signs of a reversal or crosses itself. These provide the strongest
signals and buy and sell positions.
This is recommended as a swing indicator, but can be used for scalping at your own risk.
As for recommended time frames to use for the MTF settings, I would stick to longer timeframes to
show the overall trend. With that being said, it can be used on shorter timeframes as well and
works good. I would sick to the 1hr or 4hr timeframes, and for lower I recommend the 15min or
30min timeframes. The lower you go the more signals will be provided, but with that lots more
false signals will show as well if the asset is volatile.
All settings, colors, and plots can be customized, and all are labeled to make it easy for you.
Alerts for each setting will be added in the future for simplicity, as of now the alerts can be
made as usual, having the indicator plot K crossing the indicator plot D, telling you of a change
in the Stoch.
This can be a very useful indicator, and I'm sure some may find settings that work even better
than the default or recommended settings.
This indicator works on all markets, forex, cryptocurrency, and stocks.
For access to this and all indicators available, please DM me here or See profile. We are here
to help each other succeed! The more one succeeds the more we all succeed! We are all in this
together and every person deserves to be financially independent and confident when taking trades
and investing.

CryptoSignalScanner - Stochastic Trend IndicatorDESCRIPTION:
This script has been designed to provide the ideal buy and sell moment on the lower time frames.
• This scripts is based on the Stochastic RSI Indicator.
• When we are in an uptrend the background becomes green.
• When we are in a downtrend the background becomes red.
• It is also possibility to set the overbought and oversold range.
HOW TO USE:
• When the blue line (stochastic K) has crossed above the red line (stochastic D) in the oversold area then this is the ideal moment to get into a trade.
• When the blue line (stochastic K) has crossed below the red line (stochastic D) in the overbought area then this is the ideal moment to get out of a trade.
• Use this together with the CryptoSignalScanner - Advanced BUY/SELL indicator to get a stronger confirmation.
• Use the Fibonacci tool together with the Eliot Waves to help you to find the ideal buy or sell moment.
HOW TO GET ACCESS TO THE SCRIPT:
• Use the link below to subscribe to our indicators.
REMARKS:
• This advice is NOT financial advice.
• We do not provide personal investment advice and we are not a qualified licensed investment advisor.
• All information found here, including any ideas, opinions, views, predictions, forecasts, commentaries, suggestions, or stock picks, expressed or implied herein, are for informational, entertainment or educational purposes only and should not be construed as personal investment advice.
• We will not and cannot be held liable for any actions you take as a result of anything you read here.
• We only provide this information to help you make a better decision.
• While the information provided is believed to be accurate, it may include errors or inaccuracies.
Good Luck,
The CryptoSignalScanner Team

CryptoSignalScanner - Advanced BUY/SELL indicatorDESCRIPTION:
This script has been designed to do some swing trading on 4 hour and daily candles.
After some adjustments it also gives a good result on the lower timeframes 5m, 15m and 1h.
• This scripts is based on RSI, Stoch RSI and some other indicator(s).
• It provides BUY, SELL, STRONG BUY and STRONG SELL labels when loading the script.
• It is also possibility to set a BUY, STRONG BUY, SELL, STRONG SELL, BUY/SELL or STRONG BUY/STRONG SELL alert.
HOW TO USE:
• When a BUY signal appears it means that the trading pair is oversold. Wait for the reversal to buy. Use the Fibonacci tool together with the Eliot Waves Theory to BUY or SELL or wait for the SELL signal.
• When a SELL signal appears it means that the trading pair is overbought. SELL immediately or use the Fibonacci tool together with the Eliot Waves Theory to SELL.
FEATURES:
• You can show/hide the labels based on RSI, Stoch RSI input values.
• You can show/hide the labels based on Stoch RSI K and R input values.
• You can show/hide the labels based on Stoch RSI K and R crossing.
• You can show only STRONG BUY or STRONG SELL labels.
• Etc...
HOW TO GET ACCESS TO THE SCRIPT:
• Use the link below to subscribe to our indicators.
• Based on this script we provide telegram channels that provides signals for all Binance BTC, ETH, USDT and BNB pairs.
REMARKS:
• This advice is NOT financial advice.
• We do not provide personal investment advice and we are not a qualified licensed investment advisor.
• All information found here, including any ideas, opinions, views, predictions, forecasts, commentaries, suggestions, or stock picks, expressed or implied herein, are for informational, entertainment or educational purposes only and should not be construed as personal investment advice.
• We will not and cannot be held liable for any actions you take as a result of anything you read here.
• We only provide this information to help you make a better decision.
• While the information provided is believed to be accurate, it may include errors or inaccuracies.
Good Luck,
The CryptoSignalScanner Team

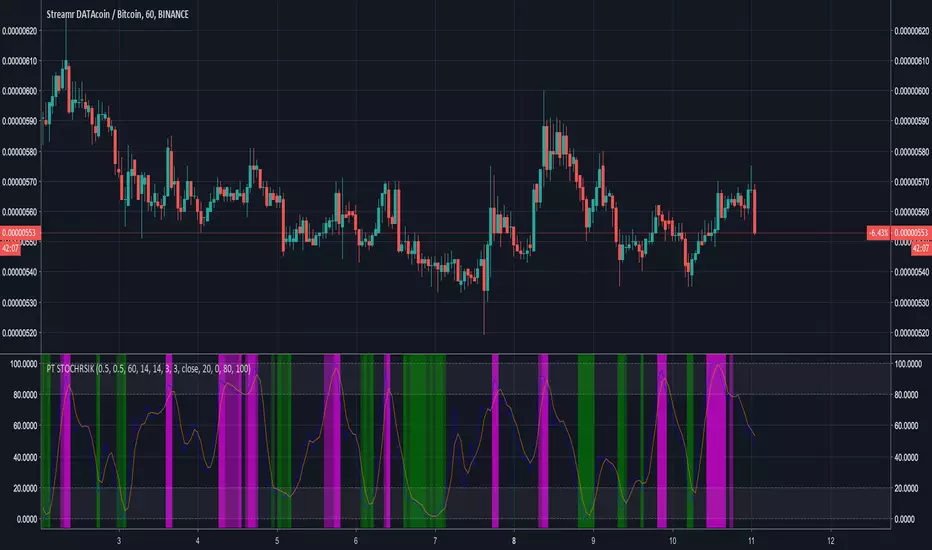
[ProfitTrailer] Stoch RSI K StudyProfitTrailer StochRSI K study for buy/sell strategies.
The script highlights the regions where buy/sell trailing is most likely to succeed.
[ProfitTrailer] Stoch RSI studyProfitTrailer Stoch RSI study with buy/sell strategies.
The script highlights the regions where trailing is most likely to succeed.
