Hash Ratings EngineHash Ratings Engine - Technical Consensus Strategy
A systematic trading strategy that harnesses TradingView's Technical Ratings to generate high-conviction entries with institutional-grade risk management.
What It Does
This strategy aggregates the consensus of 26+ technical indicators (RSI, MACD, Stochastics, multiple Moving Averages, etc.) into a single actionable signal. When enough indicators align bullish or bearish, the engine triggers an entry. Built-in trend filtering and ATR-based exits keep you on the right side of the market.
Key Features
Trend Filter - Only takes longs in uptrends, shorts in downtrends. This single filter typically improves results by 20-40% by avoiding counter-trend trades.
ATR-Based Risk Management - Stop loss and trailing stops adapt to current market volatility. Tight stops in calm markets, wider stops in volatile conditions.
Cooldown System - After a losing trade, the strategy waits before re-entering. This prevents the consecutive loss streaks that destroy accounts.
Clean Visuals - Fluorescent entry/exit signals with price level references. See exactly where you got in and out.
Settings Guide
Indicator Timeframe: Leave blank for current chart. Use higher timeframe for fewer, higher-quality signals.
Rating Source: "All" for balanced approach. "MAs" for trend-following. "Oscillators" for mean-reversion.
Entry Thresholds
Strong Signal Threshold: Higher = fewer trades but better conviction. Start at 0.5, test 0.4-0.6.
Risk Management
ATR Period: 12 is responsive, 14 is standard, 20+ is smoother.
Stop Loss: 2-3x ATR for tight stops, 3.5-4x for moderate, 5x+ for wide.
Trail Activation: How far price must move in profit before trailing begins.
Trail Offset: How closely the trail follows price.
Trend Filter
EMA Length: 150 works well on 4H charts. Use 100 for lower timeframes, 200 for daily.
Trade Timing
Cooldown: Keep enabled. 5 bars is a good starting point.
Best Practices
Start with default settings and backtest on your preferred instrument. Adjust the Strong Signal Threshold first - this has the biggest impact on trade frequency. Then tune the EMA length to match your timeframe. Finally, optimize the ATR multipliers for your risk tolerance.
Works on any liquid market - crypto, forex, stocks, futures. Higher timeframes (4H, Daily) tend to produce cleaner signals than lower timeframes.
Disclaimer
Past performance does not guarantee future results. Always backtest thoroughly and use proper position sizing. This strategy is for educational purposes - trade at your own risk.
Stop-loss

EMA Cross + RSI + ADX - Autotrade Strategy V2Overview
A versatile trend-following strategy combining EMA 9/21 crossovers with RSI momentum filtering and optional ADX trend strength confirmation. Designed for both cryptocurrency and traditional futures/options markets with built-in stop loss management and automated position reversals.
Key Features
Multi-Market Compatibility: Works on both crypto futures (Bitcoin, Ethereum) and traditional markets (NIFTY, Bank NIFTY, S&P 500 futures, equity options)
Triple Confirmation System: EMA crossover + RSI filter + ADX strength (optional)
Automated Risk Management: 2% stop loss with wick-touch detection
Position Auto-Reversal: Opposite signals automatically close and reverse positions
Webhook Ready: Six distinct alert messages for automation (Entry Buy/Sell, Close Long/Short, SL Hit Long/Short)
Performance Metrics
NIFTY Futures (15min): 50%+ win rate with ADX filter OFF
Crypto Markets: Requires extensive backtesting before live deployment
Optimal Timeframes: 15-minute to 1-hour charts (patience required for higher timeframes)
Strategy Logic
Entry Signals:
LONG: EMA 9 crosses above EMA 21 + RSI > 55 + ADX > 20 (if enabled)
SHORT: EMA 9 crosses below EMA 21 + RSI < 45 + ADX > 20 (if enabled)
Exit Signals:
Opposite EMA crossover (auto-closes current position)
Stop loss hit at 2% from entry price (tracks candle wicks)
Technical Indicators:
Fast EMA: 9-period (short-term trend)
Slow EMA: 21-period (primary trend)
RSI: 14-period with 55/45 thresholds (momentum confirmation)
ADX: 14-period with 20 threshold (trend strength filter - optional)
Market-Specific Settings
Traditional Markets (NIFTY, Bank NIFTY, S&P Futures, Options)
Recommended Settings:
ADX Filter: Turn OFF (less choppy, cleaner trends)
Timeframe: 15-minute chart
Win Rate: 50%+ on NIFTY Futures
Why No ADX: Traditional markets have more institutional participation and smoother price action, making ADX unnecessary
Cryptocurrency Markets (BTC, ETH, Altcoins)
Recommended Settings:
ADX Filter: Turn ON (ADX > 20)
Timeframe: 15-minute to 1-hour
Extensive backtesting required before live trading
Why ADX: Crypto markets are highly volatile and prone to false breakouts; ADX filters low-quality chop
Best Practices
✅ Backtest thoroughly on your specific instrument and timeframe
✅ Use larger timeframes (1H, 4H) for higher quality signals and better risk/reward
✅ Adjust RSI thresholds based on market volatility (try 52/48 for more signals, 60/40 for fewer but stronger)
✅ Monitor ADX effectiveness - disable for traditional markets, enable for crypto
✅ Proper position sizing - adjust default_qty_value based on your capital and instrument price
✅ Paper trade first - test for 2-4 weeks before risking real capital
Risk Management
Fixed 2% stop loss per trade (adjustable)
Stop loss tracks candle wicks for accurate execution
Positions auto-reverse on opposite signals (no manual intervention needed)
0.075% commission built into backtest (adjust for your broker)
Customization Options
All parameters are adjustable via inputs:
EMA periods (default: 9/21)
RSI length and thresholds (default: 14-period, 55/45 levels)
ADX length and threshold (default: 14-period, 20 threshold)
Stop loss percentage (default: 2%)
Webhook Automation
This strategy includes six distinct alert messages for automated trading:
"Entry Buy" - Long position opened
"Entry Sell" - Short position opened
"Close Long" - Long position closed on opposite crossover
"Close Short" - Short position closed on opposite crossover
"SL Hit Long" - Long stop loss triggered
"SL Hit Short" - Short stop loss triggered
Compatible with Delta Exchange, Binance Futures, 3Commas, Alertatron, and other webhook platforms.
Important Notes
⚠️ Crypto markets require extensive backtesting - volatility patterns differ significantly from traditional markets
⚠️ Higher timeframes = better results - 15min works but 1H/4H provide cleaner signals
⚠️ ADX toggle is critical - OFF for traditional markets, ON for crypto
⚠️ Not financial advice - always conduct your own research and use proper risk management
⚠️ Past performance ≠ future results - backtest results may not reflect live trading conditions
Disclaimer
This strategy is for educational and informational purposes only. Trading futures and options involves substantial risk of loss. Always backtest thoroughly, start with paper trading, and never risk more than you can afford to lose. The author assumes no responsibility for any trading losses incurred using this strategy.

Fibonacci-Only StrategyFibonacci-Only Strategy
This script is a custom trading strategy designed for traders who leverage Fibonacci retracement levels to identify potential trade entries and exits. The strategy is versatile, allowing users to trade across multiple timeframes, with built-in options for dynamic stop loss, trailing stops, and take profit levels.
Key Features:
Custom Fibonacci Levels:
This strategy calculates three specific Fibonacci retracement levels: 19%, 82.56%, and the reverse 19% level. These levels are used to identify potential areas of support and resistance where price reversals or breaks might occur.
The Fibonacci levels are calculated based on the highest and lowest prices within a 100-bar period, making them dynamic and responsive to recent market conditions.
Dynamic Entry Conditions:
Touch Entry: The script enters long or short positions when the price touches specific Fibonacci levels and confirms the move with a bullish (for long) or bearish (for short) candle.
Break Entry (Optional): If the "Use Break Strategy" option is enabled, the script can also enter positions when the price breaks through Fibonacci levels, providing more aggressive entry opportunities.
Stop Loss Management:
The script offers flexible stop loss settings. Users can choose between a fixed percentage stop loss or an ATR-based stop loss, which adjusts based on market volatility.
The ATR (Average True Range) stop loss is multiplied by a user-defined factor, allowing for tailored risk management based on market conditions.
Trailing Stop Mechanism:
The script includes an optional trailing stop feature, which adjusts the stop loss level as the market moves in favor of the trade. This helps lock in profits while allowing the trade to run if the trend continues.
The trailing stop is calculated as a percentage of the difference between the entry price and the current market price.
Multiple Take Profit Levels:
The strategy calculates seven take profit levels, each at incremental percentages above (for long trades) or below (for short trades) the entry price. This allows for gradual profit-taking as the market moves in the trade's favor.
Each take profit level can be customized in terms of the percentage of the position to be closed, providing precise control over exit strategies.
Strategy Backtesting and Results:
Realistic Backtesting:
The script has been backtested with realistic account sizes, commission rates, and slippage settings to ensure that the results are applicable to actual trading scenarios.
The backtesting covers various timeframes and markets to ensure the strategy's robustness across different trading environments.
Default Settings:
The script is published with default settings that have been optimized for general use. These settings include a 15-minute timeframe, a 1.0% stop loss, a 2.0 ATR multiplier for stop loss, and a 1.5% trailing stop.
Users can adjust these settings to better fit their specific trading style or the market they are trading.
How It Works:
Long Entry Conditions:
The strategy enters a long position when the price touches the 19% Fibonacci level (from high to low) or the reverse 19% level (from low to high) and confirms the move with a bullish candle.
If the "Use Break Strategy" option is enabled, the script will also enter a long position when the price breaks below the 19% Fibonacci level and then moves back up, confirming the break with a bullish candle.
Short Entry Conditions:
The strategy enters a short position when the price touches the 82.56% Fibonacci level and confirms the move with a bearish candle.
If the "Use Break Strategy" option is enabled, the script will also enter a short position when the price breaks above the 82.56% Fibonacci level and then moves back down, confirming the break with a bearish candle.
Stop Loss and Take Profit Logic:
The stop loss for each trade is calculated based on the selected method (fixed percentage or ATR-based). The strategy then manages the trade by either trailing the stop or taking profit at predefined levels.
The take profit levels are set at increments of 0.5% above or below the entry price, depending on whether the position is long or short. The script gradually exits the trade as these levels are hit, securing profits while minimizing risk.
Usage:
For Fibonacci Traders:
This script is ideal for traders who rely on Fibonacci retracement levels to find potential trade entries and exits. The script automates the process, allowing traders to focus on market analysis and decision-making.
For Trend and Swing Traders:
The strategy's flexibility in handling both touch and break entries makes it suitable for trend-following and swing trading strategies. The multiple take profit levels allow traders to capture profits in trending markets while managing risk.
Important Notes:
Originality: This script uniquely combines Fibonacci retracement levels with dynamic stop loss management and multiple take profit levels. It is not just a combination of existing indicators but a thoughtful integration designed to enhance trading performance.
Disclaimer: Trading involves risk, and it is crucial to test this script in a demo account or through backtesting before applying it to live trading. Users should ensure that the settings align with their individual risk tolerance and trading strategy.

Dynamic Stop Loss DemoWhat does this script do ?
This script is for pine script programmers and explains how to implement a dynamic stop-loss strategy. It is different from trailing stop-loss. Trailing stop-loss can only set the retracement value, but this script can take profit on part of the position at a fixed price and allows users to decide whether to take profit on all positions based on whether a certain track is breached or other conditions author want. In this demo, it use rsi crossover and crossunder to decide the strategy condition, and use close price as open price, and use lowest low / highest high as stop price, and use 1.5 risk ratio to calculate the fixed first profit price. It will take 50% position size when the first profit price was reached. Then it will close all rest positions when the inverse condition come out or the dynamic stop(calculated by ATR) breached or when the price back to the open price or the stop price.
How is this script implemented
When start strategy by strategy.entry , it gives a custom id which contains direction, openPrice, stopPrice, profitPrice, qty, etc. It can be get from the global variable strategy.posiition_entry_name .

Moving Stop-Loss mechanism + alerts to MT4/MT5"How to code moving stop-loss mechanism", is one of the most often repeating questions in private messages I receive, so just to focus on this mechanism, I made a spin-off from my previous script: TradingView-Alerts-to-MT4-MT5-dynamic-variables-NON-REPAINTING .
The logic here moves the stop-loss each time a trade is running and a new pivot high/low is detected. When such event occurs (UpdateLongStopLoss or UpdateShortStopLoss), stoploss_long or stoploss_short mutable variable is modified. And it needs to be coded inside strategy.exit() line as "stop=stoploss_long" or "stop=stoploss_short". Entries are pretty straightforward - on Stoch crosses.
Last lines of the script show how to wrap information about such updates and send send alerts to MetaTrader via TradingConnector for execution in Forex/indices/commodities/crypto markets via MetaTrader. Please note that "tradeid=" variable must be passed with each alert, to let MetaTrader know which trade to modify. SLMOD, TPMOD are recently added commands, along with BE (as in "move stop-loss to breakeven" - but that's another topic).
Please disregard strategy backtest results, as this script is for coding education purposes only. However, it seems with the stop-loss mechanism enabled, the results are even better, than in original version of the script :)

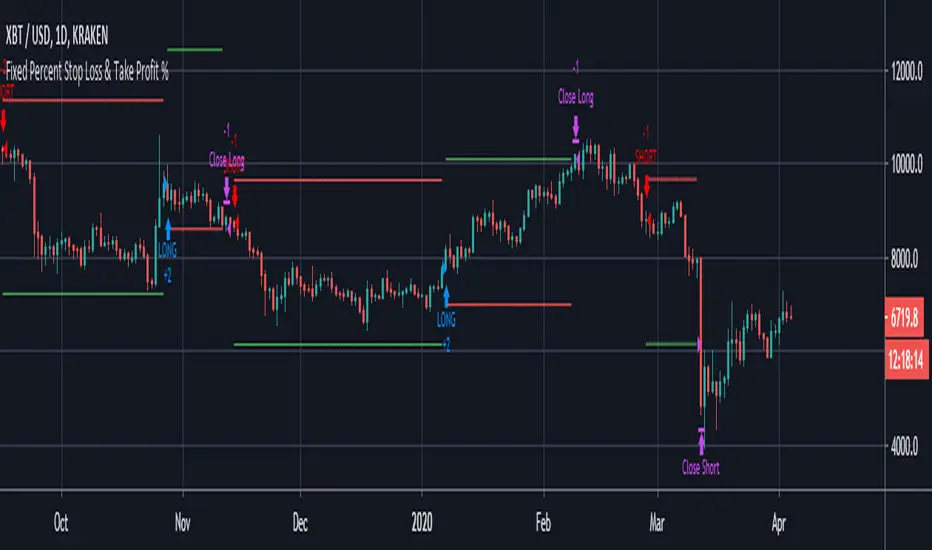
Fixed Percent Stop Loss & Take Profit %===========
Fixed Percent Stop Loss & Take Profit %
===========
A neat example of how to set up Fixed Stops and Take Profit as a percent of the entry price.
Yup, that's about it!
You can ignore the actual entry/exit orders - they're based on a simple MA cross and are therefore NOT relevant, NOT really profitable and NOT recommended!
You should be using this code as a way of adding Stops and Takes to your own scripts - hope it helps!
-----------
Good Luck and Happy Trading!
Scripting Tutorial A - TManyMA - StopsThis script is for a triple moving average strategy where the user can select from different types of moving averages, price sources, lookback periods and resolutions.
Features:
- 3 Moving Averages with variable MA types, periods, price sources, resolutions and the ability to disable each individually.
- Crossovers are plotted on the chart with detailed information regarding the crossover (Ex: 50 SMA crossed over 200 SMA )
- Forecasting available for all three MAs. MA values are forecasted 5 values out and plotted as if a continuation to the MA.
- Forecast bias also applies to all forecasting. Bias means we can forecast based on an anticipated bullish, bearish or neutral direction in the market.
- To understand bias, please read the source code, or if you can't read the code just send me a message on here or Twitter. Twitter should be linked to my profile.
- Ribbons added and on by default. Optional setting to disable the ribbons. 5 ribbons between MA1 and MA2 and another 5 between MA2 and MA3.
- Ribbons are alpha-color coded based on their relation to their default MAs.
- Ribbons are only visible between MAs if the MAs being compared share the same Type, Resolution, and Source because there is no way to consolidate those three in a simple manner.
- Ribbon values are calculated based on calculated MA Periods between the MAs.
- Converted the existing study into a strategy.
- Strategy only enters long positions with a market order when MA crossovers occur.
- Strategy exits positions when crossunders occur.
- Trades 100% of the equity with one order/position by default.
- Ability to disable trading certain crosses with input checks.
- Ability to exit trades with a take profit or stop loss.
- User input to allow quick changes to the take profit or stop loss percentages.
This script is meant as an educational script with well-formatted styling, and references for specific functions.
*** PLEASE NOTE - THIS STRATEGY IS MEANT FOR LEARNING PURPOSES. DEPENDING ON IT'S CONFIGURATION IT MAY OR MAY NOT BE USEFUL FOR ACTUAL TRADING. THE STRATEGY IS NOT FINANCIAL ADVICE ***

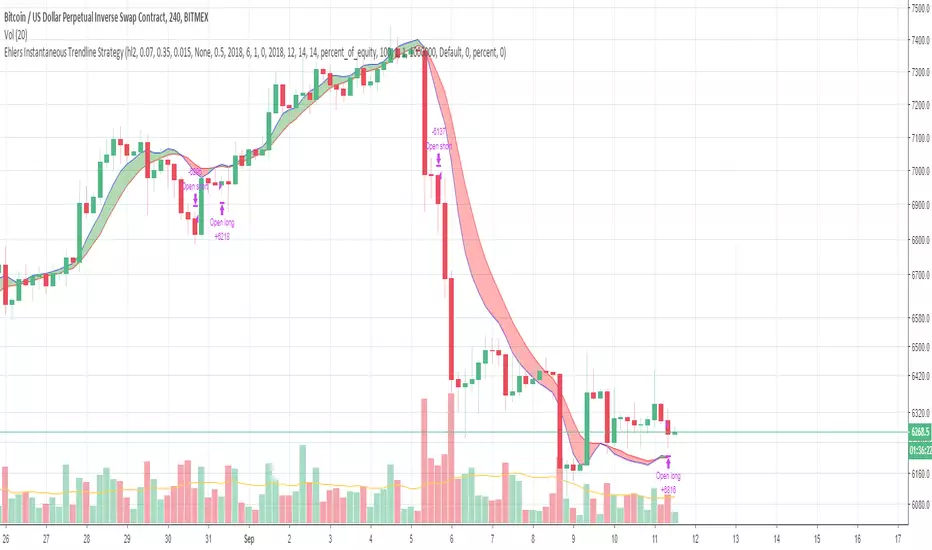
Ehlers Instantaneous Trendline StrategyInstantaneous Trendline Strategy by John Ehlers from his book "Cybernetic Analysis for Stocks and Futures".
You can choose implementation of stop-loss. Don't forget to define correct spread for your instrument.
XPloRR MA-Buy ATR-Trailing-Stop Long Term Strategy Beating B&HXPloRR MA-Buy ATR-MA-Trailing-Stop Strategy
Long term MA Trailing Stop strategy to beat Buy&Hold strategy
None of the strategies that I tested can beat the long term Buy&Hold strategy. That's the reason why I wrote this strategy.
Purpose: beat Buy&Hold strategy with around 10 trades. 100% capitalize sold trade into new trade.
My buy strategy is triggered by the EMA(blue) crossing over the SMA curve(orange).
My sell strategy is triggered by another EMA(lime) of the close value crossing the trailing stop(green) value.
The trailing stop value(green) is set to a multiple of the ATR(15) value.
ATR(15) is the SMA(15) value of the difference between high and low values.
Every stock has it's own "DNA", so first thing to do is find the right parameters to get the best strategy values voor EMA, SMA and Trailing Stop.
Then keep using these parameter for future buy/sell signals only for that particular stock.
Do the same for other stocks.
Here are the parameters:
Exponential MA: buy trigger when crossing over the SMA value (use values between 11-50)
Simple MA: buy trigger when EMA crosses over the SMA value (use values between 20 and 200)
Stop EMA: sell trigger when Stop EMA of close value crosses under the trailing stop value (use values between 8 and 16)
Trailing Stop #ATR: defines the trailing stop value as a multiple of the ATR(15) value
Example parameters for different stocks (Start capital: 1000, Order=100% of equity, Period 1/1/2005 to now):
BAR(Barco): EMA=11, SMA=82, StopEMA=12, Stop#ATR=9
Buy&HoldProfit: 45.82%, NetProfit: 294.7%, #Trades:8, %Profit:62.5%, ProfitFactor: 12.539
AAPL(Apple): EMA=12, SMA=45, StopEMA=12, Stop#ATR=6
Buy&HoldProfit: 2925.86%, NetProfit: 4035.92%, #Trades:10, %Profit:60%, ProfitFactor: 6.36
BEKB(Bekaert): EMA=12, SMA=42, StopEMA=12, Stop#ATR=7
Buy&HoldProfit: 81.11%, NetProfit: 521.37%, #Trades:10, %Profit:60%, ProfitFactor: 2.617
SOLB(Solvay): EMA=12, SMA=63, StopEMA=11, Stop#ATR=8
Buy&HoldProfit: 43.61%, NetProfit: 151.4%, #Trades:8, %Profit:75%, ProfitFactor: 3.794
PHIA(Philips): EMA=11, SMA=80, StopEMA=8, Stop#ATR=10
Buy&HoldProfit: 56.79%, NetProfit: 198.46%, #Trades:6, %Profit:83.33%, ProfitFactor: 23.07
I am very curious to see the parameters for your stocks and please make suggestions to improve this strategy.
