CRYPTO 3EMA Strategy with Take Profit & Stop Loss based on ATRSimple 3 EMA Strategy with plotted Take Profit and Stop Loss
Entry condition:
- Middle EMA cross above the Slow EMA
- Set take profit and stop loss exit conditions based on ATR Indicator
Exit condition:
- Fast EMA cross below the Middle EMA
Stoploss

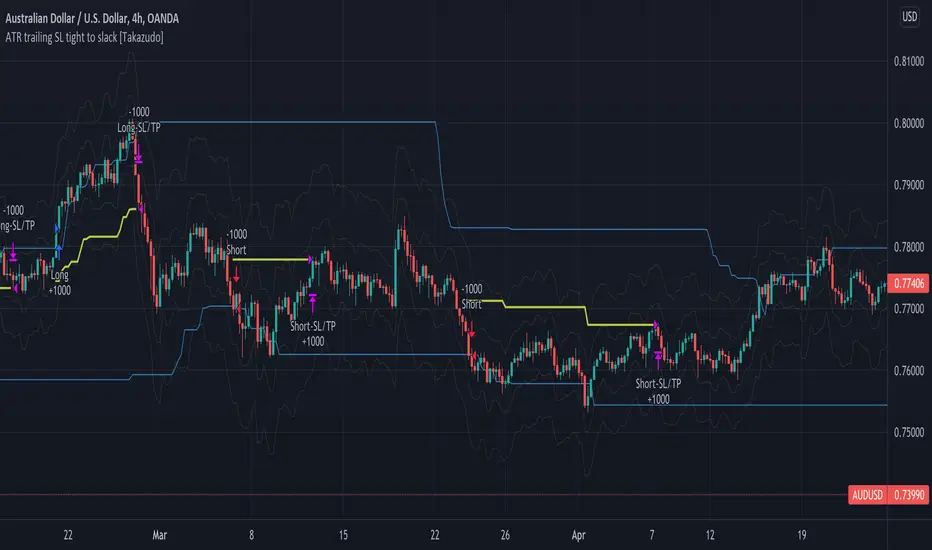
ATR trailing Stop Loss tight to slack [Takazudo]This is a demo of ATR based trailing Stop Loss.
This SL strategy uses 2 types of ATR based SL.
tight SL as initial (ATR * 1.5)
slack SL as trailing (ATR * 4)
When any entry singal occurs by the buy/sell conditions, this SL strategy uses the "tight SL" as the initial SL.
Then the SL will chase the price as trailing SL. However, this strategy uses the "slack SL" in this trailing phase.
So you can set the tight SL first.
Then SL will chase the price as the slack one.
Note: The entry strategy in this script is not intented to win. Check the result. Be careful. Just a module of my strategy.
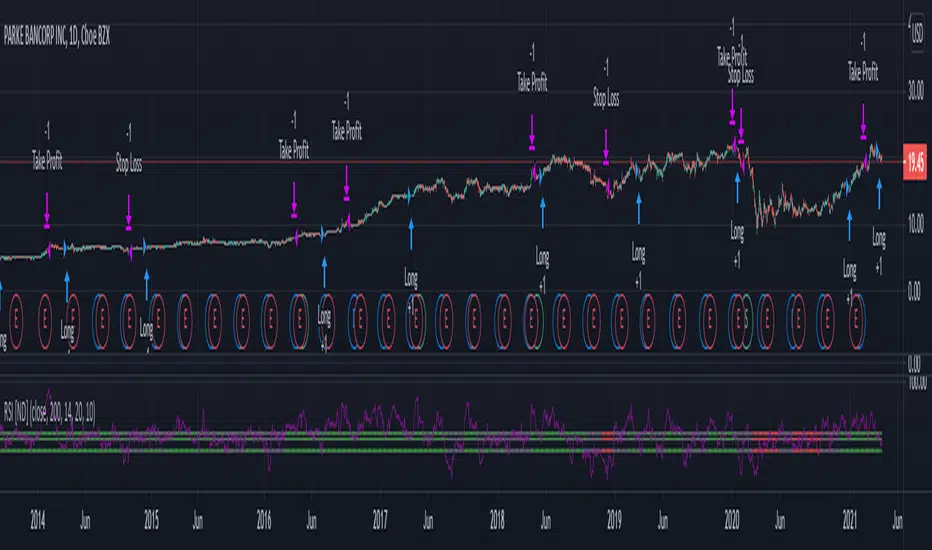
RSI Strategy [Nostradanis]Strategy based on an adaptation of the Relative Strength Index and slow exponential moving average.
Green lines: uptrend
Gray lines: lateral trend
Red Lines: downtrend
Use:
When RSI crosses up 40 and 50 lines can be a good long entry if ema trend is clearly bullish.
55 line confirms entry.
Designed for swing with under $20 shares but can be adapted to scalping
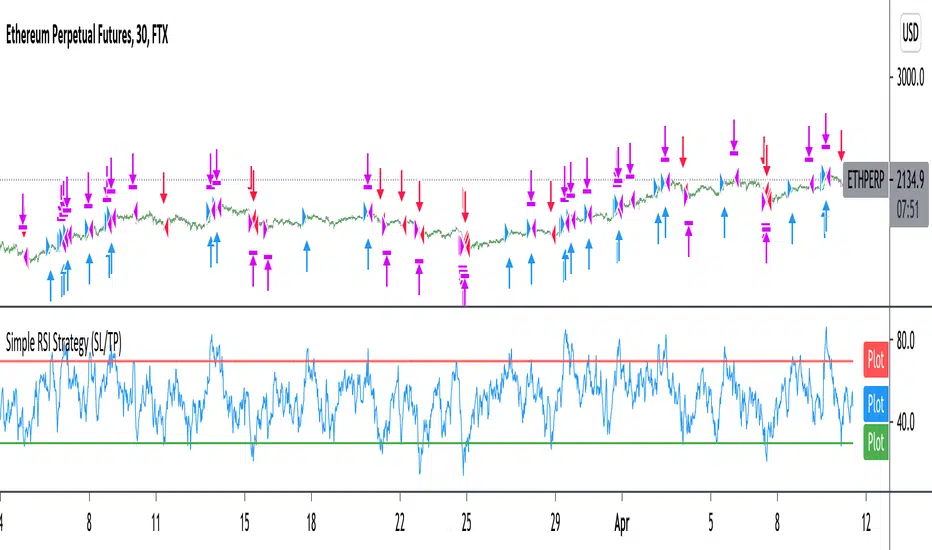
Improved simple RSI Buy/Sell at a level (SL/TP)Improved Simple Strategy based on RSI, using overbought or oversold levels.
Backtest: ETHPERP (FTX) - 30m
Set STOP LOSS and GET PROFIT as a percentage (2% and 10% by default).
If strategy.position_size != 0 algorithm convert percentages into points and set stop loss and take profit limit orders.
Fixed price Stop Loss [Takazudo]This strategy is a demo for fixed price stop loss.
This strategy enables you to specify fixed price stop loss. Let's say your deposit is USD. When you trade EURCAD, you need to specify the quantity for trade. Here comes three chances for trade.
A: SL pips: 500
B: SL pips: 200
C: SL pips: 100
In these trade, the risk is different for each. ABC risk ratio is 5:2:1. And, you cannot know how much to lose if the price hits the stop loss. This is a huge problem.
With this strategy, You can specify the fixed risk price for each trade. If you specify 100 USD for the risk, this strategy calculates how much quantity to buy or sell for each entry. In the case above, this strategy guides you how much quantity to buy or sell like below.
A: 2,000 qty (SL: 500pips)
B: 5,000 qty (SL: 200pips)
C: 10,000 qty (SL: 100pips)
If you make entries with those quantity and the price hits the stop loss, You will lose the money like below.
A: 100 USD
B: 100 USD
C: 100 USD
This is what this script does. Fixed price SL.
I tested this caliculation for OANDA's main 28 currency pairs forex listed below.
AUDUSD, EURUSD, GBPUSD, NZDUSD, USDCAD, USDCHF, USDJPY, AUDCAD, AUDCHF, AUDJPY, AUDNZD, CADCHF, CADJPY, CHFJPY, EURAUD, EURCAD, EURCHF, EURGBP, EURJPY, EURNZD, GBPAUD, GBPCAD, GBPCHF, GBPJPY, GBPNZD, NZDCAD, NZDCHF, NZDJPY
I may add more pairs later.
Note: The entry strategy in this script is not intented to win. Check the result. Be careful.

MACD 50x Leveraged Strategy Real Equity Simulation Hello, I wrote this script to merge the two scripts I shared before.
The aim here is to see the real value of the state of the capital as a result of leveraged transactions and to combine both long and short directions.
Scripts :
MACD Long 50x Leverage Strategy :
MACD Short 50x Leverage Strategy :
The parameters have not changed so they are the same as the previous two scripts:
Adding margin: Forbidden or not specified. (Add Margin : No)
Position Size : %1 (0.01) (For each trade)
Stop-Loss : %2 (For each trade)
Long : Crossover(delta,0) (Standard MACD)
Long Exit : Long Stop Level or Short Entry
(In the case of Long Stop, all trades are closed and no positions are opened in short direction.)
Short : Crossunder(delta,0) (Standard MACD)
Short Exit : Short Stop or Long Entry
(In the case of Short Stop, all trades are closed and no positions are opened in the long direction.)
NOTE :
This is a simulation made using standard parameters, showing the state of the balance in very simple rules with leveraged transactions only.
The nice thing here is the direct observation of the results by making modifications on the strategy parameters.
Regards.

Pyramiding Entries On Early Trends (by Coinrule)Pyramiding the entries in a trading strategy may be risky but at the same time very profitable with a proper risk management approach. This strategy seeks to spot early signs of uptrends and increase the position's size while the right conditions persist.
Each trade comes with its stop-loss and take-profit to enforce a proportional risk/reward profile.
The strategy uses a mix of Moving Average based setups to define the buy-signal.
The Moving Average (200) is above the Moving Average (100), which prevents from buying when the uptrend is already in its late stages
The Moving Average (9) is above the Moving Average (100), indicating that the coin is not in a downtrend.
The price crossing above the Moving Average (9) confirms the potential upside used to fire the buy order.
Each entry comes with a stop-loss and a take-profit in a ratio of 1-to-1. After over 400 backtests, we opted for a 3% TP and 3% SL, which provides the best results.
The strategy is optimized on a 1-hour time frame.
The Advantages of this strategy are:
It offers the possibility of adjusting the size of the position proportionally to the confidence in the possibilities that an uptrend will eventually form.
Low drawdowns. On average, the percentage of trades in profit is above 60%, and the stop-loss equal to the take-profit reduces the overall risk.
This strategy returned good returns both with trading pairs with Fiat/stable coins and with BTC. Considering the mixed trends that cryptocurrencies experienced during 2020 vs BTC, this strengthens the strategy's reliability.
The strategy assumes each order to trade 20% of the available capital and pyramids the entries up to 7 times.
A trading fee of 0.1% is taken into account. The fee is aligned to the base fee applied on Binance, which is the largest cryptocurrency exchange.

Buy the Dips (by Coinrule)Taking your first steps into automated trading may be challenging. Coinrule's mission is to make it as easy as possible, also for beginners.
Here follows the best trading strategy to get started with Coinrule. This strategy doesn't involve complex indicators, yet was proved to be effective in the long term for many coins. Results seem to be improved when trading a coin vs Bitcoin.
The strategy buys the dips of a coin to sell with a profit. A stop-loss protects every trade.
Crypto markets offer high volatility and, thus, excellent opportunities for trading. Excluding times of severe downtrend, buying the dip is a simple and effective long-term trading strategy. The buy-signal is set to a 2% drop in a 30-minutes time frame.
Each trade comes with a take profit and a stop loss. Both set at 2%.
You can adjust these percentages to the market volatility as an advanced setup. You can backtest the outcomes using the backtesting tool from Tradingview
The strategy assumes each order to trade 30% of the available capital. A trading fee of 0.1% is taken into account. The fee is aligned to the base fee applied on Binance, which is the largest cryptocurrency exchange.

ATR Trailing Stoploss StrategyI am sharing the strategy version of the indicator used before. It is very simple to use.
These are the settings I use, you can change, test and use as you wish.
Atr Period 5
Highest High Period 10
Multiplier 2.5
It can generate more signals in shorter time frames.
The success rate will be higher in longer time frames.

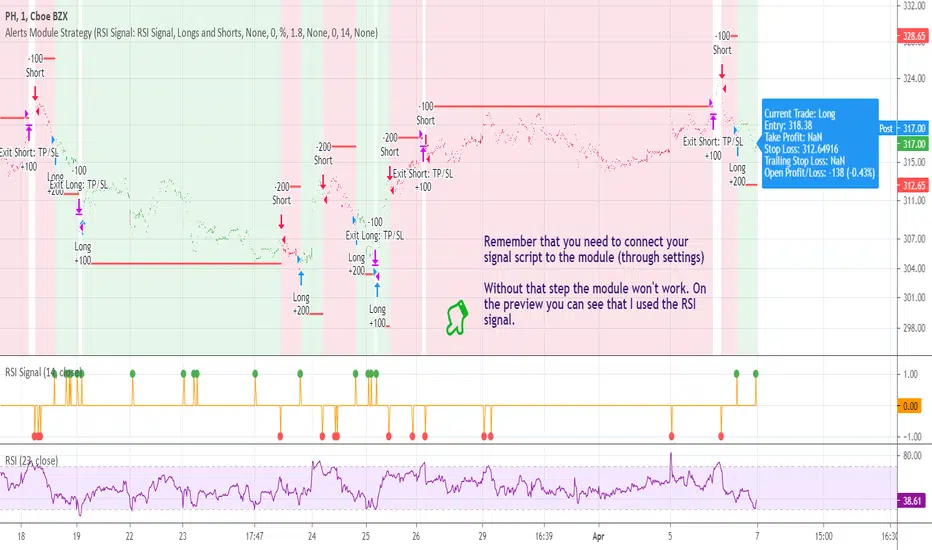
[STRATEGY] Buy/Sell/TP/SL/TSL Alerts ModuleA strategy version of the Buy/Sell/TP/SL/TSL Alerts Module .
It works the same way:
1) You choose a specific indicator and apply it to your chart
2) You create a special signal form of that indicator
3) You connect that form to the module
4) Bob's your uncle
If you have any questions don't hesitate to ask and contact me either via private messages on TradingView or via Telegram.
Thanks!
Tilson T3 and MavilimW Triple Combined StrategyInspired by truly greatful Kivanç Ozbilgic (www.tradingview.com).
The strategy tries to combined three different moving average strategies into one.
Strategies covered are:
1. Tillson T3 Moving Average Strategy
Developed by Tim Tillson, the T3 Moving Average is considered superior to traditional moving averages as it is smoother, more responsive and thus performs better in ranging market conditions as well. However, it bears the disadvantage of overshooting the price as it attempts to realign itself to current market conditions.
It incorporates a smoothing technique which allows it to plot curves more gradual than ordinary moving averages and with a smaller lag. Its smoothness is derived from the fact that it is a weighted sum of a single EMA, double EMA, triple EMA and so on. When a trend is formed, the price action will stay above or below the trend during most of its progression and will hardly be touched by any swings. Thus, a confirmed penetration of the T3 MA and the lack of a following reversal often indicates the end of a trend. Here is what the calculation looks like:
T3 = c1*e6 + c2*e5 + c3*e4 + c4*e3, where:
– e1 = EMA (Close, Period)
– e2 = EMA (e1, Period)
– e3 = EMA (e2, Period)
– e4 = EMA (e3, Period)
– e5 = EMA (e4, Period)
– e6 = EMA (e5, Period)
– a is the volume factor, default value is 0.7 but 0.618 can also be used
– c1 = – a^3
– c2 = 3*a^2 + 3*a^3
– c3 = – 6*a^2 – 3*a – 3*a^3
– c4 = 1 + 3*a + a^3 + 3*a^2
T3 MovingThe T3 Moving Average generally produces entry signals similar to other moving averages and thus is traded largely in the same manner.
Strategy for Tillson T3 is if the close crossovers T3 line and for at least five bars the close was under the T3
2. Tillson T3 Fibonacci Cross
Kivanc Ozbilgic added a second T3 line with a volume factor of 0.618 (Fibonacci Ratio) and length of 3 (fibonacci number) which can be added by selecting the T3 Fibonacci Strategy input box.
Strategy for Tillson T3 Fibo is when the Fibo Line crossover the T3 it gives long signal vice versa.
3. MavilimW
MavilimW is originally a support and resistance indicator based on fibonacci injected weighted moving averages.
Strategy for MavilimW is is if the close crossovers T3 line and for at least five bars the close was under the T3
Hope you enjoy

Trend trader StrategyFirst I would like to thank to @JustUncleL since this strategy started from one of his scalper strategies
This strategy can be adapted to all time charts .
First it has the session where we want to trade, for this example I choosed the EURUSD so I only take in consideration london/neywork session.
Its made from 3 EMA :
normal
slow
ultra slow
It has has the capacity to use HA candles into consideration if its needed.
At the same time we have a price channel made from faster MAs, that act like a bollinger band .
Together with all of them, we establish which trend we have if its uptrend or downtrend
Then we check the candles if they are below or above the MA , and based on the condition if they crossed recently we can suggest if its a buy or a long condition
At the same time we have 2 options of stop conditions:
Through a trailing stop made from ATR or % based
And second, a SL/TP made from pip points or % based.
For this example I used % based.
Let me know what you think about it, and if you found some nice settings for it. So far I only adapted to EURUSD 1 min time.

SIDD-Master-Moving-AverageSIDD-Master-Moving-Average is based on RSI average calculation Moving average plotted on chart.
This Moving Average is giving 2 signals Bullish and Bearish .
Whenever Bullish signals is coming price is doing crossover with moving average on upside and this indicate price will go up from current market price.
Whenever Bearish signals is coming price is doing cross-under with moving average on downside and this indicate price will go down from current market price.
Moving average color is changing based on upside movement or downside movement , for upside its green and for downside its orange color.
This indicator i have created with stop loss line means any price close below cross line for bullish position then that trade should be closed and take the stop loss. similarly for Bearish trade and candle close above stop loss line means trade should be closed and take the stop loss.
Stop loss i have taken care with ATR and Super trend you can see the settings.
I have defined setting for general use of indicator if any modification on setting then result may vary.
Its multi time frame moving average. And I have given time frame for indicator as well so if any trending move need to capture then that setting need to be increased with respect to chart time frame else keep it same.
I have added commission and slippages as well in indicator.
Ping me or DM me to subscribe this indicator.
I have given all my indicator details below link (Signature URL). You can check indicators and call me on given number or email me on given email to access the scripts and indicators. Telegram link is also given you can ping me there.
--------------------------------------------------------------------------------------------------------------------------------------
Disclaimer : Past performance of the indicator is not giving guarantee for future performance as well, it may change as per market condition.
-------------------------------------------------------------------------------------------------------------------------------------

Two Take Profits and Two Stop LossThis script is for research purposes only. I am not a financial advisor.
Entry Condition
This strategy is based on two take profit targets, two stop loss, and scaling out strategy. The entry rule is very simple. Whenever the EMA crossover WMA, the long trade is taken and vice versa.
Take Profit and Stop Loss
The first take profit is set at 20 pips above the long entry and the second take profit is set at 40 pips above the long entry. Meanwhile, the first stop loss is set at 20 pips below the long entry and the second stop loss is set at the long entry.
Money Management
When the first take profit is achieved, half of the position is closed and the first stop loss is moved to the entry-level. The rest of the position is open to achieve either second take profit or second stop loss.
There are three outcomes when using this strategy. Let's say you enter the trade with 200 lot size and you are risking 2% of your equity.
1. The first outcome is when the price hits stop loss, you lose the entire 2%.
2. The second outcome is when the price hits the first take profit and you close half of your position. Meaning that you have gained 1%. Then you let the trade running and eventually it hits the second stop loss. Remember your first stop loss has changed to the second stop loss when the first take profit is achieved. The total loss is 0% because the price is at your entry-level. You have gained the earlier 1% and then lost 0%. At this point, you are at 1% gained.
3. The third outcome is similar to the second out but instead of hitting the second stop loss, the trade is running to your favor and hits the second take profit.
Therefore, you gained 1% from the first take profit and you gained another 2% for the second take profit. Your total gained is 3%
Summary
The reason behind this strategy is to minimize risk. with normal strategy, you only have two outcomes which are either win or loss. With this strategy, you have three outcomes which win 3%, win 1%, or loss 2%.
This is my similar strategy but with single stop loss

Two Take Profit StrategyThis script is for research purposes only. I am not a financial advisor.
Entry Condition
This strategy is based on two take profit targets and scaling out strategy. The entry rule is very simple. Whenever the EMA crossover WMA, the long trade is taken and vice versa.
Take Profit and Stop Loss
The first take profit is set at 20 pips above the long entry and the second take profit is set at 40 pips above the long entry. Meanwhile, the stop loss is set at 20 pips below the long entry.
Money Management
When the first take profit is achieved, half of the position is closed. The rest of the position is open to achieve either second take profit or stop loss.
There are three outcomes when using this strategy. Let's say you enter the trade with 200 lot size and you are risking 2% of your equity.
1. The first outcome is when the price hits stop loss, you lose the entire 2%.
2. The second outcome is when the price hits the first take profit and you close half of your position. Meaning that you have gained 1%. Then you let the trade running and eventually it hits stop loss. The total loss is 0% because the remaining lot size which is 200/2=100 times by 20pips is 1%. You have gained the earlier 1% and then loss 1%. At this point, you are at break even.
3. The third outcome is similar to the second out but instead of hiring stop loss, the trade is running to your favor and hits the second take profit.
Therefore, you gained 1% from the first take profit and you gained another 2% for the second take profit. Your total gained is 3%
Summary
The reason behind this strategy is to minimize risk. with normal strategy, you only have two outcomes which are either win or loss. With this strategy, you have three outcomes which are win, loss or break even.

EMA trend reversal strategy "muxie1" - 1.5x to 3xThis uses 2 EMA and Stop Loss and Take Profit,
The stops don't fire at the precise value but only when the trend reverses
it is actually good for 1D since 2019, it was however optimised for 1min but I am not able to share for 1m.
have equivalent code for quantum zone ftx
Great profit factor from 1.5x to 3x
Mandatory input is the position size per trade, tested with 1 btc for 100k virtual capital, remember to set it small for a low risk per trade, and even smaller if you use leverage,


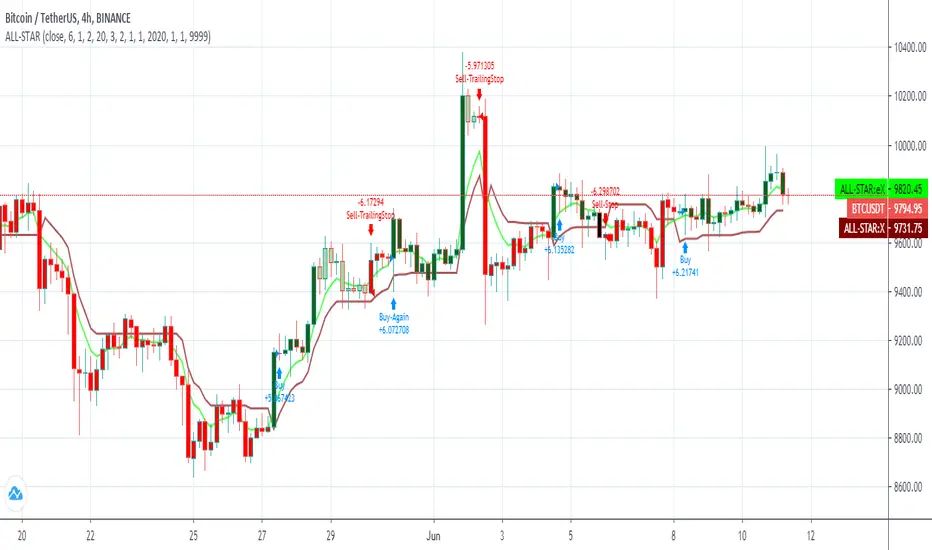
ALL-STAR STRATEGY TP-SL-TSHello!
This strategy combines multiple following stop and take profit strategies. Basically, after purchasing depending on the MOST Strategy, with the values you will determine from the settings section;
stop loss with percentage (settings > Manuel Stop Loss Ratio),
sell and take profit if it is at max profit level (settings > Take Profit Ratio),
activate the trailing stop after it exceeds a certain profit rate, and if it has dropped from this value by a certain rate, sell and take profit (settings > Trailing Stop Start Ratio) > (settings > Trailing Stop Ratio)
you can have your transactions done. In addition, the transaction, which is stopped according to the MOST strategy, also goes into a sell state.
The bars that are in the Sell state, switch to the Buy state, enter the trailing stop area, and are in the state of Buy despite the Most are shown in different colors.
Türkçe
Bu strateji birden fazla takip eden stop ve kar al stratejisini birleştirmektedir. Temelde MOST Stratejisine bağlı olarak alım yaptıktan sonra, ayarlar bölümünden belirleyeceğiniz değerler ile;
yüzde ile zarar durdur (ayarlar> Manuel Stop Loss Ratio),
max kar al seviyesine geldiyse sat ve kar al (ayarlar> Take Profit Ratio),
belirli bir kar oranını geçtikten sonra takip eden stop aktif et ve bu değerden belirli bir oranda düştü ise sat ve kar al (ayarlar> Trailing Stop Start Ratio) > (ayarlar> Trailing Stop Ratio)
işlemlerini yaptırabilirsiniz. Bunların yanında, MOST'a göre stop olan işlem de sat durumuna geçer.
Sat durumunda olan, Al durumuna geçen, Takip eden stop alanına giren, Most'a göre al durumunda olduğu halde kar al işleminden sonraki barlar farklı renklerle gösterilmiştir.
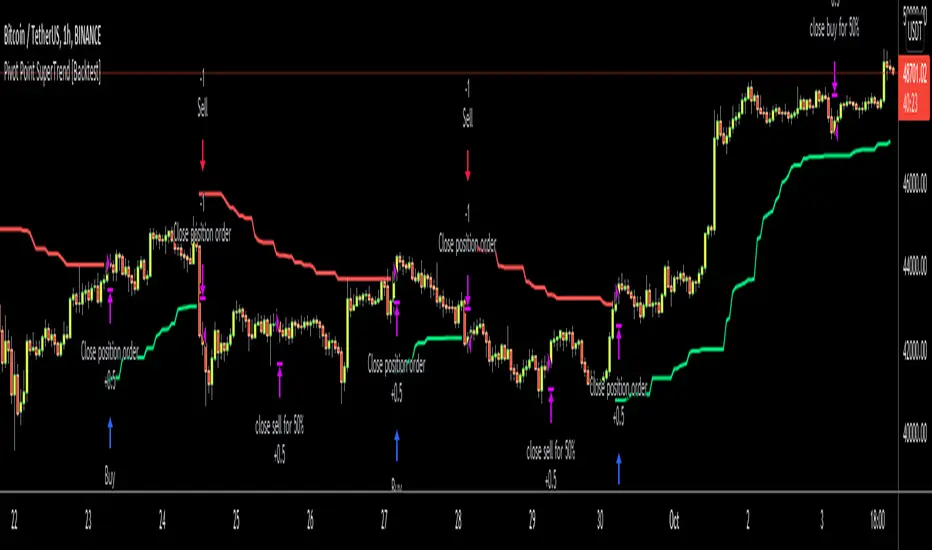
Pivot Point SuperTrend [Backtest]Hello All,
This is backtesting result of following indicator/strategy. I didn't work on adding other indicators. maybe in the future I can try to combine this with other indicators.
You can visit following link to see "Pivot Point SuperTrend" . by using this backtesting tool, you can test&find better options
There is option "Use Center Line to Close Entry for 50%" . by default it's not enabled. if you enable this option, pivot point center line may push you to close your entry for 50% (can be used as early stoploss/take profit line if you think it's risky)
Enjoy!
TITAN StrategyTitan Strategy it's a Volatility & price action indicator giving you the exact point of exit or stop or reversal
with 2 different lengths represent as 2-time frames to drive the trend and reversals during the bear market and the bull market
with one adjustable level of taking profit and one adjustable stop loss level.
Grate for swing trading and Bullrun recognition and scalp those short trade into the bear market
and there its 2 more timeframes or lengths for the short environments where titan will scalp short into the average true range
default settings are at 4% stop loss and 4% take profit
How to use :
Buy Signal: long condition
Sell Signal: Short condition
If you like to know how to apply to the service please send me a private msg
we have a full pdf guide that comes with indicator its will be provided to you for mentoring propose
thx for your time and support

Moving Average profit targets with var sizeProfit target:
Profit targets are those scenarios where the system expects to be greater than the actual return at the end of the transaction: they may be short-term benefits, such as a favorable price shock model.
In short-term transactions, profit objectives are essential. Price fluctuations make any favorable event likely to turn around in an instant. Moreover, profit objectives are more difficult to integrate into the longer-term trading system, because they are afraid of losing larger profits at risk, so they will replace them with smaller but more frequent gains. As a follower of the trend, once you make a profit and stop earning, but the trend direction is still intact, you need to find a way to re-enter the transaction to avoid losing the rare but very large market situation.
Profit target is best calculated based on price volatility (V), and the most commonly used method:
For Long, the system buy point (E), needs to be multiplied by the average true volatility or annualized volatility :E+f×V.
The net value multiplier f used to calculate the profit level is usually obtained through data mining.

GMS: Mean Reversion StrategyThis is based on my GMS: Mean Reversion Indicator ()
Features:
- % Based Profit Target and Stop Loss
- SMA Trend Filter
- Can choose trade exit based off a moving average or linear regression curve
- Filter for long only trades, short only trades, or both at the same time.
Source code is open, so feel free to take a look!
I hope it helps,
Andre

RSI and Smoothed RSI Bull Div Strategy [BigBitsIO]This strategy focuses on finding a low RSI value, then targeting a low Smoothed RSI value while the price is below the low RSI in the lookback period to trigger a buy signal.
Features Take Profit, Stop Loss, and Plot Target inputs. As well as many inputs to manage how the RSI and Smoothed RSI are configured within the strategy.
Explanation of all the inputs
Take Profit %: % change in price from position entry where strategy takes profit
Stop Loss %: % change in price from position entry where strategy stops losses
RSI Lookback Period: # of candles used to calculate RSI
Buy Below Lowest Low In RSI Divergence Lookback Target %: % change in price from lowest RSI candle in divergence lookback if set
Source of Buy Below Target Price: Source of price (close, open, high, low, etc..) used to calculated buy below %
Smoothed RSI Lookback Period: # of candles used to calculate RSI
RSI Currently Below: Value the current RSI must be below to trigger a buy
RSI Divergence Lookback Period: # of candles used to lookback for lowest RSI in the divergence lookback period
RSI Lowest In Divergence Lookback Currently Below: Require the lowest RSI in the divergence lookback to be below this value
RSI Sell Above: If take profit or stop loss is not hit, the position will sell when RSI rises above this value
Minimum SRSI Downtrend Length: Require that the downtrend length of the SRSI be this value or higher to trigger a buy
Smoothed RSI Currently Below: Value the current SRSI must be below to trigger a buy
