Strategia Pine Script®
Strategy!

3ngine Global BoilerplateABOUT THE BOILERPLATE
This strategy is designed to bring consistency to your strategies. It includes a macro EMA filter for filtering out countertrend trades,
an ADX filter to help filter out chop, a session filter to filter out trades outside of desired timeframe, alert messages setup for automation,
laddering in/out of trades (up to 6 rungs), trailing take profit , and beautiful visuals for each entry. There are comments throughout the
strategy that provide further instructions on how to use the boilerplate strategy. This strategy uses `threengine_global_automation_library`
throughout and must be included at the top of the strategy using `import as bot`. This allows you to use dot notation
to access functions in the library - EX: `bot.orderCurrentlyExists(orderID)`.
HOW TO USE THIS STRATEGY
1. Add your inputs
There is a section dedicated for adding your own inputs near the top of the strategy, just above the boilerplate inputs
2. Add your calculations
If your strategy requires calculations, place them in the `Strategy Specific Calculations` section
3. Add your entry criteria
Add your criteria to strategySpecificLongConditions (this gets combined with boilerplate conditions in longConditionsMet)
Add your criteria to strategySpecificShortConditions (this gets combined with boilerplate conditions in shortConditionsMet)
Set your desired entry price (calculated on every bar unless stored as a static variable) to longEntryPrice and shortEntryPrice. ( This will be the FIRST ladder if using laddering capabilities. If you pick 1 for "Ladder In Rungs" this will be the only entry. )
4. Plot anything you want to overlay on the chart in addition to the boilerplate plots and labels. Included in boilerplate:
Average entry price
Stop loss
Trailing stop
Profit target
Ladder rungs
Strategia Pine Script®

Moon Phases Strategy with CCI EXTRIME TPHELLO TO ALL ASTROLGY TRADING LOVERS
***im not a native english speaker and im not going to google translte it so soory for mastakes ****
this is an amzing script of moon cycle strategy
for long -
price need to be above MA
it will buy in full moon and will sell at new moon
i added an extrime CCI TP that if cci is over bought above 200 line it will close position- it cant be edited out so enjoy it.
for short-
price need to be below MA
it will short when new moon and buy back when fullmoon
i added an extrime CCI tp that if cci is oversold under -200 line it will close position - it cant be edited out so enjoy it.
just edit the new moon Reference date by your UTC TIME!!! ׂ( GOOGLE 'NEW MOON DATE')
לכל אוהבי האסטרולוגיה ומסחר בכוכבים
סקריפט פשוט מעולה!
ללונג- האסטרטגיה קונה כאשר המחיר מעל הממוצע ויש ירח מלא-היא מוכרת כאשר יש ירח חדש או כאשרס.ס.י חוצה את קו ה200
בשורט היא עושה ההפך ומוכרת כאשר יש ירח חדש והמחיר מתחת לממוצע-היא סוגרת את הפוזציה כאשר יש ירח מלא או כאשר ס.ס.י חוצה מטה את רמת המינוס 200
אנא ערכו את התאריך רפרנס לירח לפי אזור הזמן שלכם חפשו בגוגל ''תאריך ירח חדש'.
BACKTEST RETURNS SOOOOOO GOOOOD !
הבאק טסטים חוזרים מושלמים
trade with the stars and rip markets
Strategia Pine Script®

Swing Failure Reversal StrategyThis strategy is using Swing Failure Patterns as a reversion indicator.
The strategy automatically adapts itself to the timeframe of the current chart.
Swing Failure Pattern occurs when the price trend fails to set new highs in uptrend or meet new lows in a downtrend. This pattern helps traders decide when to enter and exit the market. Usually, traders enter in the downtrend i.e. lower price highs and lower price lows, and exit in the uptrend situation i.e. higher price highs and higher price lows. Thus, traders go against the current trend. This helps the traders take advantage of early trend reversal indicators.
Types of Failure Swing :
Failure Swing Top: This occurs when the stock price goes higher whereas the RSI fails to make a higher high and falls below the recent fail point. The Fail Point is where the RSI line is below the recent swing low. This Failure Swing indicates a short position.
Failure Swing Bottom: This occurs when the stock price gets lower whereas RSI fails to make a lower low and rises over the recent fail point. Fail point is the point where the RSI line is above the recent swing high. This Failure Swing indicates a long position.
Strategia Pine Script®

Crypto_Troll_Turtle_StrategyTurtle Strategy for high marketcap cryptocurrencies
I'm glad to launch my strategy which is based on
moving averages / bollinger bands / RSI and volume
It's basically made for scalping with an interesting return over the last two years and a perspectively low drawdown
if you're interested in the strategy and you want to use it for futures trading you can contact me for a money & risk management rules that you can use and prevent you from a huge loss !! it's for free don't worry xD you can find my contact in the author's instructions' label
The optimal timeframe to use is 1H
I'll be trying to launch telegram signals for this strategy as soon as possible for the following pairs: BTCUSDT ETHUSDT BNBUSDT timeframe: 1H
I'm open to all reviews ! thanks !
Strategia Pine Script®

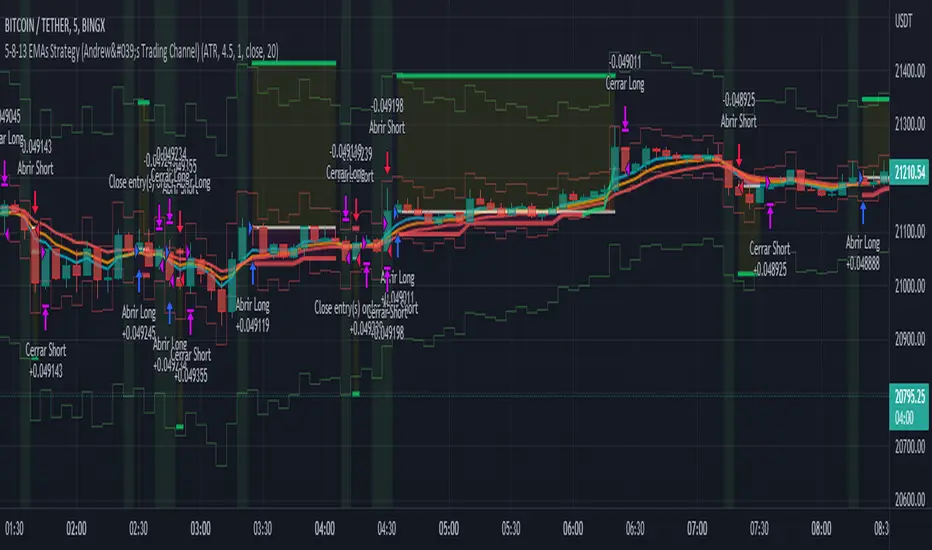
5-8-13 EMAs Strategy (Andrew's Trading Channel)============
ENGLISH
============
- Description:
This strategy was designed by "Andrew's Trading Channel" (credits to him for the base strategy).
A lot of improvements have been added to the strategy, more conditions, trailing stop, custom stop loss and take profit, everything explained below.
- CONDITIONS FOR ENTERING A LONG:
EMA 5 crossovers EMA 8.
- EXIT LONG:
EMA 8 crossovers EMA 8 and closing price goes below EMA 13.
- CONDITIONS FOR ENTERING SHORT:
EMA 8 crossovers EMA 5.
- EXIT SHORT:
EMA 5 crossovers EMA 8 and closing price goes above EMA 13.
- Visual:
All EMAs are visible (5, 8 and 13 periods) with different and customizable colors/width.
Position start price, take profit, stop loss and trailing stop (if present) are shown automatically.
Background color shows green when LONG conditions are met (and of course, position is opened on the next candle), same for SHORT but red.
- Usage and recommendations:
As this is a coded strategy, you don't even have to check for indicators, just open and close trades as the strategy shows.
There're various customizable settings like optional take profit/stop loss, trailing stop (both based on ATR or any of the EMAs), open only LONGs/SHORTs or both, date range...
Take profit and stop loss ATR default values have been tested for scalping on 5 min charts, however feel free to check strategy results and increase the winning rate/profit for your favorite asset.
- Customization:
As usual I like to make as many aspects of my indicators/strategies customizable, indicators, colors etc., feel free to ask if you feel that something that should be configurable is missing or if you have any ideas to optimize the strategy.
============
ESPAÑOL
============
- Descripción:
Esta estrategia fue diseñada por "Andrew's Trading Channel" (créditos a él por la estrategia base).
Se han añadido muchas mejoras a la estrategia, más condiciones, trailing stop, stop loss y take profit personalizados, todo explicado a continuación.
- CONDICIONES PARA ENTRAR EN LONG:
Cruce de EMA 5 con EMA 8 ascendente.
- SALIR DE LONG:
Cruce de EMA 8 con EMA 5 ascendente y el precio de cierre se sitúa por debajo de la EMA 13.
- CONDICIONES PARA ENTRAR EN SHORT:
Cruce de EMA 8 con EMA 5 ascendente.
- SALIR DE SHORT:
Cruce de EMA 5 con EMA 8 ascendente y el precio de cierre se sitúa por encima de la EMA 13.
- Visual:
Todas las EMAs son visibles (5, 8 y 13 períodos) con colores/anchos y personalizables.
El precio de inicio de la posición, el take profit, el stop loss y el trailing stop (si están presentes) se muestran automáticamente.
El color de fondo es verde cuando se cumplen las condiciones de LONG (y por supuesto, la posición se abre en la siguiente vela), lo mismo para SHORT pero en rojo.
- Uso y recomendaciones:
Como esta es una estrategia programada, ni siquiera tienes que comprobar los indicadores, sólo abrir y cerrar las operaciones como te muestra la estrategia.
Hay varios ajustes personalizables como el take profit/stop loss opcional, el trailing stop (ambos basados en el ATR o en cualquiera de las EMAs), abrir sólo LONGs/SHORTs o ambos, rango de fechas...
Los valores por defecto del take profit y el stop loss ATR han sido probados para scalping en gráficos de 5 minutos, sin embargo, siéntase libre de comprobar los resultados de la estrategia y aumentar la tasa de ganancia / beneficio para su activo favorito.
- Personalización:
Como siempre me gusta hacer personalizables todos los aspectos de mis indicadores/estrategias, indicadores, colores, etc., siéntase libre de preguntar si cree que falta algo que debería ser configurable o si tiene alguna idea para optimizar la estrategia.
Strategia Pine Script®
Buy and hold strategyA simple buy and hold strategy. A short or a long position can be chosen. The start date will determine the date where your position will start and end date is the date it will end. This works well as a baseline to your other existing strategies since buy and hold is just the simplest strategy available.
Strategia Pine Script®

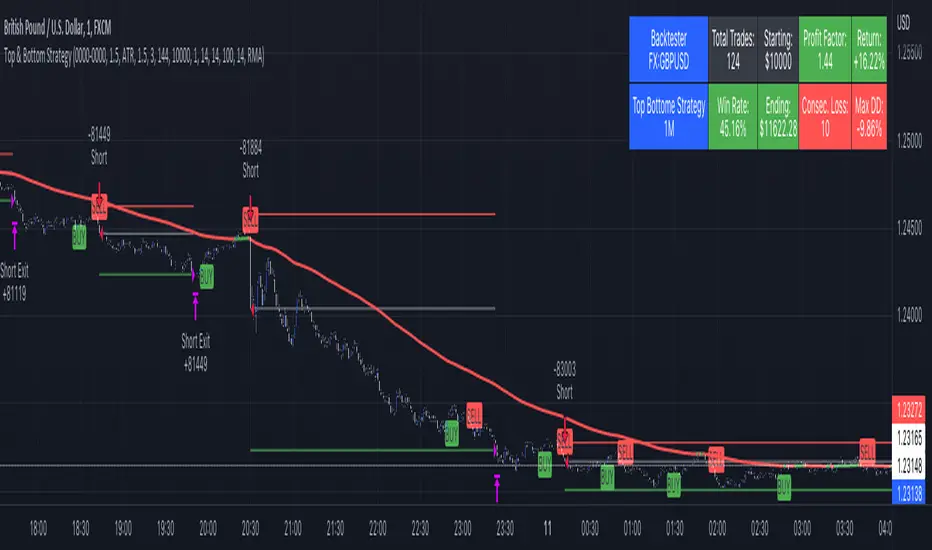
Top & Bottom Strategy by The Accumulation ZoneHey Guy's welcome back to another Strategy based on a popular Indicator!
Indicators used in this Strategy:
-> Top and Bottom by ceyhun (Basic Settings)
-> Volatility Oscillator by verifid (Basic Settings)
Long Entry Criteria:
1. New Buy Signal from the Top & Bottom Indicator
2. Bullish Spike to the upside on the Volatility Oscillator ( above the BB Bands)
3. Enter Long (SL based on ATR, RR 1.5)
Short Entry Criteria:
1. New Sell Signal from the Top & Bottom Indicator
2. Bearish Spike to the downside on the Volatility Oscillator ( below the BB Bands)
3. Enter Short (SL based on ATR, RR 1.5)
Optional Filters:
- Session Filter
- Date Filter
- EMA Filter
IMPORTANT use this only for testing purpose. Don't Risk any Money. For educational Purpose Only!
Strategia Pine Script®
Breakout Finder Strategy by The Accumulation ZoneThe Breakout Strategy:
Indicators used:
Least Squared Moving Average by Tradingview
Smoothed Moving Average by Tradingview
MACD Support Resistance by venkatachari_n
About this Strategy:
This strategy is based on spotting a particular activity pattern involving the above listed indicators:
A fast moving average that will track closely with price while still smoothing out some price chop
A slower least squared moving average to help gauge short-term momentum
MACD Support and Resistance to help identify longer-term trends and potentially serve to also guide directional bias
If all entry conditions are met, the strategy enters a position. As well as sending an alert message for the Entry, TP/SL Signals
Long Condition:
Price close above MACD S/R Line
SMMA crossed MACD S/R Line to the upside
LSMA crossed MACD S/R Line to the upside
Short Condition:
Price close below MACD S/R Line
SMMA crossed MACD S/R Line to the downside
LSMA crossed MACD S/R Line to the downside
Strategy Settings
SL based on ATR Bands (0.9 ATR Multiplier recommended*)
TP based on RR (1.5 RR recommended*)
Optional EMA Filter (If set to 0 -> disabled)
Session Filter
Custom Strategy Backtesting Dashboard (Risk = 5%*)
*Recommended for a Daily BTC/USDT Chart
Strategia Pine Script®

Gap Reversion StrategyToday I am releasing to the community an original short-term, high-probability gap trading strategy, backed by a 20 year backtest. This strategy capitalizes on the mean reverting behavior of equity ETFs, which is largely driven by fear in the market. The strategy buys into that fear at a level that has historically mean reverted within ~5 days. Larry Connors has published useful research and variations of strategies based on this behavior that I would recommend any quantitative trader read.
What it does:
This strategy, for 1 day charts on equity ETFs, looks for an overnight gap down when the RSI is also in/near an oversold position. Then, it places a limit order further below the opening of the gapped-down day. It then exits the position based on a higher RSI level. The limit buy order is cancelled if the price doesn't reach your limit price that day. So, the larger you make the gap and limit %, the less signals you will have.
Features:
Inputs to allow the adjustment of the limit order %, the gap %, and the RSI entry/exit levels.
An option to have the limit order be based on a % of ATR instead of a % of asset price.
An optional filter that can turn-off trades when the VIX is unusually high.
A built in stop.
Built in alerts.
Disclaimer: This is not financial advice. Open-source scripts I publish in the community are largely meant to spark ideas that can be used as building blocks for part of a more robust trade management strategy. If you would like to implement a version of any script, I would recommend making significant additions/modifications to the strategy & risk management functions. If you don’t know how to program in Pine, then hire a Pine-coder. We can help!
Strategia Pine Script®

SuperIchi StrategyTRADE CONDITIONS
Long entry:
Tenkan-Sen is above Kijun-Sen (blue line above red line)
Price closes above both Tenkan-Sen and Kijun-Sen (price closes above both blue and red lines)
Tenkan-Sen and Kijun-Sen is above Senkou Span (both blue and red lines are above cloud)
Senkou Span is green (cloud is green)
Price pulled back and closed below both Tenkan-Sen and Kijun-Sen within last X (configurable in settings) candles (price pulled back below blue and red lines)
Short entry:
Tenkan-Sen is below Kijun-Sen (blue line below red line)
Price closes below both Tenkan-Sen and Kijun-Sen (price closes below both blue and red lines)
Tenkan-Sen and Kijun-Sen is below Senkou Span (both blue and red lines are below cloud)
Senkou Span is red (cloud is red)
Price pulled back and closed above both Tenkan-Sen and Kijun-Sen within last X (configurable in settings) candles (price pulled back above blue and red lines)
Risk management:
Each trade risks 2% of account (configurable in settings)
SL size determined by swing low/high of previous X candles (configurable in settings) or using the ATR override (configurable in settings) where the max of swing high/low or ATR value will be used to calculate SL
TP is calculated by Risk:Reward ratio (configurable in settings)
TIPS
Timeframe: I have found best results running on anything 5M and above
CREDITS
SuperIchi by LuxAlgo
Strategia Pine Script®

The Impossible TraderTHE IMPOSSIBLE TRADER
A simple, but effective High Freq Strategy script based on MACD or RSI trend, with extra customizable Alert Messages for Bots.
WHAT IT DOES
This script (works best at lower TimeFrames) just follow the trend of MACD or RSI on your asset.
Why it should work? Because in an upper trend, there are more chance of green candles than reds. And in dump trend there are more chance of red candles than greens.
While trend is positive, it will try to open Long orders as fast as possible at market price.
While trend is negative, it will try to open Short orders as fast as possible at market price.
HOW TO SETUP YOUR PREFERENCES
Capital : Insert a % of Margin you want to use for your positions (usually 30% is quite good)
Leverage : Choose leverage based on your plans
Trail Tick @ : This value (in Tick) tell the script "when" the "Trail Stop" order must be activated (from the Entry price)
Offset Tick @ : This is the price (in Tick) from the Trail Stop Price activated. Basically it is a Stop Loss that follow the price at a fixed distance.
SL Tick @ : Set a Stop Loss at amount Tick distance from the Entry Price. (Let's call it a Safety Stop Loss for bad decisions...)
TP Tick @ : Set a Take Profit at amount Tick distance from the Entry Price. Sometimes is better to exit in full Gain than keep positions.
Strategy : You can choose a Only Long, Only Short or Long+Short sametime strategy.
with MACD or RSI : You can try the strategy applied on MACD or applied on customizable RSI EMA
EMA : If you choosed RSI EMA, you can set any value for your testing (usually 80-120 works very nice)
Exit order after bars : Some Exchanges / Brokers apply fixed cost, and a strategy too fast could not be productive. This set will let you to delay the Exit Order on already Opened positions.
Keep Stop Loss active : If you are planning a delay for Exit Orders, sometime could be useful to keep activated Stop Loss.
Strategy Preset : Some preset I've found interesting, with good results.
BackTest Days : If there are too many results and script doesn't work, you can choose a closer range to show results.
EXTRA FEATURES
On Screen Display : OSD will show you some realtime stats about your strategy, like Asset Tick, Trading Period Range, Drawdown, Gains and not closed trade.
Alert Message : You can enter custom Long Entry/Exit and Short Entry/Exit message for your Bots (like AutoView, WunderBit, etc...). When alert is triggered, you can send custom message with {{strategy.order.comment}} in the text field
AutoView Alert Message : If you are user of AutoView, you can generate your calls. Those are tested only on Oanda with index like Sp500, US100, Us30.
TIPS ON USE
Some asset on TradingView require an higher initial capital. Go to this Script Settings -> Properties and rise Initial Capital.
Be aware of commissions and spread when evalutating a strategy. Go to this Script Settings -> Properties and set Commission and Slippage
Trail Stop and Ticks could be difficult to understand, but very profitable. Please take your time and study how it works.
Consider Tick like the minimum movement your asset can do. Ticks occurs "intra-bar", so some of your positions could be closed almost instantly.
Consider Trail Stop like a Stop Loss that keep always the same distance from your positions, but never came back . If you are in gain, say of 10 Ticks, and your Trail have 5 Ticks, this means for sure a close at minimum 5 Ticks from Entry Price.
On Screen Display will show you Ticks for your asset. This will help you on strategy settings, because not all asset responds on the same way.
ONLY LONG EXAMPLE
ONLY SHORT EXAMPLE
Strategia Pine Script®

Pinbar trailing stop strategyThe strategy finds the nearest pinbar pattern and opens a position (long or short). You choose your take profit and stop loss multiplier.
Take Profit - X times the pinbar size from it's highest point.
Stop loss - X times the pinbar size from it's lowest point.
You can find more detailed screenshots and the source-code on my github page: samgozman/pinbar-strategy-tradingview
Strategia Pine Script®

Bollinger Bands + EMA 9A 1 minute scalping strategy.
Uses Bollinger Bands (no basis line) and a 9 period EMA.
Waits for price to close below the lower Bollinger Band and the next candle to close bullish above the lower Bollinger Band but below the 9 Period EMA.
If all conditions are met, the script enters a long position with TP at the 9 Period EMA.
Strategia Pine Script®

Boom Hunter + Hull Suite + Volatility Oscillator StrategyTRADE CONDITIONS
Long entry:
Boom Hunter (leading indicator): Trigger line crosses over Quotient 2 line (white cross over red)
Hull Suite (trend confirmation): Price closed above hull suite line and hull suite is green (represented by horizontal line at -10 in strategy pane)
Volatility Oscillator (volatility confirmation): Volatility spike trigger line is above upper band (represented by horizontal line at -30 in strategy pane)
Short entry:
Boom Hunter (leading indicator): Trigger line crosses under Quotient 2 line (white cross under red)
Hull Suite (trend confirmation): Price closed below hull suite line and hull suite is red (represented by horizontal line at -10 in strategy pane)
Volatility Oscillator (volatility confirmation): Volatility spike trigger line is below lower band (represented by horizontal line at -30 in strategy pane)
Risk management:
Each trade risks 3% of account (configurable in settings)
SL size determined by swing low/high of previous X candles (configurable in settings) or 1 ATR if swing is less than 1 ATR
TP is calculated by Risk:Reward ratio (configurable in settings)
TIPS
Timeframe: I have found good results running on BTC/USDT 5M chart
Note: To help visual identification of trade entries and exits you may wish to add the Hull Suite and Volatility Oscillator to the chart separately. It was not possible to display them in a clear way within a single panel for the strategy. Make sure you set the settings of the auxiliary indicators to match what is in the settings of this indicator if you do decide to add them.
CREDITS
Boom Hunter Pro by veryfid
Hull Suite by InSilico
Volatility Oscillator by veryfid
Strategia Pine Script®

Price action: Double top/bottom StrategyDouble top and bottom patterns are chart patterns that occur when the underlying investment moves in a similar pattern to the letter "W" (double bottom) or "M" (double top).
In this strategy, I use Pivot High/Low to find Double top and bottom.
Entry long: when Double bottom occur.
Entry short: when Double top occur.
Risk: Reward: You can change % Stop loss and Target pfofit.
Strategia Pine Script®

Donchian with QQW MOD AND EMA strategythe 1st indicator is E M A , and the 2nd indicator is donchian trend , and the final one is Q Q E MODe , and we have to change some settings , change this E M A length from 9 to 200 ,
and change some settings on donchian indicator , so lets change Donchian channel period from 20 to 30 , and Q Q E MOD on default sittings
for a long signal to be valid , the price must be above 200 E M A ,with NEW blue histogram appeared on our q q e mode , if , donchian trend is red
for a short signal to be valid , the price must be below 200 E M A ,with NEW red histogram appeared on our q q e mode ,if ,donchian trend is green
Strategia Pine Script®

parabolic sar with ema and rsi, this strategy includes 3 free trading view indicators, with HIGH ken ashee candles , now lets go ahead and add them to our chart ,
the 1st indicator is parabolic saarr and the 2nd indicator is E M A , and the final one is R S I , and we have to change some settings , change this E M A length from 9 to 200 ,
and change some settings on R S I indicator , so lets remove all options except for , the R S I , and the R S I middle band , and parabolic saarr on default sittings , now our strategy is ready , lets go into trading rules .
for a long signal to be valid , the price must be above 200 E M A ,with NEW buy signal from parabolic saarr, if , R S I above the middle 50 line
for a short signal to be valid , the price must be below 200 E M A , with NEW SELL signal from parabolic saarr ,if ,R S I BELOW 50 line
now we can go ahead and take a SHORT position
our stoploss must be above the recent higher high
and the risk to reward ratio will be 2
Strategia Pine Script®

Nabz-BBMACD-2022-V1.1I have tried to make script which triggers indicators on combination of different feedback including Bollinger bands and MACD. Also used some of my logic by trial and error, It gave 744%+ profit on back-testing on coin RUNE/USDT from Jan 2021. It is my first script, I am happy to help the community. Please share your feedback.
Strategia Pine Script®

HULL SUIT ,VORTEX,VOLUME OSC this strategy includes 3 free tradingview indicators
the 1st indicator is hull suit and the 2nd indicator is vortex and the final one is volume oscillator
for a long signal to be valid
the price must be above green hull suit line
, with new bullish cross on vortex , the blue line has to crossover the red line this would be anew signal to entr long position if volume oscillator above zero line , our stoploss must be under the recent lower low
and the risk to reward ratio will be 1.5
for a short signal to be valid , the price must be below red hull suit line
, with new cross on vortex , the red line has to crossover the blue line this would be anew signal to entr short position if volume oscillator above zero line ,
and lets see what happened to our trade
Strategia Pine Script®

Parabolic SAR Heikin Ashi MTF Candle ScalperThis is scalper strategy designed around parabolic sar indicator, where as an input candle value it uses the heikinashi from a higher timeframe.
This example has been adapted to SPY/SPX chart
In this case ,we are using a 5 min chart, but the calculations are made on a 15 min heikin ashi chart for the PSAR and then on 5 min chart we plot the results.
At the same time we are conditioning the entry to be base on a time/session for daytrading/scalper mentality
In this case we only enter within the first 30 min of SPY opening session , and then we exit after 3-4 hours of staying in the position ( unless we hit a reverse condition).
For long condition we enter when the mtf ha candle close is above the mtf psar and for short condition we enter when the mtf ha candle close is below the mtf psar
This script is made with an educational purpose to show the power of multiple time frame approach compared to a single chart.
If you have any questions, let me know !
Strategia Pine Script®

Scalp 1min CryptoThis scalping strategy is designed for 1min timeframe.
It uses indicators: SuperTrend 15m ( is used to filter the trade as to open only long position or short position), Wavetrend 1min, Bollinger Band 3min, Stoch 3min to find entry.
TP: optimized value : 0.5 - 1
Stoploss: You have two choice: % or when SuperTrend reverse
If you would like use scripts, please ib to me.
You are welcom!
Strategia Pine Script®

Hull Suite + Stoch RSI Strategy v1.1 This strategy uses Hull Suite with Stoch RSI
Uses Hull Suite as trend and only trades with the direction of the trend.
Entry conditions:
Hull Suite as a trend
Stoch RSI overbought for short entries & oversold for long entries
Current parameters works best on BINANCE:BNBBUSDPERP pair.
Strategia Pine Script®
