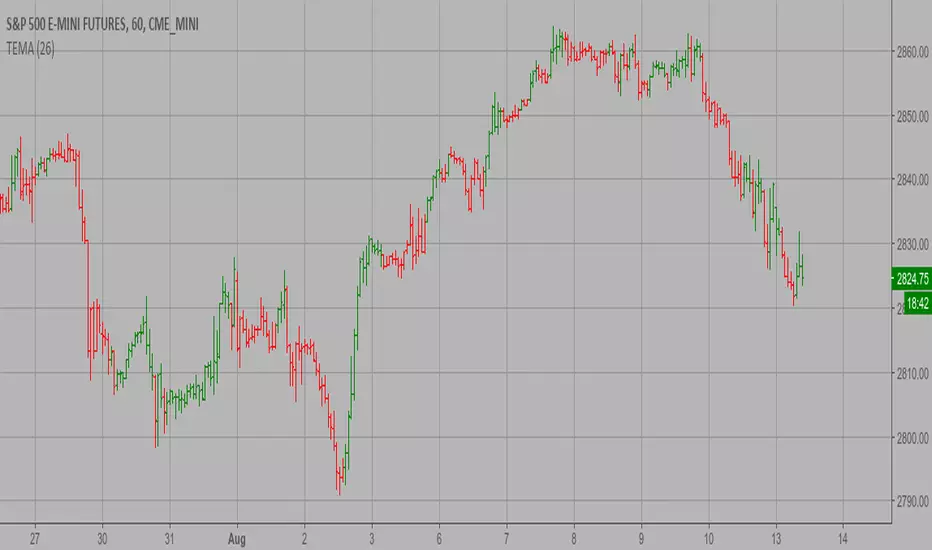
TEMA1 Strategy This study plots the TEMA1 indicator. TEMA1 ia s triple MA (Moving Average),
and is calculated as 3*MA - (3*MA(MA)) + (MA(MA(MA)))
WARNING:
- This script to change bars colors.
Strategy!
Moving average cloud strategyHi folks!
Here a script uses the moving average cloud. A sma (50, aqua) and a sma (200, olive) are plotted on the cart. When both sma go up the cloud is green. When both sma go down the cloud is red. When sma (200, olive) goes down and sma (50, aqua) goes up the cloud is orange. When sma (200, olive) goes up and sma (50, aqua) goes down the cloud is lime.
There three entry points in this strategy.
Long
Aggressive: When the cloud turns orange and price closes above the sma (200).
Neutral: When the both sma make the golden cross.
Cautious: When the cloud is green and price closes sma (200) after searching for support. So not when there's a great distance between them.
In case you missed the entry point you can jump in when price CLOSES above sma (50). So after it searched for support on that line. The cloud has to be green at that moment.
Short
Aggressive: When the cloud turns lime and price CLOSES below the sma (200).
Neutral: When the both sma make the death cross.
Cautious: When the cloud is green and price is above the sma (200).
In case you missed the entry point you can jump in when price CLOSES above sma (50). So after it searched for support on that line.
There are also two exit points in this strategy.
Cautious: When price closes on the other side of the sma (50).
Neutral: When the cloud changes color.
Aggressive: When price closes on the other side of the sma (200). There's always the opportunity that the price searches for support at the sma (200) line and goes from that moment in the direction you want.
Don't wait for the cross of the both sma. Very usually you give a huge part of your profit away at that point.
Remember: Above the cloud is bullish area, never go short there. Below the cloud is bearish area, never go long there.
Remember 2: When the clouds changes rapidly from color we're not in a trend. The sma (200) will be almost flat at those situations. It's a sign not to go into a trade since the market doesn't know in which direction it will go.

Smart Money Index (SMI) Strategy Attention:
If you would to use this indicator on the ES, you should have intraday data 60min in your account.
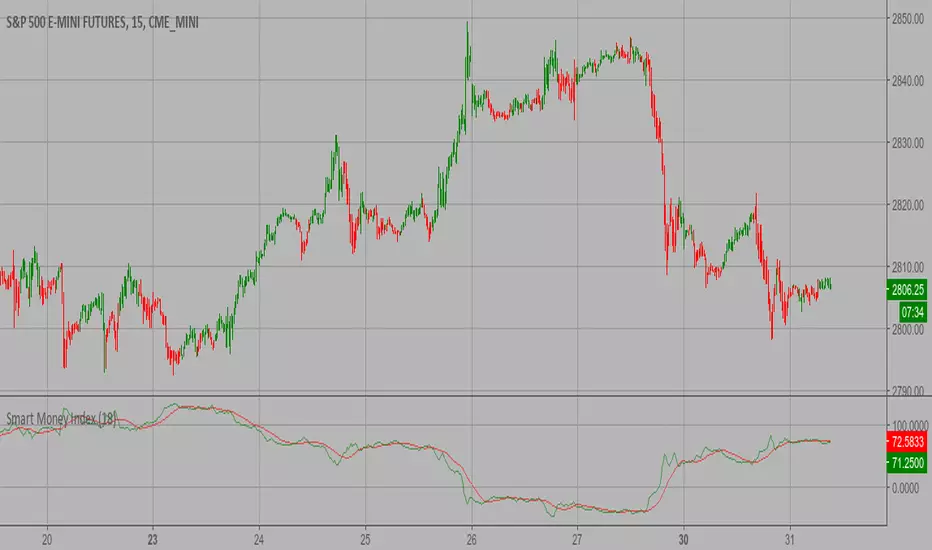
Smart money index (SMI) or smart money flow index is a technical analysis indicator demonstrating investors sentiment.
The index was invented and popularized by money manager Don Hays. The indicator is based on intra-day price patterns.
The main idea is that the majority of traders (emotional, news-driven) overreact at the beginning of the trading day
because of the overnight news and economic data. There is also a lot of buying on market orders and short covering at the opening.
Smart, experienced investors start trading closer to the end of the day having the opportunity to evaluate market performance.
Therefore, the basic strategy is to bet against the morning price trend and bet with the evening price trend. The SMI may be calculated
for many markets and market indices (S&P 500, DJIA, etc.)
The SMI sends no clear signal whether the market is bullish or bearish. There are also no fixed absolute or relative readings signaling
about the trend. Traders need to look at the SMI dynamics relative to that of the market. If, for example, SMI rises sharply when the
market falls, this fact would mean that smart money is buying, and the market is to revert to an uptrend soon. The opposite situation
is also true. A rapidly falling SMI during a bullish market means that smart money is selling and that market is to revert to a downtrend
soon. The SMI is, therefore, a trend-based indicator.
Some analysts use the smart money index to claim that precious metals such as gold will continually maintain value in the future.
WARNING:
- This script to change bars colors.
Percent difference between price and MA Strategy Percent difference between price and MA Strategy
WARNING:
- This script to change bars colors.

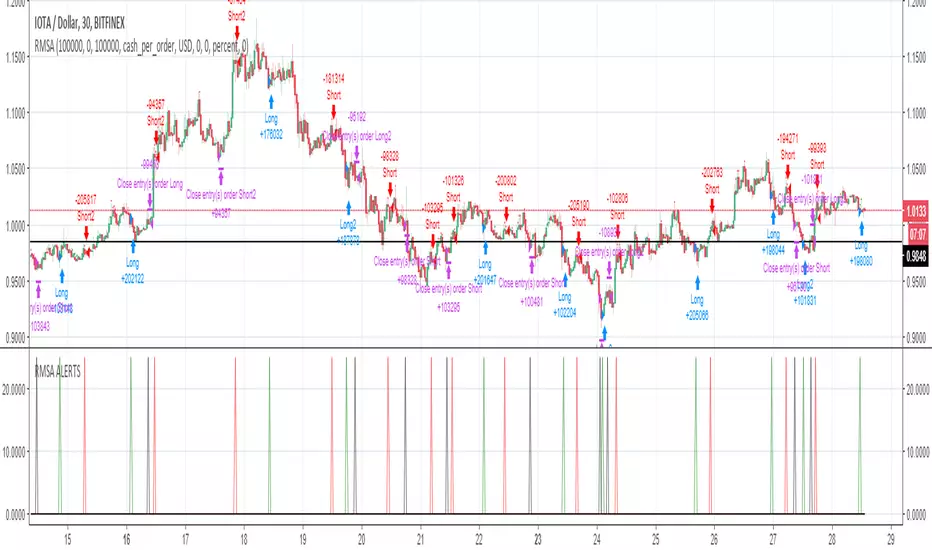
RMSA - Strategy - BTC/IOT/BCH/EOS - no repaint ALERTSHi Alerts for Strategy
Put alerts on Bar closed
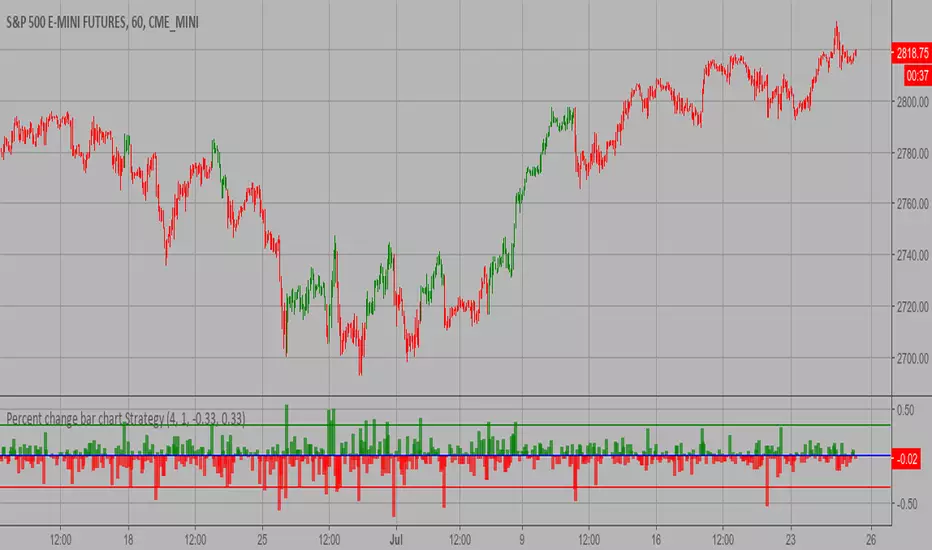
Percent change bar chart Strategy This histogram displays price or % change from previous bar.
WARNING:
- This script to change bars colors.
Miscbot 5m 2.2aAn automated strategy utilizing Autoview and Bitmex on the 5m.
Use at your own risk. I take no responsibility lost currency using this.
Link to strategy:

Modified Price-Volume Trend Strategy The related article is copyrighted material from
Stocks & Commodities.
Strategy by HPotter.
WARNING:
- This script to change bars colors.

Last High and Low Level Strategy This script shows a high and low period value.
SelectPeriod - Day or Week or Month and etc.
LookBackPeriods - Shift levels 0 - current period, 1 - previous and etc.
WARNING:
- This script to change bars colors

CM_Ultimate_MA_MTF_V2 with Alert Long and Short Hello All,
Here is a scirpt of ChrisMoody modified with the alerts of purchases and sales.
I just have a problem with automation. At the bottom of my script my alerts "Buy1" and "Sell2" give alerts constantly and I wish to have a single alert before the order is completed. Before "Sell1" or Buy2 ".
I found the function "barstate.isfirst" that could possibly work?
Does anyone have an idea ? :)

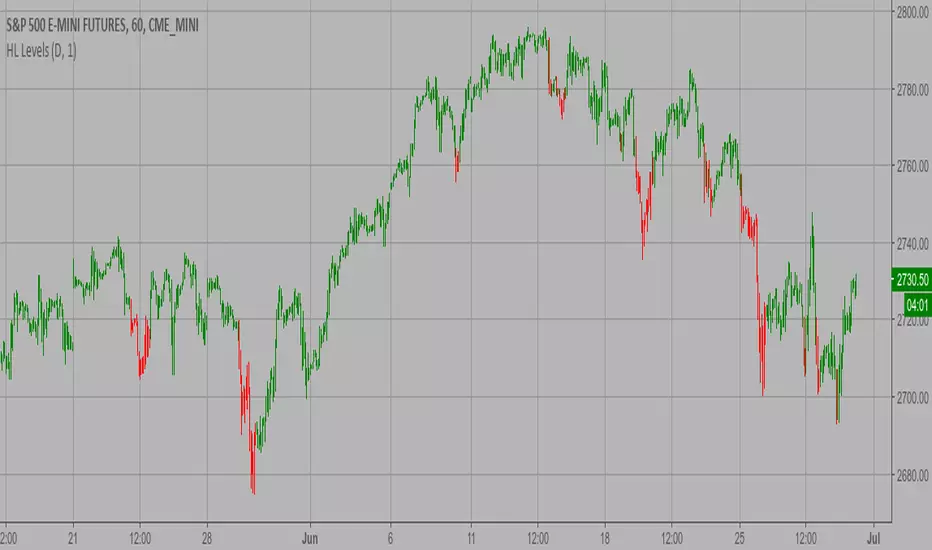
High and Low Levels Strategy This script shows a high and low period value.
Width - width of lines
SelectPeriod - Day or Week or Month and etc.
LookBack - Shift levels 0 - current period, 1 - previous and etc.
WARNING:
- This script to change bars colors.
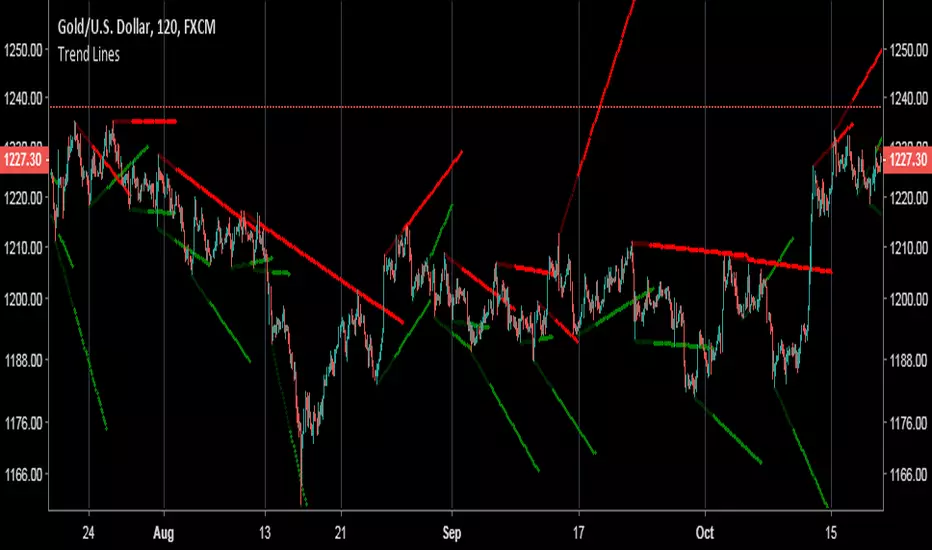
Free Trend Lines Tool/IndicatorI don't trade much with trend lines, but I was bored so made this hopefully someone will make use of it or program a strategy with it or something like that. It finds the highs and lows, works out the distance in time and price, then uses that to calculate the angle of the trend which can be used to pain the trend line. If you have any questions on how to implement it into a strategy feel free to ask. It is written in quite a messy wayt so sorry about that.

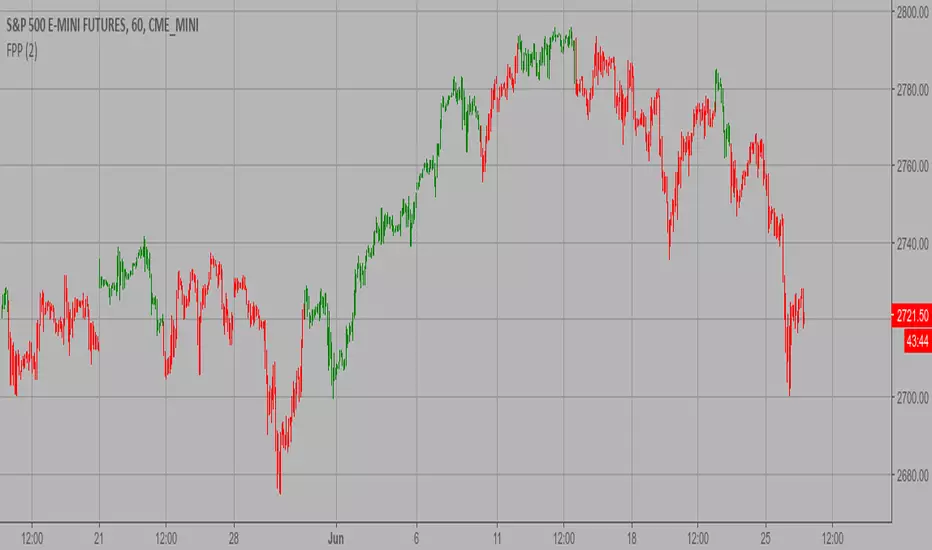
Floor Pivot Points Strategy The name ‘Floor-Trader Pivot,’ came from the fact that Pivot points can
be calculated quickly, on the fly using price data from the previous day
as an input. Although time-frames of less than a day can be used, Pivots are
commonly plotted on the Daily Chart; using price data from the previous day’s
trading activity.
WARNING:
- This script to change bars colors.
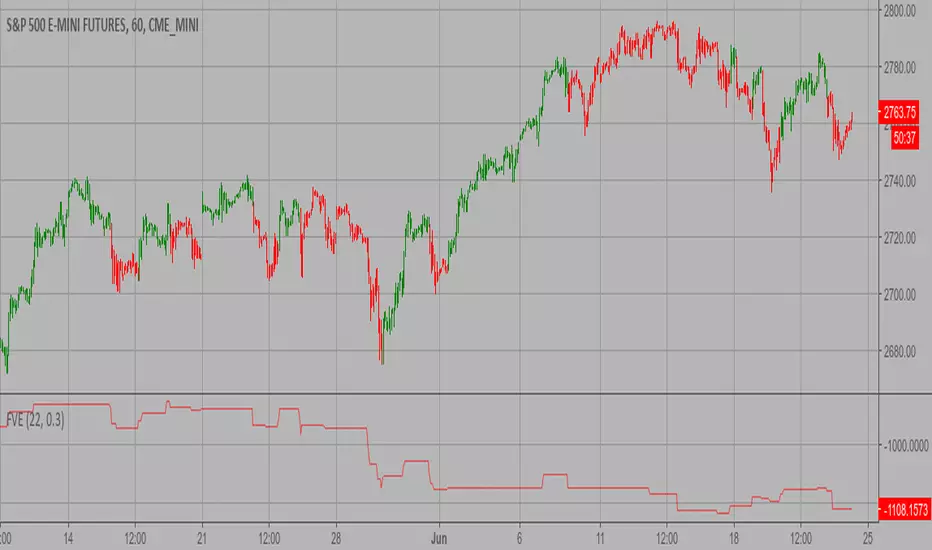
Finite Volume Elements (FVE) Strategy The FVE is a pure volume indicator. Unlike most of the other indicators
(except OBV), price change doesn?t come into the equation for the FVE (price
is not multiplied by volume), but is only used to determine whether money is
flowing in or out of the stock. This is contrary to the current trend in the
design of modern money flow indicators. The author decided against a price-volume
indicator for the following reasons:
- A pure volume indicator has more power to contradict.
- The number of buyers or sellers (which is assessed by volume) will be the same,
regardless of the price fluctuation.
- Price-volume indicators tend to spike excessively at breakouts or breakdowns.
WARNING:
- This script to change bars colors.

Omni Trader | RMI EMA RSI VOL | Margin Focused Indicator Version 1.0
Background
I'm happy to release my latest and most complex indicator, 'Omni Trader', this was programmed for but absolutely not limited to margin trading (BTC & ETH) and over the course of the indicator testing has yielded great results. Furthermore, the word omni translated to 'all' or 'of all things' which is exactly what this indicator is about, it can be used for swing trading, scalp trading, margin trading all done manually or via automated methods eg. Autoview.
Regarding the testing, it was primarily done on 5M candles on BTCUSD and ETHUSD and are where the default settings will fit most appropriately on first inspection, however, this tool has been programmed to have copious amounts of customisation for you to tweak and adjust to your trading style, please see the features outlined below for details:
Features
UI: Perfectly clear UI configured so the user can easily identify where signals are triggering along the chart and where areas of conditional logic is taking place with a colour scheme that is easy on the eye.
Logic: 3 levels of base logic (toggleable) to display entries and exits ranging from 'All Trades' to more conservative levels, restricting signals.
UI: Restrict Signal Repeats is a toggleable option to restrict subsequent signals triggering straight after each other, this optional is of main use in automated trading (Autoview)
Logic: Volume is an toggleable parameter will fully customisable settings that allows you to influence the signal logic by including it in conditional logic
Logic: RMI is one of the main indicators to form your signals based on momentum, fully customisable as always, the advantage of this indicator is that because its momentum based it give you signals around the clock regardless of time frame (in contrast to eg. RSI which will often not have one half of the signals for prolonged periods of time due to market conditions/direction)
Logic: EMA is also one of the main set of tools used to form the signals and is heavily influenced by the 3 levels of base logic mentioned earlier that are toggleable but also you can customise each EMA length to suit to your strategy, the defaults are ideal for faster time-frames.
Logic: A new programmed feature called signal limited that I have developed, this is an RSI based trigger that you can set a custom time-frame for, it will restrict your signals based on OS/OB conditions too, eg. you wont create longs if the ticker is very overbought on the 1D time frame - extremely useful for optimising trades.
Future
As with all my indicators, I have a series of updates and versions planned to improve this indicator further. Early adopters get the benefit of a cheaper access price and also having their say in how they want the indicator to be tailored and improved. Omni Trader is already a complete indicator that can be used to make profit, but the future updates will be focused on quality of life and further conditional logic additions to optimise it further.
Access
Trial access to this indicator is done via my discord server and community listed below, you can request access on there. Those who do not use discord, contact me directly on TV.
Discord Link: discord.gg

Fibonacci Algo - LongAutomatic Fibonacci retracement entry, stop loss and extension target level as apart of a customisable strategy.
Automatic plots of 23.6% 38.2%, 50%, 61.8%, 65%, 78.6% and -23.6, -61.8% and -100% levels.
Customisable Fib Length - Time period over which max and min pivots are chosen.
Customisable Offsetfib - Offsets the pivots and sell zone as your entry position
will be some time after the upper and lower pivots are set.
Vegas Wave - Automatic plot. Shows price relative to wave and EMA crossover - See my 'Vegas Wave' code for more of an explanation.
A strategy based off buying the 50-618 with a defined stop loss the other side of the 65 or 786 can easily be formulated.
This tool will automatically plot those points but a defined Risk Management strategy will always be needed.
The 236 and 382 region can also be plotted, allowing for lesser retracements coinciding with wave 4 pullbacks ( Elliott Wave Traders).
Works best in Bullish trends but will work on all timeframes (Bullish correction in an downtrend also possible).
Previous pivots shown but be careful to identify which of the several pivots you are using.
Start at a larger timeframe and move down. (Entries consistent on several timeframes are golden)
Pivots and retracements are dynamic. Be sure to note your entry and targets.
Works well when used in combination with an oscillator which highlights Divergence.
Also refer to my other 'Fibonacci' Codes for more context.

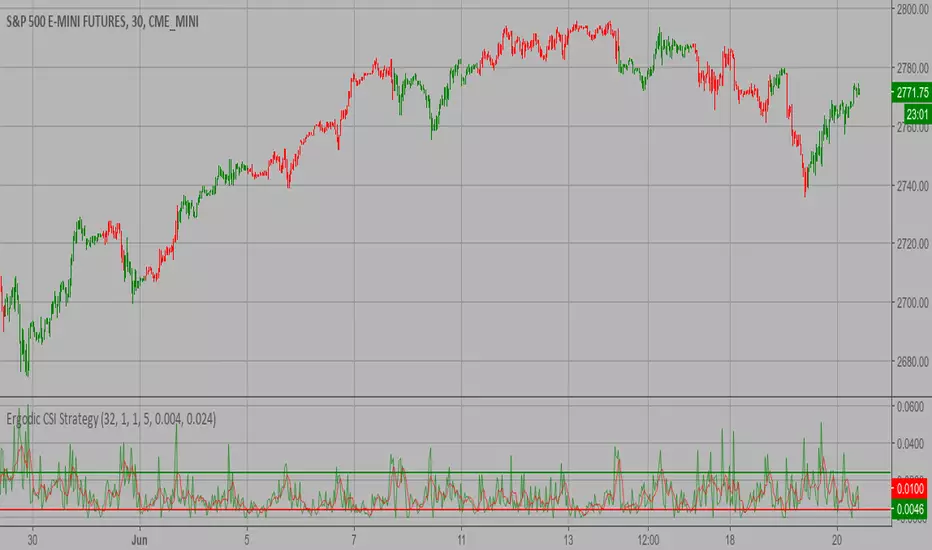
Ergodic CSI Strategy This is one of the techniques described by William Blau in his book
"Momentum, Direction and Divergence" (1995). If you like to learn more,
we advise you to read this book. His book focuses on three key aspects
of trading: momentum, direction and divergence. Blau, who was an electrical
engineer before becoming a trader, thoroughly examines the relationship between
price and momentum in step-by-step examples. From this grounding, he then looks
at the deficiencies in other oscillators and introduces some innovative techniques,
including a fresh twist on Stochastics. On directional issues, he analyzes the
intricacies of ADX and offers a unique approach to help define trending and
non-trending periods.
This indicator plots Ergotic CSI and smoothed Ergotic CSI to filter out noise.
WARNING:
- This script to change bars colors.
GBTC Premium to NAV IndicatorWhen bitcoin is in an uptrend, a very profitable strategy is to buy GBTC when premium to NAV is low, and sell when it reaches extremes. This can be far more profitable than buying bitcoin itself.
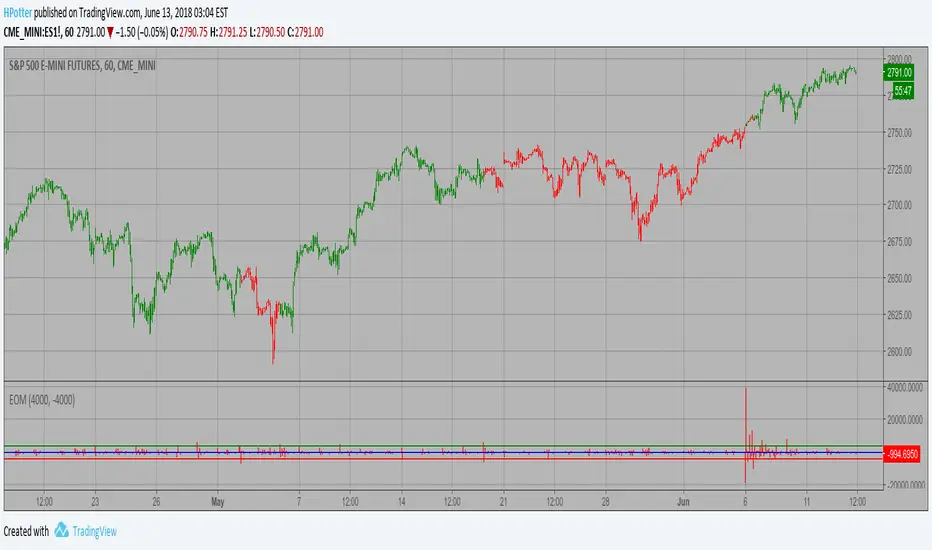
Ease of Movement (EOM) Strategy This indicator gauges the magnitude of price and volume movement.
The indicator returns both positive and negative values where a
positive value means the market has moved up from yesterday's value
and a negative value means the market has moved down. A large positive
or large negative value indicates a large move in price and/or lighter
volume. A small positive or small negative value indicates a small move
in price and/or heavier volume.
A positive or negative numeric value. A positive value means the market
has moved up from yesterday's value, whereas, a negative value means the
market has moved down.
WARNING:
- This script to change bars colors.
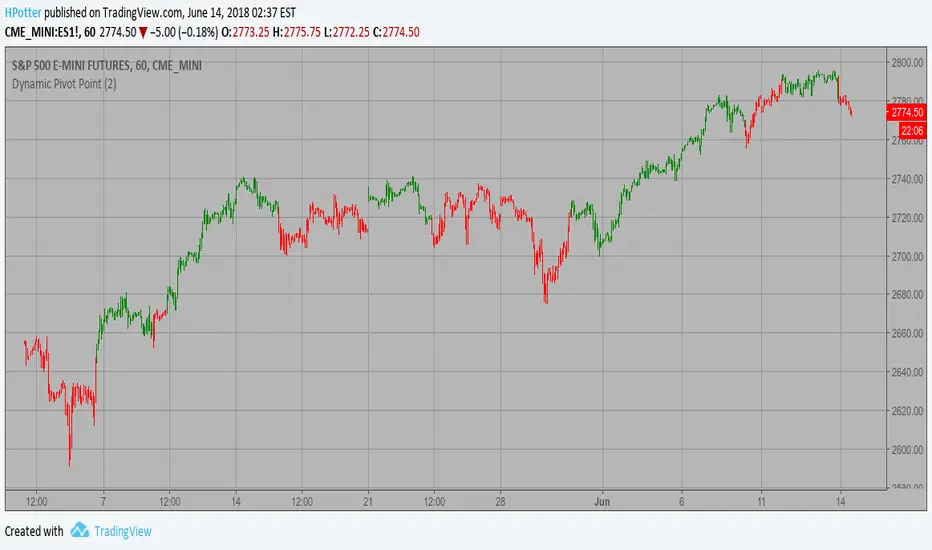
Dynamic Pivot Point Strategy This Pivot points is calculated on the current day.
Pivot points simply took the high, low, and closing price from the previous period and
divided by 3 to find the pivot. From this pivot, traders would then base their
calculations for three support, and three resistance levels. The calculation for the most
basic flavor of pivot points, known as ‘floor-trader pivots’, along with their support and
resistance levels.
WARNING:
- This script to change bars colors.
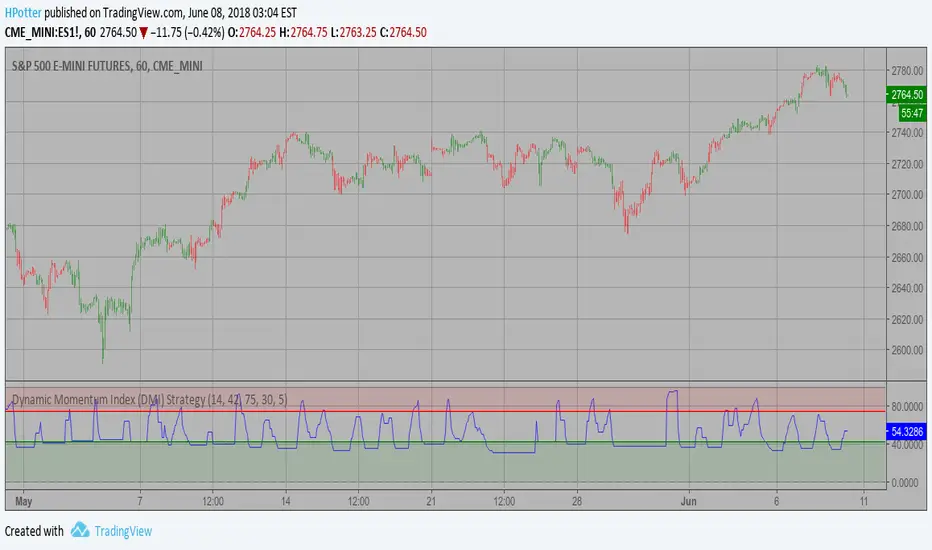
Dynamic Momentum Index (DMI) Strategy This indicator plots Dynamic Momentum Index indicator. The Dynamic Momentum
Index (DMI) was developed by Tushar Chande and Stanley Kroll. The indicator
is covered in detail in their book The New Technical Trader.
The DMI is identical to Welles Wilder`s Relative Strength Index except the
number of periods is variable rather than fixed. The variability of the time
periods used in the DMI is controlled by the recent volatility of prices.
The more volatile the prices, the more sensitive the DMI is to price changes.
In other words, the DMI will use more time periods during quiet markets, and
less during active markets. The maximum time periods the DMI can reach is 30
and the minimum is 3. This calculation method is similar to the Variable
Moving Average, also developed by Tushar Chande.
The advantage of using a variable length time period when calculating the RSI
is that it overcomes the negative effects of smoothing, which often obscure short-term moves.
The volatility index used in controlling the time periods in the DMI is based
on a calculation using a five period standard deviation and a ten period average
of the standard deviation.
WARNING:
- This script to change bars colors.