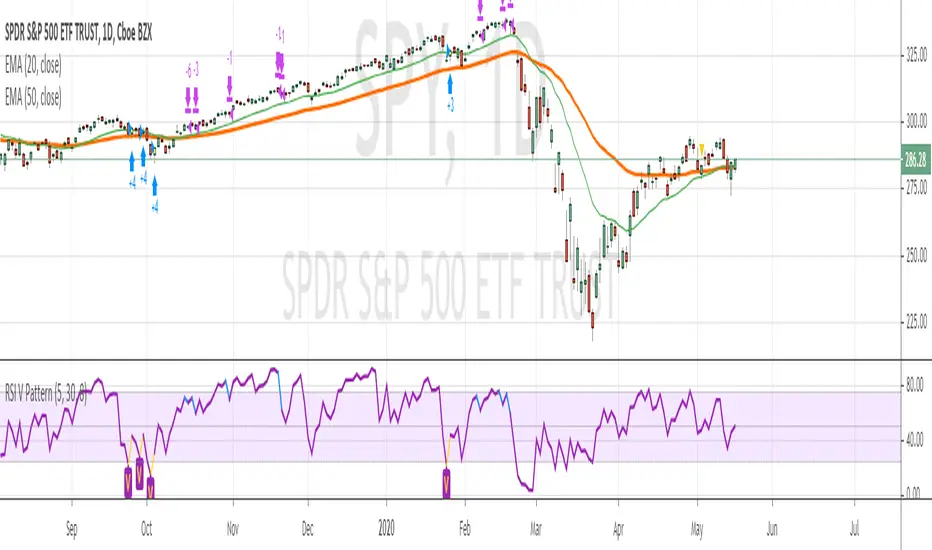
RSI V Pattern strategyThis strategy based on RSI for swing trading or short term trading
Strategy Rules
=============
LONG
1. ema20 is above ema50 --- candles are colored green on the chart
2. RSI value sharply coming up
previous candle1 low is previous candle2 low and previous candle1 RSI value is less than previous candle2
current candle RSI value is greater than previous candle1 and crossing above 30
above which makes a V shape on RSI indicator, colored in yellow on the chart , price bar is colored in yellow
3. Enter Long when the above V pattern occurs
EXIT LONG
1. when the RSI reaches 70 , close half position and move stop loss to up
2. when RSI reaches high value 90, close 3/4 position
3. when RSI crossing below 10 OR stopLoss hit , whichever happens first , close whole position
Note : take profit levels are colored in blue on RSI and Price candles
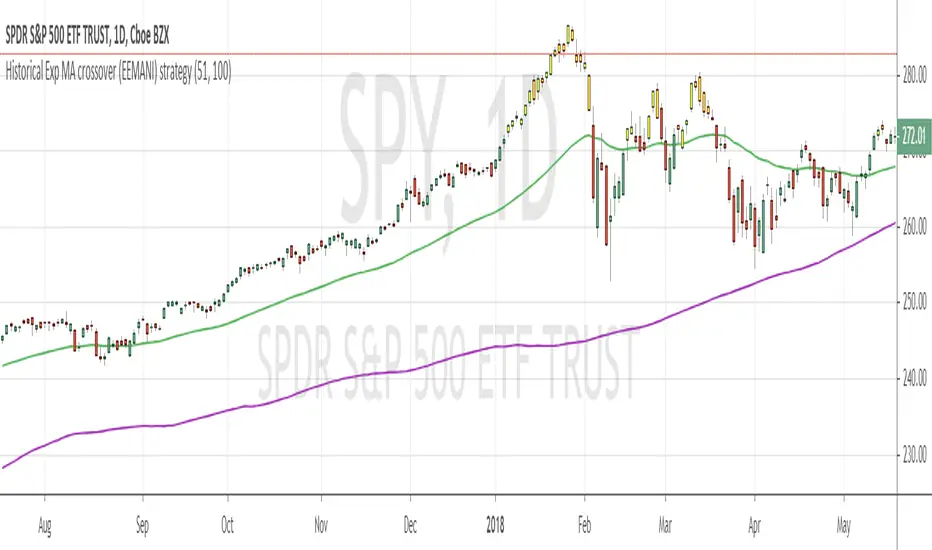
I have tested SPY , QQQ on daily chart , performance results are with 80% win rate and more than 3 profit factor
Happy Trading
Strategia Pine Script®